Immigrants from Russia vs Assyrian/Chaldean/Syriac Married-couple Households
COMPARE
Immigrants from Russia
Assyrian/Chaldean/Syriac
Married-couple Households
Married-couple Households Comparison
Immigrants from Russia
Assyrians/Chaldeans/Syriacs
47.0%
MARRIED-COUPLE HOUSEHOLDS
77.6/ 100
METRIC RATING
150th/ 347
METRIC RANK
51.8%
MARRIED-COUPLE HOUSEHOLDS
100.0/ 100
METRIC RATING
4th/ 347
METRIC RANK
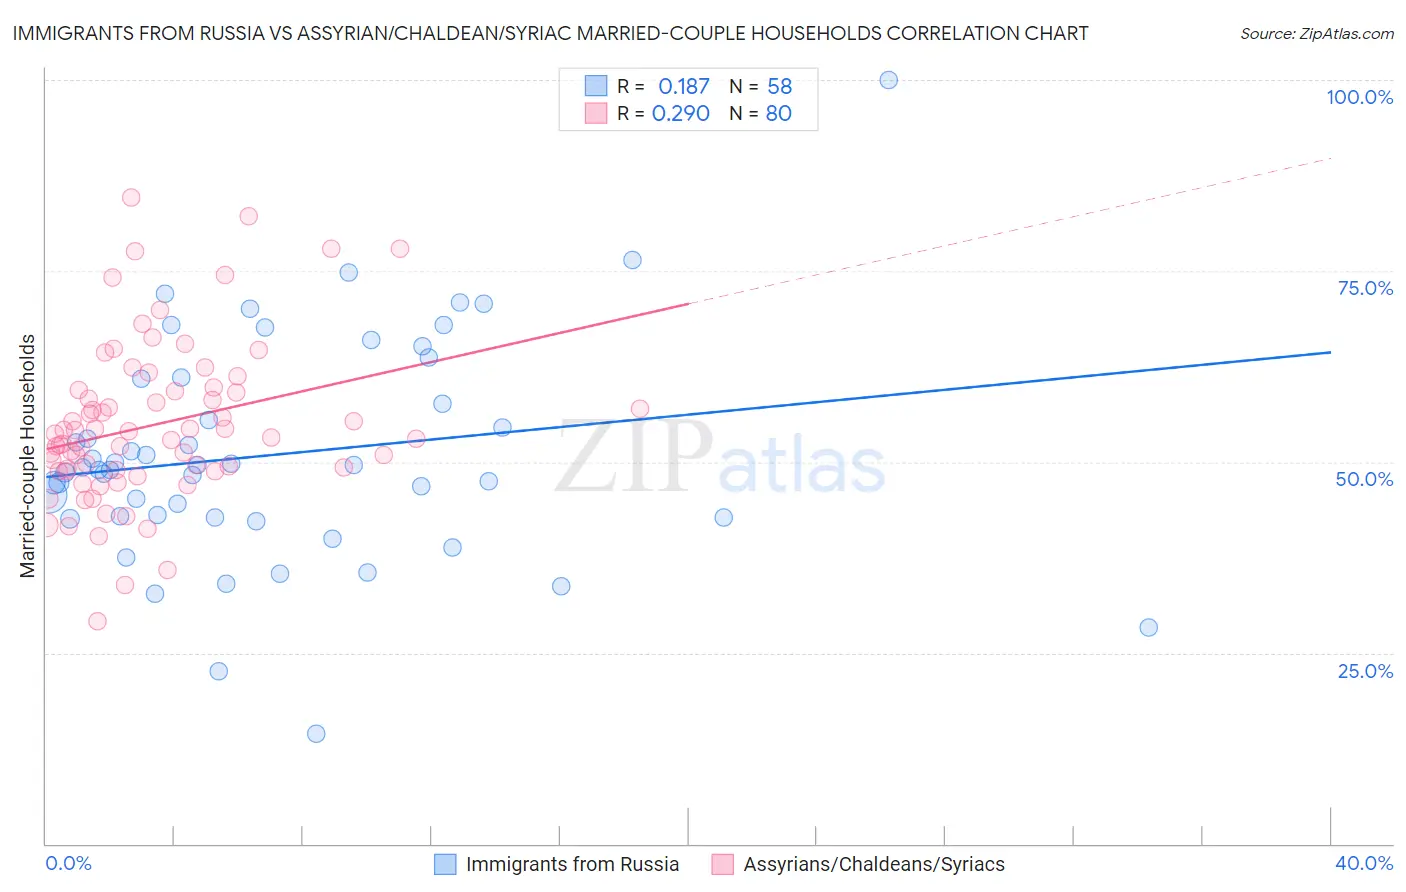
Immigrants from Russia vs Assyrian/Chaldean/Syriac Married-couple Households Correlation Chart
The statistical analysis conducted on geographies consisting of 347,712,373 people shows a poor positive correlation between the proportion of Immigrants from Russia and percentage of married-couple family households in the United States with a correlation coefficient (R) of 0.187 and weighted average of 47.0%. Similarly, the statistical analysis conducted on geographies consisting of 110,294,582 people shows a weak positive correlation between the proportion of Assyrians/Chaldeans/Syriacs and percentage of married-couple family households in the United States with a correlation coefficient (R) of 0.290 and weighted average of 51.8%, a difference of 10.3%.
Married-couple Households Correlation Summary
| Measurement | Immigrants from Russia | Assyrian/Chaldean/Syriac |
| Minimum | 14.4% | 29.2% |
| Maximum | 100.0% | 84.7% |
| Range | 85.6% | 55.5% |
| Mean | 51.0% | 54.9% |
| Median | 49.1% | 53.4% |
| Interquartile 25% (IQ1) | 42.8% | 48.9% |
| Interquartile 75% (IQ3) | 60.9% | 59.3% |
| Interquartile Range (IQR) | 18.1% | 10.4% |
| Standard Deviation (Sample) | 14.5% | 10.5% |
| Standard Deviation (Population) | 14.4% | 10.4% |
Similar Demographics by Married-couple Households
Demographics Similar to Immigrants from Russia by Married-couple Households
In terms of married-couple households, the demographic groups most similar to Immigrants from Russia are Immigrants from Bulgaria (47.0%, a difference of 0.050%), Paraguayan (47.0%, a difference of 0.060%), Serbian (47.0%, a difference of 0.070%), Hmong (47.0%, a difference of 0.080%), and Immigrants from Western Asia (46.9%, a difference of 0.080%).
| Demographics | Rating | Rank | Married-couple Households |
| Immigrants | Belarus | 83.8 /100 | #143 | Excellent 47.2% |
| Mexicans | 83.4 /100 | #144 | Excellent 47.1% |
| Slovenes | 81.7 /100 | #145 | Excellent 47.1% |
| Immigrants | Western Europe | 81.6 /100 | #146 | Excellent 47.1% |
| Immigrants | Syria | 81.6 /100 | #147 | Excellent 47.1% |
| Icelanders | 79.5 /100 | #148 | Good 47.0% |
| Paraguayans | 78.7 /100 | #149 | Good 47.0% |
| Immigrants | Russia | 77.6 /100 | #150 | Good 47.0% |
| Immigrants | Bulgaria | 76.8 /100 | #151 | Good 47.0% |
| Serbians | 76.3 /100 | #152 | Good 47.0% |
| Hmong | 76.2 /100 | #153 | Good 47.0% |
| Immigrants | Western Asia | 76.1 /100 | #154 | Good 46.9% |
| Arabs | 76.0 /100 | #155 | Good 46.9% |
| Armenians | 75.4 /100 | #156 | Good 46.9% |
| Immigrants | Oceania | 74.8 /100 | #157 | Good 46.9% |
Demographics Similar to Assyrians/Chaldeans/Syriacs by Married-couple Households
In terms of married-couple households, the demographic groups most similar to Assyrians/Chaldeans/Syriacs are Thai (51.9%, a difference of 0.21%), Tongan (51.6%, a difference of 0.48%), Immigrants from Taiwan (52.4%, a difference of 1.2%), Danish (51.1%, a difference of 1.5%), and Filipino (51.0%, a difference of 1.7%).
| Demographics | Rating | Rank | Married-couple Households |
| Immigrants | India | 100.0 /100 | #1 | Exceptional 52.7% |
| Immigrants | Taiwan | 100.0 /100 | #2 | Exceptional 52.4% |
| Thais | 100.0 /100 | #3 | Exceptional 51.9% |
| Assyrians/Chaldeans/Syriacs | 100.0 /100 | #4 | Exceptional 51.8% |
| Tongans | 100.0 /100 | #5 | Exceptional 51.6% |
| Danes | 100.0 /100 | #6 | Exceptional 51.1% |
| Filipinos | 100.0 /100 | #7 | Exceptional 51.0% |
| Immigrants | South Central Asia | 100.0 /100 | #8 | Exceptional 50.6% |
| Pennsylvania Germans | 100.0 /100 | #9 | Exceptional 50.4% |
| Chinese | 100.0 /100 | #10 | Exceptional 50.4% |
| Immigrants | Pakistan | 100.0 /100 | #11 | Exceptional 50.1% |
| Swiss | 100.0 /100 | #12 | Exceptional 49.9% |
| Immigrants | Korea | 100.0 /100 | #13 | Exceptional 49.9% |
| Burmese | 100.0 /100 | #14 | Exceptional 49.8% |
| Koreans | 99.9 /100 | #15 | Exceptional 49.7% |