Immigrants from Russia vs Immigrants from Kenya Married-couple Households
COMPARE
Immigrants from Russia
Immigrants from Kenya
Married-couple Households
Married-couple Households Comparison
Immigrants from Russia
Immigrants from Kenya
47.0%
MARRIED-COUPLE HOUSEHOLDS
77.6/ 100
METRIC RATING
150th/ 347
METRIC RANK
44.1%
MARRIED-COUPLE HOUSEHOLDS
0.4/ 100
METRIC RATING
249th/ 347
METRIC RANK
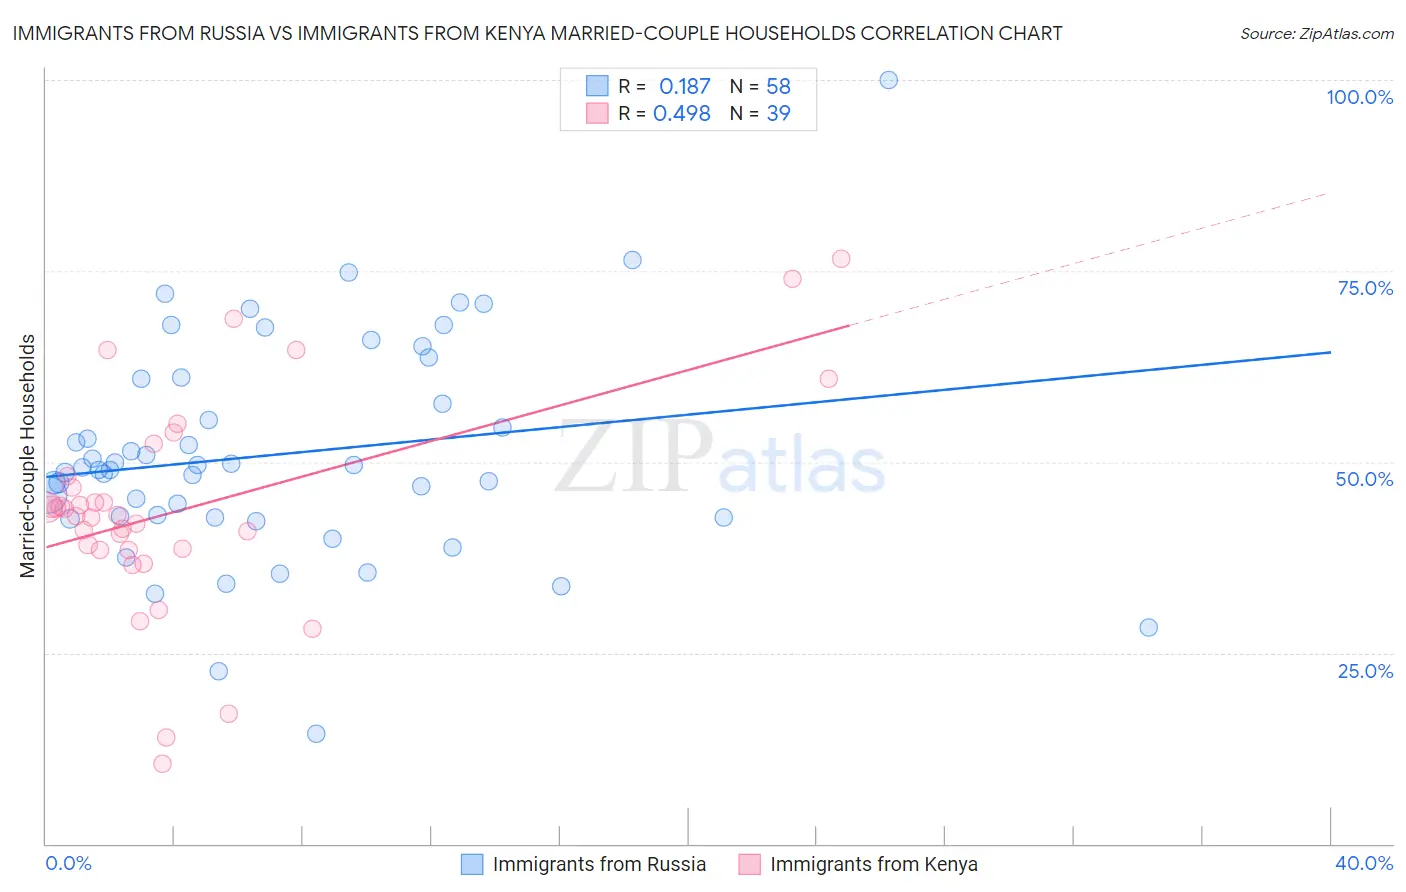
Immigrants from Russia vs Immigrants from Kenya Married-couple Households Correlation Chart
The statistical analysis conducted on geographies consisting of 347,712,373 people shows a poor positive correlation between the proportion of Immigrants from Russia and percentage of married-couple family households in the United States with a correlation coefficient (R) of 0.187 and weighted average of 47.0%. Similarly, the statistical analysis conducted on geographies consisting of 217,996,178 people shows a moderate positive correlation between the proportion of Immigrants from Kenya and percentage of married-couple family households in the United States with a correlation coefficient (R) of 0.498 and weighted average of 44.1%, a difference of 6.7%.
Married-couple Households Correlation Summary
| Measurement | Immigrants from Russia | Immigrants from Kenya |
| Minimum | 14.4% | 10.5% |
| Maximum | 100.0% | 76.7% |
| Range | 85.6% | 66.2% |
| Mean | 51.0% | 43.9% |
| Median | 49.1% | 43.1% |
| Interquartile 25% (IQ1) | 42.8% | 38.5% |
| Interquartile 75% (IQ3) | 60.9% | 48.1% |
| Interquartile Range (IQR) | 18.1% | 9.6% |
| Standard Deviation (Sample) | 14.5% | 14.3% |
| Standard Deviation (Population) | 14.4% | 14.1% |
Similar Demographics by Married-couple Households
Demographics Similar to Immigrants from Russia by Married-couple Households
In terms of married-couple households, the demographic groups most similar to Immigrants from Russia are Immigrants from Bulgaria (47.0%, a difference of 0.050%), Paraguayan (47.0%, a difference of 0.060%), Serbian (47.0%, a difference of 0.070%), Hmong (47.0%, a difference of 0.080%), and Immigrants from Western Asia (46.9%, a difference of 0.080%).
| Demographics | Rating | Rank | Married-couple Households |
| Immigrants | Belarus | 83.8 /100 | #143 | Excellent 47.2% |
| Mexicans | 83.4 /100 | #144 | Excellent 47.1% |
| Slovenes | 81.7 /100 | #145 | Excellent 47.1% |
| Immigrants | Western Europe | 81.6 /100 | #146 | Excellent 47.1% |
| Immigrants | Syria | 81.6 /100 | #147 | Excellent 47.1% |
| Icelanders | 79.5 /100 | #148 | Good 47.0% |
| Paraguayans | 78.7 /100 | #149 | Good 47.0% |
| Immigrants | Russia | 77.6 /100 | #150 | Good 47.0% |
| Immigrants | Bulgaria | 76.8 /100 | #151 | Good 47.0% |
| Serbians | 76.3 /100 | #152 | Good 47.0% |
| Hmong | 76.2 /100 | #153 | Good 47.0% |
| Immigrants | Western Asia | 76.1 /100 | #154 | Good 46.9% |
| Arabs | 76.0 /100 | #155 | Good 46.9% |
| Armenians | 75.4 /100 | #156 | Good 46.9% |
| Immigrants | Oceania | 74.8 /100 | #157 | Good 46.9% |
Demographics Similar to Immigrants from Kenya by Married-couple Households
In terms of married-couple households, the demographic groups most similar to Immigrants from Kenya are French American Indian (44.1%, a difference of 0.010%), Yup'ik (44.1%, a difference of 0.050%), German Russian (44.0%, a difference of 0.090%), Seminole (44.0%, a difference of 0.16%), and Central American (43.9%, a difference of 0.28%).
| Demographics | Rating | Rank | Married-couple Households |
| Immigrants | Albania | 1.0 /100 | #242 | Tragic 44.4% |
| Immigrants | Saudi Arabia | 0.9 /100 | #243 | Tragic 44.4% |
| Immigrants | Armenia | 0.7 /100 | #244 | Tragic 44.3% |
| Immigrants | El Salvador | 0.7 /100 | #245 | Tragic 44.3% |
| Immigrants | Cuba | 0.6 /100 | #246 | Tragic 44.2% |
| Immigrants | Morocco | 0.6 /100 | #247 | Tragic 44.2% |
| Yup'ik | 0.4 /100 | #248 | Tragic 44.1% |
| Immigrants | Kenya | 0.4 /100 | #249 | Tragic 44.1% |
| French American Indians | 0.4 /100 | #250 | Tragic 44.1% |
| German Russians | 0.4 /100 | #251 | Tragic 44.0% |
| Seminole | 0.4 /100 | #252 | Tragic 44.0% |
| Central Americans | 0.3 /100 | #253 | Tragic 43.9% |
| Apache | 0.3 /100 | #254 | Tragic 43.9% |
| Shoshone | 0.3 /100 | #255 | Tragic 43.9% |
| Ugandans | 0.3 /100 | #256 | Tragic 43.8% |