Immigrants from Honduras vs Immigrants from Poland Married-couple Households
COMPARE
Immigrants from Honduras
Immigrants from Poland
Married-couple Households
Married-couple Households Comparison
Immigrants from Honduras
Immigrants from Poland
41.6%
MARRIED-COUPLE HOUSEHOLDS
0.0/ 100
METRIC RATING
302nd/ 347
METRIC RANK
48.1%
MARRIED-COUPLE HOUSEHOLDS
97.7/ 100
METRIC RATING
82nd/ 347
METRIC RANK
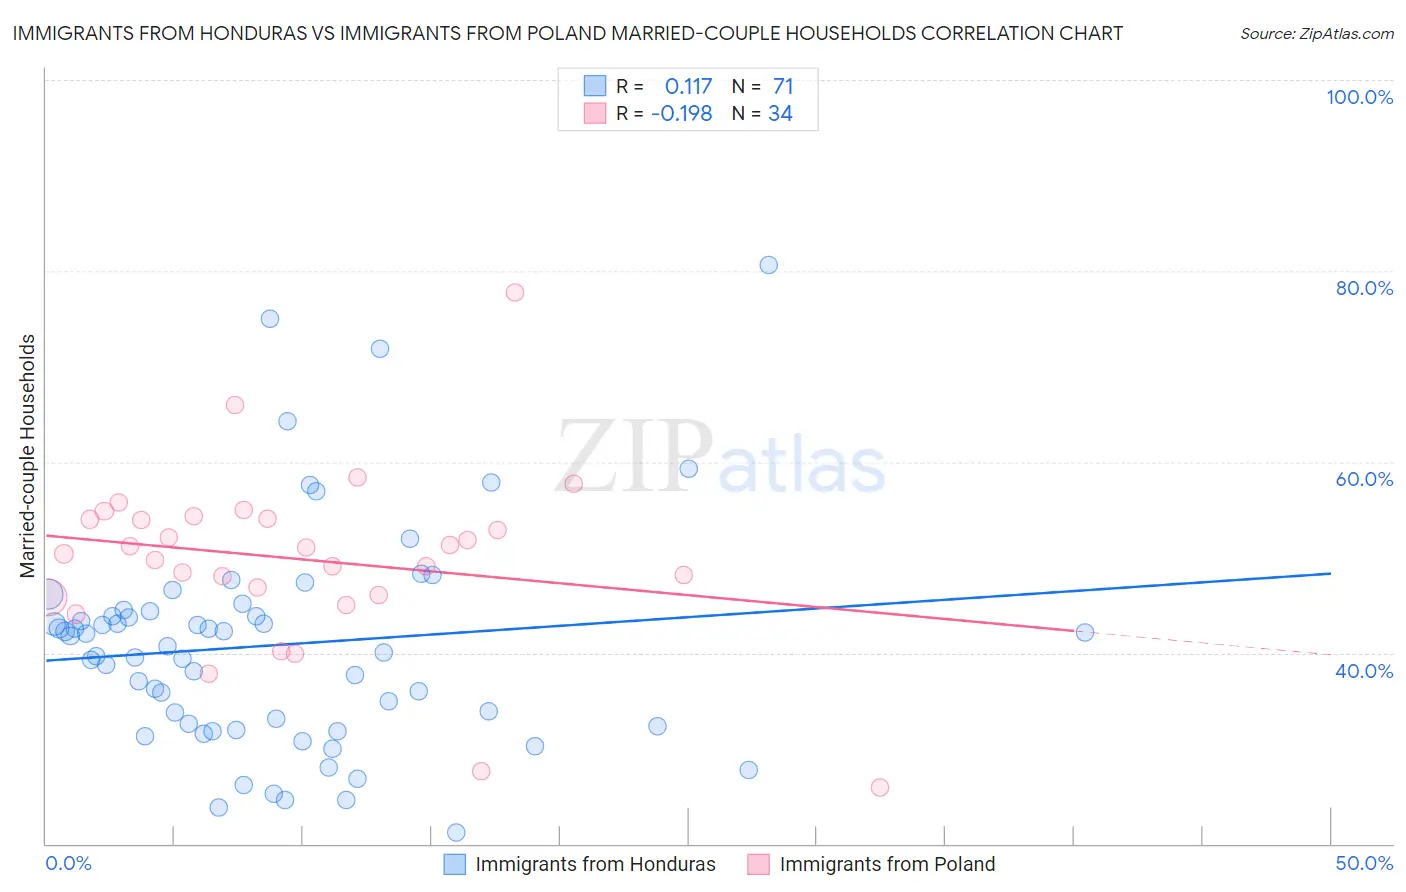
Immigrants from Honduras vs Immigrants from Poland Married-couple Households Correlation Chart
The statistical analysis conducted on geographies consisting of 322,465,433 people shows a poor positive correlation between the proportion of Immigrants from Honduras and percentage of married-couple family households in the United States with a correlation coefficient (R) of 0.117 and weighted average of 41.6%. Similarly, the statistical analysis conducted on geographies consisting of 304,780,020 people shows a poor negative correlation between the proportion of Immigrants from Poland and percentage of married-couple family households in the United States with a correlation coefficient (R) of -0.198 and weighted average of 48.1%, a difference of 15.5%.
Married-couple Households Correlation Summary
| Measurement | Immigrants from Honduras | Immigrants from Poland |
| Minimum | 21.2% | 25.9% |
| Maximum | 80.6% | 77.7% |
| Range | 59.5% | 51.8% |
| Mean | 40.8% | 49.8% |
| Median | 40.7% | 50.8% |
| Interquartile 25% (IQ1) | 32.3% | 46.0% |
| Interquartile 75% (IQ3) | 44.4% | 54.1% |
| Interquartile Range (IQR) | 12.1% | 8.1% |
| Standard Deviation (Sample) | 11.5% | 9.3% |
| Standard Deviation (Population) | 11.5% | 9.2% |
Similar Demographics by Married-couple Households
Demographics Similar to Immigrants from Honduras by Married-couple Households
In terms of married-couple households, the demographic groups most similar to Immigrants from Honduras are Subsaharan African (41.6%, a difference of 0.0%), Immigrants from Guyana (41.6%, a difference of 0.12%), Immigrants from Bahamas (41.7%, a difference of 0.17%), Sioux (41.5%, a difference of 0.23%), and Immigrants from Belize (41.8%, a difference of 0.38%).
| Demographics | Rating | Rank | Married-couple Households |
| Kiowa | 0.0 /100 | #295 | Tragic 42.0% |
| Immigrants | Sudan | 0.0 /100 | #296 | Tragic 41.9% |
| Arapaho | 0.0 /100 | #297 | Tragic 41.8% |
| Immigrants | Middle Africa | 0.0 /100 | #298 | Tragic 41.8% |
| Immigrants | Ghana | 0.0 /100 | #299 | Tragic 41.8% |
| Immigrants | Belize | 0.0 /100 | #300 | Tragic 41.8% |
| Immigrants | Bahamas | 0.0 /100 | #301 | Tragic 41.7% |
| Immigrants | Honduras | 0.0 /100 | #302 | Tragic 41.6% |
| Sub-Saharan Africans | 0.0 /100 | #303 | Tragic 41.6% |
| Immigrants | Guyana | 0.0 /100 | #304 | Tragic 41.6% |
| Sioux | 0.0 /100 | #305 | Tragic 41.5% |
| Guyanese | 0.0 /100 | #306 | Tragic 41.4% |
| Immigrants | Western Africa | 0.0 /100 | #307 | Tragic 41.4% |
| Crow | 0.0 /100 | #308 | Tragic 41.4% |
| Immigrants | Trinidad and Tobago | 0.0 /100 | #309 | Tragic 41.2% |
Demographics Similar to Immigrants from Poland by Married-couple Households
In terms of married-couple households, the demographic groups most similar to Immigrants from Poland are Guamanian/Chamorro (48.1%, a difference of 0.020%), Ukrainian (48.1%, a difference of 0.040%), Immigrants from Israel (48.0%, a difference of 0.090%), Belgian (48.0%, a difference of 0.11%), and Immigrants from Ireland (48.0%, a difference of 0.13%).
| Demographics | Rating | Rank | Married-couple Households |
| Immigrants | England | 98.4 /100 | #75 | Exceptional 48.2% |
| Immigrants | Fiji | 98.4 /100 | #76 | Exceptional 48.2% |
| Canadians | 98.2 /100 | #77 | Exceptional 48.2% |
| Egyptians | 98.2 /100 | #78 | Exceptional 48.2% |
| Immigrants | Netherlands | 98.2 /100 | #79 | Exceptional 48.2% |
| Russians | 98.1 /100 | #80 | Exceptional 48.2% |
| Finns | 98.0 /100 | #81 | Exceptional 48.1% |
| Immigrants | Poland | 97.7 /100 | #82 | Exceptional 48.1% |
| Guamanians/Chamorros | 97.6 /100 | #83 | Exceptional 48.1% |
| Ukrainians | 97.6 /100 | #84 | Exceptional 48.1% |
| Immigrants | Israel | 97.4 /100 | #85 | Exceptional 48.0% |
| Belgians | 97.4 /100 | #86 | Exceptional 48.0% |
| Immigrants | Ireland | 97.3 /100 | #87 | Exceptional 48.0% |
| Afghans | 97.3 /100 | #88 | Exceptional 48.0% |
| Cypriots | 97.2 /100 | #89 | Exceptional 48.0% |