Immigrants from Honduras vs Immigrants from Hungary Married-couple Households
COMPARE
Immigrants from Honduras
Immigrants from Hungary
Married-couple Households
Married-couple Households Comparison
Immigrants from Honduras
Immigrants from Hungary
41.6%
MARRIED-COUPLE HOUSEHOLDS
0.0/ 100
METRIC RATING
302nd/ 347
METRIC RANK
47.3%
MARRIED-COUPLE HOUSEHOLDS
87.8/ 100
METRIC RATING
130th/ 347
METRIC RANK
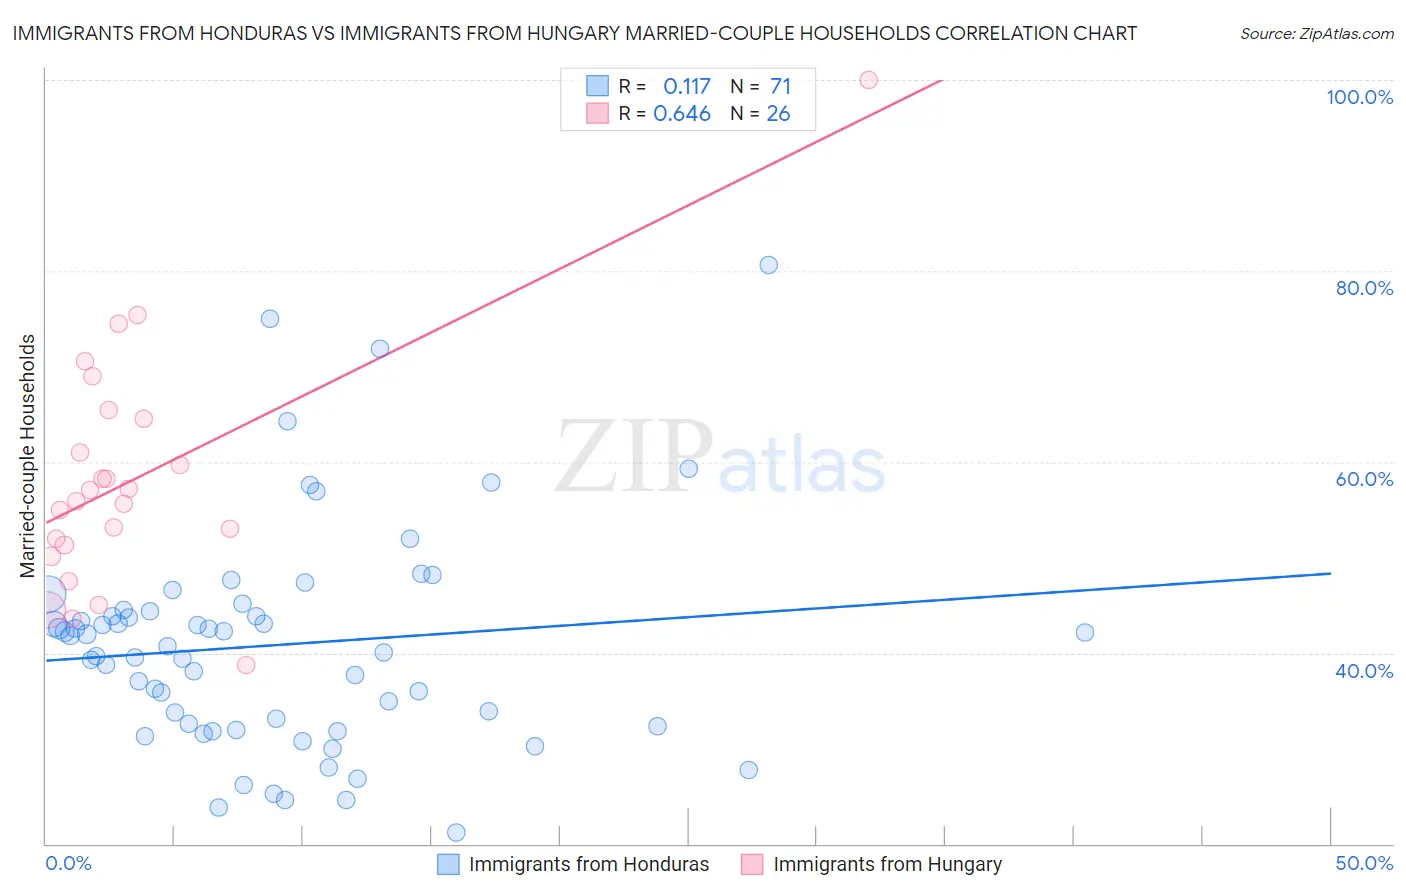
Immigrants from Honduras vs Immigrants from Hungary Married-couple Households Correlation Chart
The statistical analysis conducted on geographies consisting of 322,465,433 people shows a poor positive correlation between the proportion of Immigrants from Honduras and percentage of married-couple family households in the United States with a correlation coefficient (R) of 0.117 and weighted average of 41.6%. Similarly, the statistical analysis conducted on geographies consisting of 195,664,672 people shows a significant positive correlation between the proportion of Immigrants from Hungary and percentage of married-couple family households in the United States with a correlation coefficient (R) of 0.646 and weighted average of 47.3%, a difference of 13.7%.
Married-couple Households Correlation Summary
| Measurement | Immigrants from Honduras | Immigrants from Hungary |
| Minimum | 21.2% | 38.7% |
| Maximum | 80.6% | 100.0% |
| Range | 59.5% | 61.3% |
| Mean | 40.8% | 58.3% |
| Median | 40.7% | 56.5% |
| Interquartile 25% (IQ1) | 32.3% | 51.2% |
| Interquartile 75% (IQ3) | 44.4% | 64.5% |
| Interquartile Range (IQR) | 12.1% | 13.2% |
| Standard Deviation (Sample) | 11.5% | 12.6% |
| Standard Deviation (Population) | 11.5% | 12.4% |
Similar Demographics by Married-couple Households
Demographics Similar to Immigrants from Honduras by Married-couple Households
In terms of married-couple households, the demographic groups most similar to Immigrants from Honduras are Subsaharan African (41.6%, a difference of 0.0%), Immigrants from Guyana (41.6%, a difference of 0.12%), Immigrants from Bahamas (41.7%, a difference of 0.17%), Sioux (41.5%, a difference of 0.23%), and Immigrants from Belize (41.8%, a difference of 0.38%).
| Demographics | Rating | Rank | Married-couple Households |
| Kiowa | 0.0 /100 | #295 | Tragic 42.0% |
| Immigrants | Sudan | 0.0 /100 | #296 | Tragic 41.9% |
| Arapaho | 0.0 /100 | #297 | Tragic 41.8% |
| Immigrants | Middle Africa | 0.0 /100 | #298 | Tragic 41.8% |
| Immigrants | Ghana | 0.0 /100 | #299 | Tragic 41.8% |
| Immigrants | Belize | 0.0 /100 | #300 | Tragic 41.8% |
| Immigrants | Bahamas | 0.0 /100 | #301 | Tragic 41.7% |
| Immigrants | Honduras | 0.0 /100 | #302 | Tragic 41.6% |
| Sub-Saharan Africans | 0.0 /100 | #303 | Tragic 41.6% |
| Immigrants | Guyana | 0.0 /100 | #304 | Tragic 41.6% |
| Sioux | 0.0 /100 | #305 | Tragic 41.5% |
| Guyanese | 0.0 /100 | #306 | Tragic 41.4% |
| Immigrants | Western Africa | 0.0 /100 | #307 | Tragic 41.4% |
| Crow | 0.0 /100 | #308 | Tragic 41.4% |
| Immigrants | Trinidad and Tobago | 0.0 /100 | #309 | Tragic 41.2% |
Demographics Similar to Immigrants from Hungary by Married-couple Households
In terms of married-couple households, the demographic groups most similar to Immigrants from Hungary are Immigrants from Iraq (47.3%, a difference of 0.0%), Immigrants from Peru (47.3%, a difference of 0.010%), Immigrants from Denmark (47.3%, a difference of 0.020%), Celtic (47.3%, a difference of 0.030%), and Pakistani (47.3%, a difference of 0.070%).
| Demographics | Rating | Rank | Married-couple Households |
| Immigrants | Venezuela | 89.3 /100 | #123 | Excellent 47.4% |
| Zimbabweans | 89.2 /100 | #124 | Excellent 47.4% |
| Australians | 89.0 /100 | #125 | Excellent 47.4% |
| Pakistanis | 88.6 /100 | #126 | Excellent 47.3% |
| Celtics | 88.1 /100 | #127 | Excellent 47.3% |
| Immigrants | Peru | 87.9 /100 | #128 | Excellent 47.3% |
| Immigrants | Iraq | 87.8 /100 | #129 | Excellent 47.3% |
| Immigrants | Hungary | 87.8 /100 | #130 | Excellent 47.3% |
| Immigrants | Denmark | 87.5 /100 | #131 | Excellent 47.3% |
| Immigrants | Ukraine | 86.7 /100 | #132 | Excellent 47.3% |
| South Africans | 86.4 /100 | #133 | Excellent 47.3% |
| Immigrants | Greece | 86.0 /100 | #134 | Excellent 47.2% |
| Immigrants | Argentina | 86.0 /100 | #135 | Excellent 47.2% |
| New Zealanders | 85.3 /100 | #136 | Excellent 47.2% |
| Immigrants | Malaysia | 85.2 /100 | #137 | Excellent 47.2% |