Immigrants from Bangladesh vs Bulgarian Married-couple Households
COMPARE
Immigrants from Bangladesh
Bulgarian
Married-couple Households
Married-couple Households Comparison
Immigrants from Bangladesh
Bulgarians
43.1%
MARRIED-COUPLE HOUSEHOLDS
0.0/ 100
METRIC RATING
275th/ 347
METRIC RANK
48.5%
MARRIED-COUPLE HOUSEHOLDS
99.1/ 100
METRIC RATING
61st/ 347
METRIC RANK
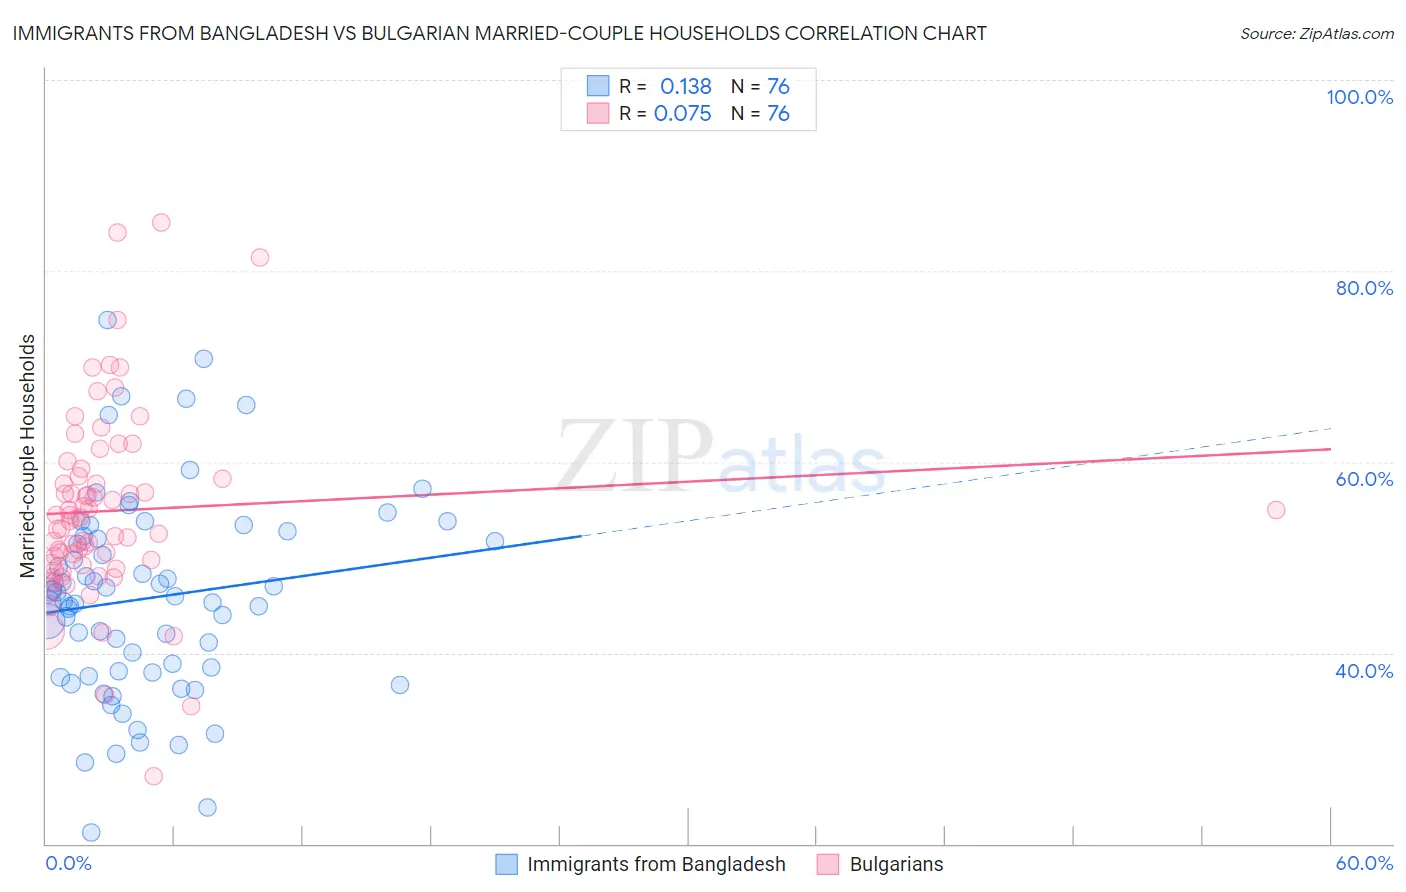
Immigrants from Bangladesh vs Bulgarian Married-couple Households Correlation Chart
The statistical analysis conducted on geographies consisting of 203,568,346 people shows a poor positive correlation between the proportion of Immigrants from Bangladesh and percentage of married-couple family households in the United States with a correlation coefficient (R) of 0.138 and weighted average of 43.1%. Similarly, the statistical analysis conducted on geographies consisting of 205,562,211 people shows a slight positive correlation between the proportion of Bulgarians and percentage of married-couple family households in the United States with a correlation coefficient (R) of 0.075 and weighted average of 48.5%, a difference of 12.5%.
Married-couple Households Correlation Summary
| Measurement | Immigrants from Bangladesh | Bulgarian |
| Minimum | 21.2% | 27.1% |
| Maximum | 74.9% | 85.1% |
| Range | 53.7% | 58.0% |
| Mean | 45.7% | 54.9% |
| Median | 45.7% | 53.9% |
| Interquartile 25% (IQ1) | 38.0% | 49.2% |
| Interquartile 75% (IQ3) | 52.1% | 58.4% |
| Interquartile Range (IQR) | 14.1% | 9.1% |
| Standard Deviation (Sample) | 10.5% | 10.0% |
| Standard Deviation (Population) | 10.4% | 9.9% |
Similar Demographics by Married-couple Households
Demographics Similar to Immigrants from Bangladesh by Married-couple Households
In terms of married-couple households, the demographic groups most similar to Immigrants from Bangladesh are Immigrants from Ethiopia (43.1%, a difference of 0.11%), Nigerian (43.2%, a difference of 0.14%), Ethiopian (43.2%, a difference of 0.15%), Immigrants from Nigeria (43.2%, a difference of 0.25%), and Guatemalan (43.3%, a difference of 0.35%).
| Demographics | Rating | Rank | Married-couple Households |
| Immigrants | Burma/Myanmar | 0.1 /100 | #268 | Tragic 43.4% |
| Immigrants | Sierra Leone | 0.1 /100 | #269 | Tragic 43.3% |
| Yuman | 0.1 /100 | #270 | Tragic 43.3% |
| Guatemalans | 0.1 /100 | #271 | Tragic 43.3% |
| Immigrants | Nigeria | 0.1 /100 | #272 | Tragic 43.2% |
| Ethiopians | 0.1 /100 | #273 | Tragic 43.2% |
| Nigerians | 0.1 /100 | #274 | Tragic 43.2% |
| Immigrants | Bangladesh | 0.0 /100 | #275 | Tragic 43.1% |
| Immigrants | Ethiopia | 0.0 /100 | #276 | Tragic 43.1% |
| Immigrants | Eastern Africa | 0.0 /100 | #277 | Tragic 42.9% |
| Immigrants | Africa | 0.0 /100 | #278 | Tragic 42.9% |
| Sierra Leoneans | 0.0 /100 | #279 | Tragic 42.9% |
| Immigrants | Ecuador | 0.0 /100 | #280 | Tragic 42.9% |
| Immigrants | Guatemala | 0.0 /100 | #281 | Tragic 42.8% |
| Bermudans | 0.0 /100 | #282 | Tragic 42.4% |
Demographics Similar to Bulgarians by Married-couple Households
In terms of married-couple households, the demographic groups most similar to Bulgarians are Luxembourger (48.5%, a difference of 0.0%), Croatian (48.5%, a difference of 0.050%), Basque (48.4%, a difference of 0.070%), Northern European (48.4%, a difference of 0.080%), and Immigrants from Canada (48.4%, a difference of 0.10%).
| Demographics | Rating | Rank | Married-couple Households |
| Immigrants | Lithuania | 99.3 /100 | #54 | Exceptional 48.6% |
| Austrians | 99.3 /100 | #55 | Exceptional 48.6% |
| Immigrants | Northern Europe | 99.3 /100 | #56 | Exceptional 48.6% |
| Poles | 99.2 /100 | #57 | Exceptional 48.5% |
| Immigrants | Indonesia | 99.2 /100 | #58 | Exceptional 48.5% |
| Czechoslovakians | 99.2 /100 | #59 | Exceptional 48.5% |
| Croatians | 99.1 /100 | #60 | Exceptional 48.5% |
| Bulgarians | 99.1 /100 | #61 | Exceptional 48.5% |
| Luxembourgers | 99.1 /100 | #62 | Exceptional 48.5% |
| Basques | 99.0 /100 | #63 | Exceptional 48.4% |
| Northern Europeans | 99.0 /100 | #64 | Exceptional 48.4% |
| Immigrants | Canada | 99.0 /100 | #65 | Exceptional 48.4% |
| Jordanians | 98.9 /100 | #66 | Exceptional 48.4% |
| Romanians | 98.9 /100 | #67 | Exceptional 48.4% |
| Immigrants | South Eastern Asia | 98.9 /100 | #68 | Exceptional 48.4% |