Kenyan vs Cree GED/Equivalency
COMPARE
Kenyan
Cree
GED/Equivalency
GED/Equivalency Comparison
Kenyans
Cree
86.3%
GED/EQUIVALENCY
76.6/ 100
METRIC RATING
153rd/ 347
METRIC RANK
85.0%
GED/EQUIVALENCY
15.9/ 100
METRIC RATING
202nd/ 347
METRIC RANK
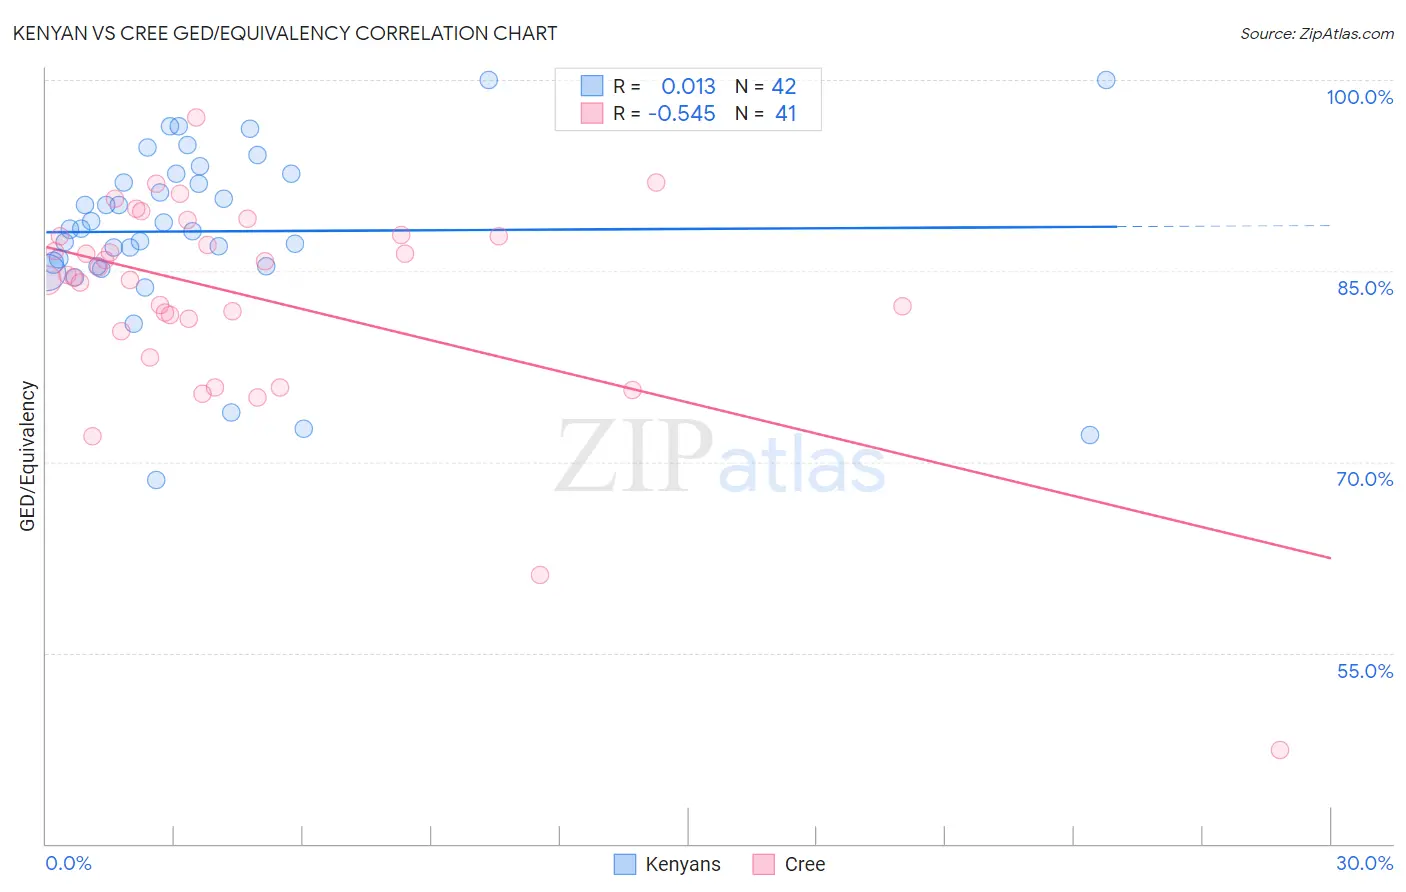
Kenyan vs Cree GED/Equivalency Correlation Chart
The statistical analysis conducted on geographies consisting of 168,244,481 people shows no correlation between the proportion of Kenyans and percentage of population with at least ged/equivalency education in the United States with a correlation coefficient (R) of 0.013 and weighted average of 86.3%. Similarly, the statistical analysis conducted on geographies consisting of 76,211,744 people shows a substantial negative correlation between the proportion of Cree and percentage of population with at least ged/equivalency education in the United States with a correlation coefficient (R) of -0.545 and weighted average of 85.0%, a difference of 1.5%.
GED/Equivalency Correlation Summary
| Measurement | Kenyan | Cree |
| Minimum | 68.6% | 47.4% |
| Maximum | 100.0% | 97.0% |
| Range | 31.4% | 49.7% |
| Mean | 88.1% | 83.0% |
| Median | 88.3% | 84.7% |
| Interquartile 25% (IQ1) | 85.3% | 80.8% |
| Interquartile 75% (IQ3) | 92.6% | 87.8% |
| Interquartile Range (IQR) | 7.3% | 7.0% |
| Standard Deviation (Sample) | 6.9% | 8.7% |
| Standard Deviation (Population) | 6.8% | 8.5% |
Similar Demographics by GED/Equivalency
Demographics Similar to Kenyans by GED/Equivalency
In terms of ged/equivalency, the demographic groups most similar to Kenyans are Armenian (86.3%, a difference of 0.0%), Brazilian (86.3%, a difference of 0.020%), Immigrants from Bosnia and Herzegovina (86.3%, a difference of 0.040%), Iraqi (86.2%, a difference of 0.040%), and Immigrants from Western Asia (86.3%, a difference of 0.070%).
| Demographics | Rating | Rank | GED/Equivalency |
| Basques | 79.5 /100 | #146 | Good 86.4% |
| Immigrants | Northern Africa | 79.3 /100 | #147 | Good 86.3% |
| Immigrants | Poland | 79.3 /100 | #148 | Good 86.3% |
| Menominee | 79.3 /100 | #149 | Good 86.3% |
| Immigrants | Western Asia | 78.8 /100 | #150 | Good 86.3% |
| Immigrants | Bosnia and Herzegovina | 77.9 /100 | #151 | Good 86.3% |
| Brazilians | 77.2 /100 | #152 | Good 86.3% |
| Kenyans | 76.6 /100 | #153 | Good 86.3% |
| Armenians | 76.4 /100 | #154 | Good 86.3% |
| Iraqis | 75.2 /100 | #155 | Good 86.2% |
| Immigrants | Nepal | 73.3 /100 | #156 | Good 86.2% |
| Whites/Caucasians | 72.2 /100 | #157 | Good 86.2% |
| German Russians | 72.1 /100 | #158 | Good 86.2% |
| Immigrants | Kenya | 71.8 /100 | #159 | Good 86.2% |
| Immigrants | Morocco | 69.5 /100 | #160 | Good 86.1% |
Demographics Similar to Cree by GED/Equivalency
In terms of ged/equivalency, the demographic groups most similar to Cree are Portuguese (85.0%, a difference of 0.0%), Uruguayan (85.0%, a difference of 0.010%), Somali (85.0%, a difference of 0.020%), Panamanian (85.0%, a difference of 0.020%), and Hawaiian (85.0%, a difference of 0.030%).
| Demographics | Rating | Rank | GED/Equivalency |
| Chippewa | 20.8 /100 | #195 | Fair 85.2% |
| Tongans | 20.7 /100 | #196 | Fair 85.2% |
| Costa Ricans | 20.4 /100 | #197 | Fair 85.2% |
| Immigrants | Africa | 17.5 /100 | #198 | Poor 85.1% |
| Somalis | 16.4 /100 | #199 | Poor 85.0% |
| Uruguayans | 16.0 /100 | #200 | Poor 85.0% |
| Portuguese | 15.9 /100 | #201 | Poor 85.0% |
| Cree | 15.9 /100 | #202 | Poor 85.0% |
| Panamanians | 15.3 /100 | #203 | Poor 85.0% |
| Hawaiians | 15.2 /100 | #204 | Poor 85.0% |
| Liberians | 14.6 /100 | #205 | Poor 85.0% |
| Samoans | 13.7 /100 | #206 | Poor 84.9% |
| Hmong | 13.1 /100 | #207 | Poor 84.9% |
| Marshallese | 12.5 /100 | #208 | Poor 84.9% |
| Colombians | 12.3 /100 | #209 | Poor 84.9% |