Kenyan vs Immigrants from Bulgaria GED/Equivalency
COMPARE
Kenyan
Immigrants from Bulgaria
GED/Equivalency
GED/Equivalency Comparison
Kenyans
Immigrants from Bulgaria
86.3%
GED/EQUIVALENCY
76.6/ 100
METRIC RATING
153rd/ 347
METRIC RANK
87.8%
GED/EQUIVALENCY
99.1/ 100
METRIC RATING
66th/ 347
METRIC RANK
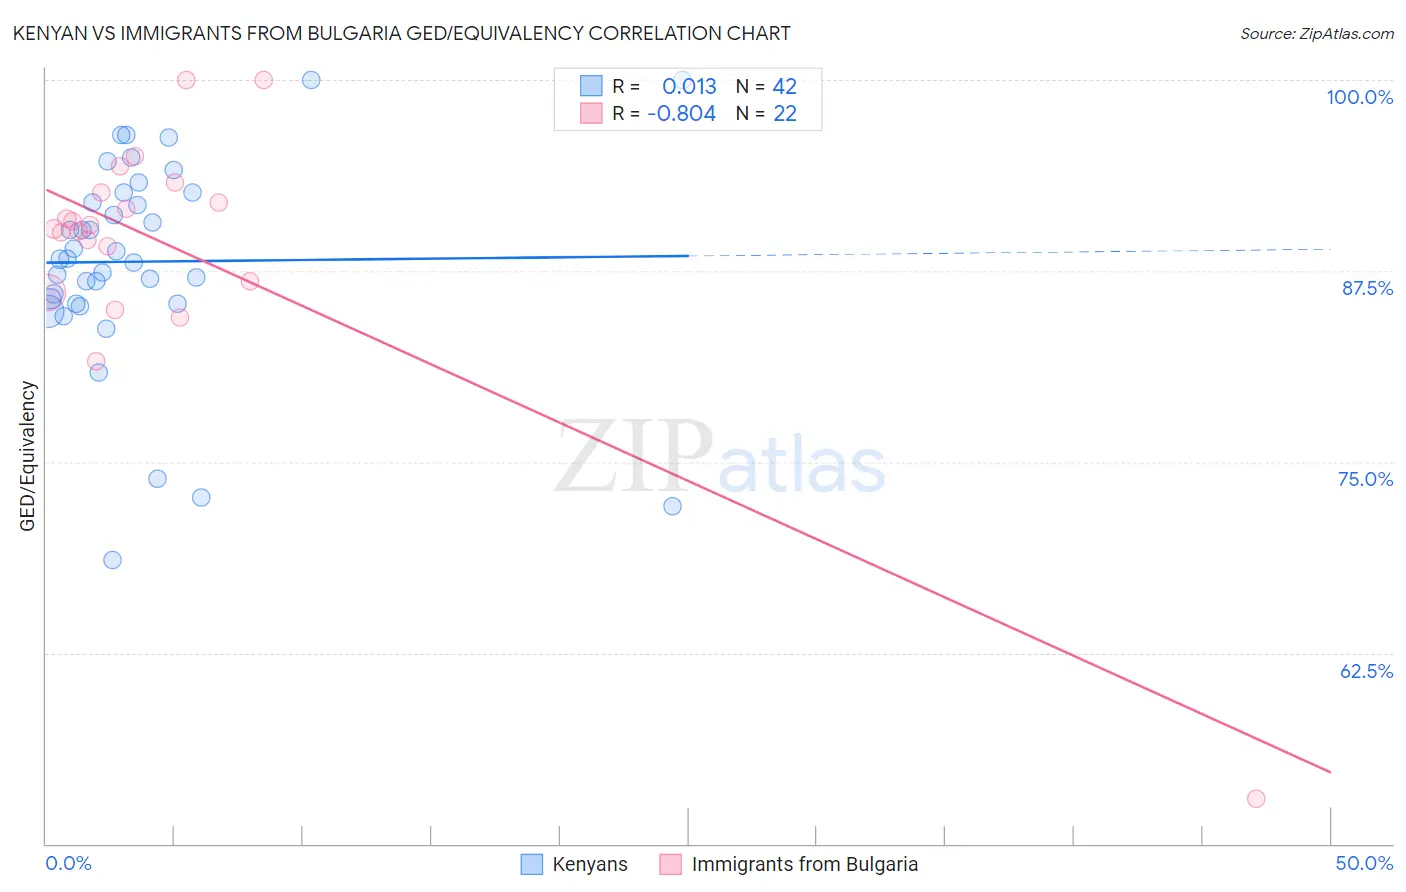
Kenyan vs Immigrants from Bulgaria GED/Equivalency Correlation Chart
The statistical analysis conducted on geographies consisting of 168,244,481 people shows no correlation between the proportion of Kenyans and percentage of population with at least ged/equivalency education in the United States with a correlation coefficient (R) of 0.013 and weighted average of 86.3%. Similarly, the statistical analysis conducted on geographies consisting of 172,552,181 people shows a very strong negative correlation between the proportion of Immigrants from Bulgaria and percentage of population with at least ged/equivalency education in the United States with a correlation coefficient (R) of -0.804 and weighted average of 87.8%, a difference of 1.8%.
GED/Equivalency Correlation Summary
| Measurement | Kenyan | Immigrants from Bulgaria |
| Minimum | 68.6% | 52.9% |
| Maximum | 100.0% | 100.0% |
| Range | 31.4% | 47.1% |
| Mean | 88.1% | 88.9% |
| Median | 88.3% | 90.4% |
| Interquartile 25% (IQ1) | 85.3% | 86.8% |
| Interquartile 75% (IQ3) | 92.6% | 92.6% |
| Interquartile Range (IQR) | 7.3% | 5.8% |
| Standard Deviation (Sample) | 6.9% | 9.2% |
| Standard Deviation (Population) | 6.8% | 9.0% |
Similar Demographics by GED/Equivalency
Demographics Similar to Kenyans by GED/Equivalency
In terms of ged/equivalency, the demographic groups most similar to Kenyans are Armenian (86.3%, a difference of 0.0%), Brazilian (86.3%, a difference of 0.020%), Immigrants from Bosnia and Herzegovina (86.3%, a difference of 0.040%), Iraqi (86.2%, a difference of 0.040%), and Immigrants from Western Asia (86.3%, a difference of 0.070%).
| Demographics | Rating | Rank | GED/Equivalency |
| Basques | 79.5 /100 | #146 | Good 86.4% |
| Immigrants | Northern Africa | 79.3 /100 | #147 | Good 86.3% |
| Immigrants | Poland | 79.3 /100 | #148 | Good 86.3% |
| Menominee | 79.3 /100 | #149 | Good 86.3% |
| Immigrants | Western Asia | 78.8 /100 | #150 | Good 86.3% |
| Immigrants | Bosnia and Herzegovina | 77.9 /100 | #151 | Good 86.3% |
| Brazilians | 77.2 /100 | #152 | Good 86.3% |
| Kenyans | 76.6 /100 | #153 | Good 86.3% |
| Armenians | 76.4 /100 | #154 | Good 86.3% |
| Iraqis | 75.2 /100 | #155 | Good 86.2% |
| Immigrants | Nepal | 73.3 /100 | #156 | Good 86.2% |
| Whites/Caucasians | 72.2 /100 | #157 | Good 86.2% |
| German Russians | 72.1 /100 | #158 | Good 86.2% |
| Immigrants | Kenya | 71.8 /100 | #159 | Good 86.2% |
| Immigrants | Morocco | 69.5 /100 | #160 | Good 86.1% |
Demographics Similar to Immigrants from Bulgaria by GED/Equivalency
In terms of ged/equivalency, the demographic groups most similar to Immigrants from Bulgaria are Immigrants from North America (87.8%, a difference of 0.0%), British (87.8%, a difference of 0.010%), Immigrants from France (87.8%, a difference of 0.010%), Immigrants from Canada (87.9%, a difference of 0.030%), and Immigrants from Turkey (87.9%, a difference of 0.070%).
| Demographics | Rating | Rank | GED/Equivalency |
| Serbians | 99.3 /100 | #59 | Exceptional 87.9% |
| Scandinavians | 99.3 /100 | #60 | Exceptional 87.9% |
| Europeans | 99.3 /100 | #61 | Exceptional 87.9% |
| Germans | 99.3 /100 | #62 | Exceptional 87.9% |
| Immigrants | Turkey | 99.2 /100 | #63 | Exceptional 87.9% |
| Immigrants | Canada | 99.2 /100 | #64 | Exceptional 87.9% |
| Immigrants | North America | 99.1 /100 | #65 | Exceptional 87.8% |
| Immigrants | Bulgaria | 99.1 /100 | #66 | Exceptional 87.8% |
| British | 99.1 /100 | #67 | Exceptional 87.8% |
| Immigrants | France | 99.1 /100 | #68 | Exceptional 87.8% |
| Immigrants | Saudi Arabia | 99.0 /100 | #69 | Exceptional 87.8% |
| Ukrainians | 98.8 /100 | #70 | Exceptional 87.7% |
| Austrians | 98.8 /100 | #71 | Exceptional 87.7% |
| Immigrants | Moldova | 98.8 /100 | #72 | Exceptional 87.7% |
| Belgians | 98.8 /100 | #73 | Exceptional 87.7% |