Kenyan vs Immigrants from Taiwan GED/Equivalency
COMPARE
Kenyan
Immigrants from Taiwan
GED/Equivalency
GED/Equivalency Comparison
Kenyans
Immigrants from Taiwan
86.3%
GED/EQUIVALENCY
76.6/ 100
METRIC RATING
153rd/ 347
METRIC RANK
88.8%
GED/EQUIVALENCY
99.9/ 100
METRIC RATING
16th/ 347
METRIC RANK
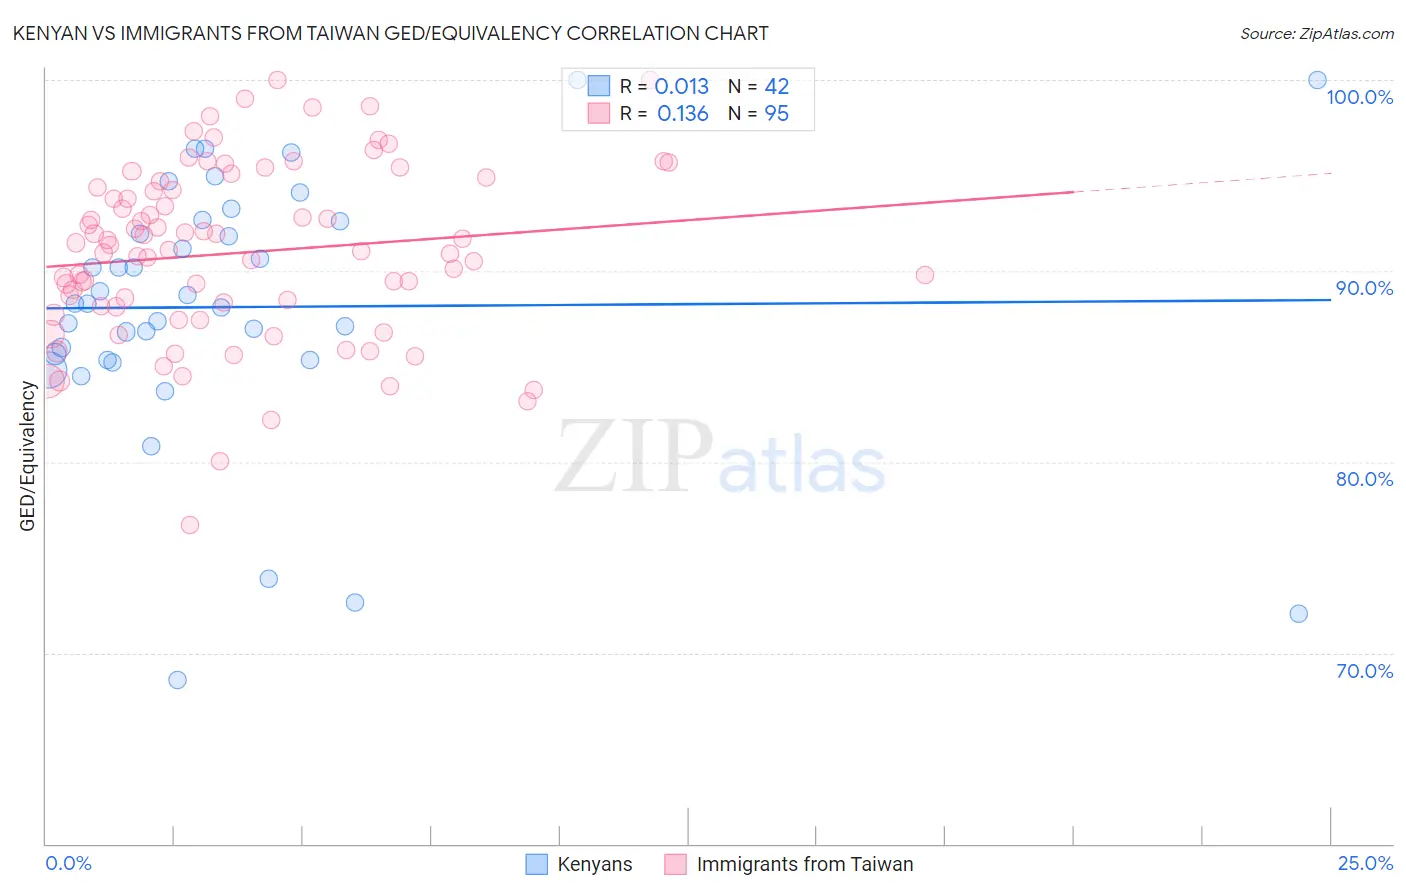
Kenyan vs Immigrants from Taiwan GED/Equivalency Correlation Chart
The statistical analysis conducted on geographies consisting of 168,244,481 people shows no correlation between the proportion of Kenyans and percentage of population with at least ged/equivalency education in the United States with a correlation coefficient (R) of 0.013 and weighted average of 86.3%. Similarly, the statistical analysis conducted on geographies consisting of 298,292,402 people shows a poor positive correlation between the proportion of Immigrants from Taiwan and percentage of population with at least ged/equivalency education in the United States with a correlation coefficient (R) of 0.136 and weighted average of 88.8%, a difference of 3.0%.
GED/Equivalency Correlation Summary
| Measurement | Kenyan | Immigrants from Taiwan |
| Minimum | 68.6% | 76.7% |
| Maximum | 100.0% | 100.0% |
| Range | 31.4% | 23.3% |
| Mean | 88.1% | 91.0% |
| Median | 88.3% | 91.1% |
| Interquartile 25% (IQ1) | 85.3% | 88.1% |
| Interquartile 75% (IQ3) | 92.6% | 94.4% |
| Interquartile Range (IQR) | 7.3% | 6.2% |
| Standard Deviation (Sample) | 6.9% | 4.6% |
| Standard Deviation (Population) | 6.8% | 4.5% |
Similar Demographics by GED/Equivalency
Demographics Similar to Kenyans by GED/Equivalency
In terms of ged/equivalency, the demographic groups most similar to Kenyans are Armenian (86.3%, a difference of 0.0%), Brazilian (86.3%, a difference of 0.020%), Immigrants from Bosnia and Herzegovina (86.3%, a difference of 0.040%), Iraqi (86.2%, a difference of 0.040%), and Immigrants from Western Asia (86.3%, a difference of 0.070%).
| Demographics | Rating | Rank | GED/Equivalency |
| Basques | 79.5 /100 | #146 | Good 86.4% |
| Immigrants | Northern Africa | 79.3 /100 | #147 | Good 86.3% |
| Immigrants | Poland | 79.3 /100 | #148 | Good 86.3% |
| Menominee | 79.3 /100 | #149 | Good 86.3% |
| Immigrants | Western Asia | 78.8 /100 | #150 | Good 86.3% |
| Immigrants | Bosnia and Herzegovina | 77.9 /100 | #151 | Good 86.3% |
| Brazilians | 77.2 /100 | #152 | Good 86.3% |
| Kenyans | 76.6 /100 | #153 | Good 86.3% |
| Armenians | 76.4 /100 | #154 | Good 86.3% |
| Iraqis | 75.2 /100 | #155 | Good 86.2% |
| Immigrants | Nepal | 73.3 /100 | #156 | Good 86.2% |
| Whites/Caucasians | 72.2 /100 | #157 | Good 86.2% |
| German Russians | 72.1 /100 | #158 | Good 86.2% |
| Immigrants | Kenya | 71.8 /100 | #159 | Good 86.2% |
| Immigrants | Morocco | 69.5 /100 | #160 | Good 86.1% |
Demographics Similar to Immigrants from Taiwan by GED/Equivalency
In terms of ged/equivalency, the demographic groups most similar to Immigrants from Taiwan are Okinawan (88.9%, a difference of 0.030%), Croatian (88.8%, a difference of 0.030%), Cypriot (88.9%, a difference of 0.050%), Slovene (88.8%, a difference of 0.060%), and Immigrants from Iran (88.9%, a difference of 0.080%).
| Demographics | Rating | Rank | GED/Equivalency |
| Chinese | 99.9 /100 | #9 | Exceptional 89.0% |
| Norwegians | 99.9 /100 | #10 | Exceptional 89.0% |
| Bulgarians | 99.9 /100 | #11 | Exceptional 89.0% |
| Lithuanians | 99.9 /100 | #12 | Exceptional 88.9% |
| Immigrants | Iran | 99.9 /100 | #13 | Exceptional 88.9% |
| Cypriots | 99.9 /100 | #14 | Exceptional 88.9% |
| Okinawans | 99.9 /100 | #15 | Exceptional 88.9% |
| Immigrants | Taiwan | 99.9 /100 | #16 | Exceptional 88.8% |
| Croatians | 99.9 /100 | #17 | Exceptional 88.8% |
| Slovenes | 99.9 /100 | #18 | Exceptional 88.8% |
| Swedes | 99.9 /100 | #19 | Exceptional 88.8% |
| Maltese | 99.9 /100 | #20 | Exceptional 88.6% |
| Luxembourgers | 99.8 /100 | #21 | Exceptional 88.6% |
| Immigrants | Ireland | 99.8 /100 | #22 | Exceptional 88.6% |
| Russians | 99.8 /100 | #23 | Exceptional 88.6% |