Immigrants from Nepal vs Immigrants from Liberia GED/Equivalency
COMPARE
Immigrants from Nepal
Immigrants from Liberia
GED/Equivalency
GED/Equivalency Comparison
Immigrants from Nepal
Immigrants from Liberia
86.2%
GED/EQUIVALENCY
73.3/ 100
METRIC RATING
156th/ 347
METRIC RANK
84.4%
GED/EQUIVALENCY
4.9/ 100
METRIC RATING
228th/ 347
METRIC RANK
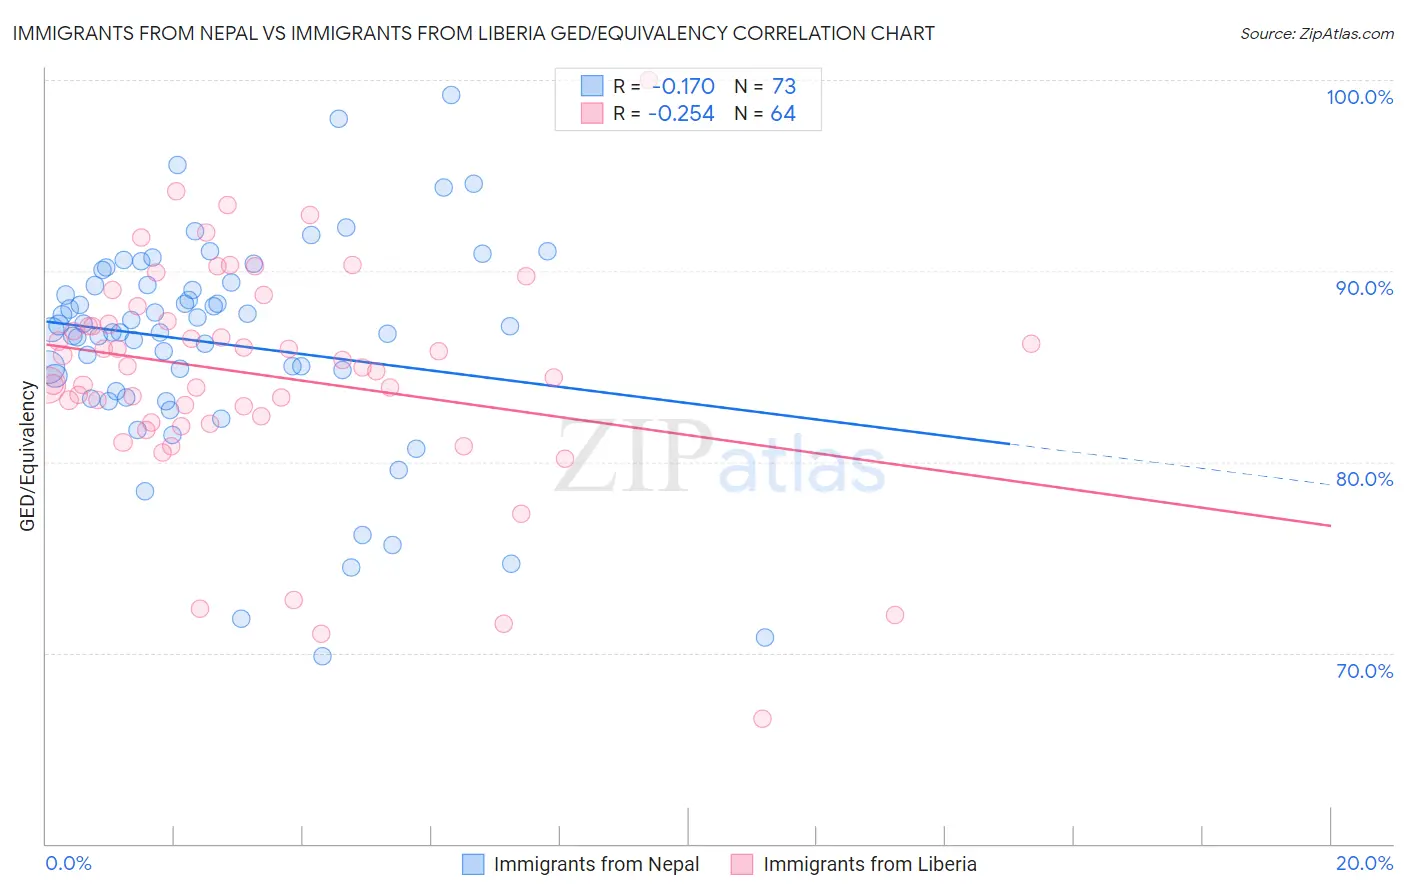
Immigrants from Nepal vs Immigrants from Liberia GED/Equivalency Correlation Chart
The statistical analysis conducted on geographies consisting of 186,780,807 people shows a poor negative correlation between the proportion of Immigrants from Nepal and percentage of population with at least ged/equivalency education in the United States with a correlation coefficient (R) of -0.170 and weighted average of 86.2%. Similarly, the statistical analysis conducted on geographies consisting of 135,293,967 people shows a weak negative correlation between the proportion of Immigrants from Liberia and percentage of population with at least ged/equivalency education in the United States with a correlation coefficient (R) of -0.254 and weighted average of 84.4%, a difference of 2.1%.
GED/Equivalency Correlation Summary
| Measurement | Immigrants from Nepal | Immigrants from Liberia |
| Minimum | 69.8% | 66.5% |
| Maximum | 99.2% | 100.0% |
| Range | 29.4% | 33.5% |
| Mean | 86.2% | 84.5% |
| Median | 86.9% | 85.0% |
| Interquartile 25% (IQ1) | 83.5% | 82.2% |
| Interquartile 75% (IQ3) | 89.3% | 87.3% |
| Interquartile Range (IQR) | 5.8% | 5.0% |
| Standard Deviation (Sample) | 5.7% | 5.9% |
| Standard Deviation (Population) | 5.7% | 5.8% |
Similar Demographics by GED/Equivalency
Demographics Similar to Immigrants from Nepal by GED/Equivalency
In terms of ged/equivalency, the demographic groups most similar to Immigrants from Nepal are White/Caucasian (86.2%, a difference of 0.030%), German Russian (86.2%, a difference of 0.030%), Immigrants from Kenya (86.2%, a difference of 0.040%), Iraqi (86.2%, a difference of 0.050%), and Armenian (86.3%, a difference of 0.080%).
| Demographics | Rating | Rank | GED/Equivalency |
| Menominee | 79.3 /100 | #149 | Good 86.3% |
| Immigrants | Western Asia | 78.8 /100 | #150 | Good 86.3% |
| Immigrants | Bosnia and Herzegovina | 77.9 /100 | #151 | Good 86.3% |
| Brazilians | 77.2 /100 | #152 | Good 86.3% |
| Kenyans | 76.6 /100 | #153 | Good 86.3% |
| Armenians | 76.4 /100 | #154 | Good 86.3% |
| Iraqis | 75.2 /100 | #155 | Good 86.2% |
| Immigrants | Nepal | 73.3 /100 | #156 | Good 86.2% |
| Whites/Caucasians | 72.2 /100 | #157 | Good 86.2% |
| German Russians | 72.1 /100 | #158 | Good 86.2% |
| Immigrants | Kenya | 71.8 /100 | #159 | Good 86.2% |
| Immigrants | Morocco | 69.5 /100 | #160 | Good 86.1% |
| Immigrants | Syria | 69.3 /100 | #161 | Good 86.1% |
| Immigrants | Iraq | 68.1 /100 | #162 | Good 86.1% |
| Ugandans | 66.3 /100 | #163 | Good 86.1% |
Demographics Similar to Immigrants from Liberia by GED/Equivalency
In terms of ged/equivalency, the demographic groups most similar to Immigrants from Liberia are Immigrants from Uruguay (84.4%, a difference of 0.030%), Immigrants from Colombia (84.4%, a difference of 0.040%), Immigrants from Costa Rica (84.5%, a difference of 0.050%), Immigrants from Zaire (84.5%, a difference of 0.070%), and Immigrants from Middle Africa (84.4%, a difference of 0.070%).
| Demographics | Rating | Rank | GED/Equivalency |
| Taiwanese | 8.1 /100 | #221 | Tragic 84.7% |
| Iroquois | 7.5 /100 | #222 | Tragic 84.6% |
| Immigrants | Uzbekistan | 7.1 /100 | #223 | Tragic 84.6% |
| French American Indians | 6.3 /100 | #224 | Tragic 84.6% |
| Immigrants | Thailand | 5.8 /100 | #225 | Tragic 84.5% |
| Immigrants | Zaire | 5.5 /100 | #226 | Tragic 84.5% |
| Immigrants | Costa Rica | 5.4 /100 | #227 | Tragic 84.5% |
| Immigrants | Liberia | 4.9 /100 | #228 | Tragic 84.4% |
| Immigrants | Uruguay | 4.6 /100 | #229 | Tragic 84.4% |
| Immigrants | Colombia | 4.5 /100 | #230 | Tragic 84.4% |
| Immigrants | Middle Africa | 4.3 /100 | #231 | Tragic 84.4% |
| Immigrants | South America | 4.2 /100 | #232 | Tragic 84.4% |
| Immigrants | Panama | 4.1 /100 | #233 | Tragic 84.4% |
| Immigrants | Nigeria | 3.6 /100 | #234 | Tragic 84.3% |
| Ghanaians | 3.5 /100 | #235 | Tragic 84.3% |