Immigrants from Nepal vs Immigrants from Somalia GED/Equivalency
COMPARE
Immigrants from Nepal
Immigrants from Somalia
GED/Equivalency
GED/Equivalency Comparison
Immigrants from Nepal
Immigrants from Somalia
86.2%
GED/EQUIVALENCY
73.3/ 100
METRIC RATING
156th/ 347
METRIC RANK
84.8%
GED/EQUIVALENCY
10.6/ 100
METRIC RATING
212th/ 347
METRIC RANK
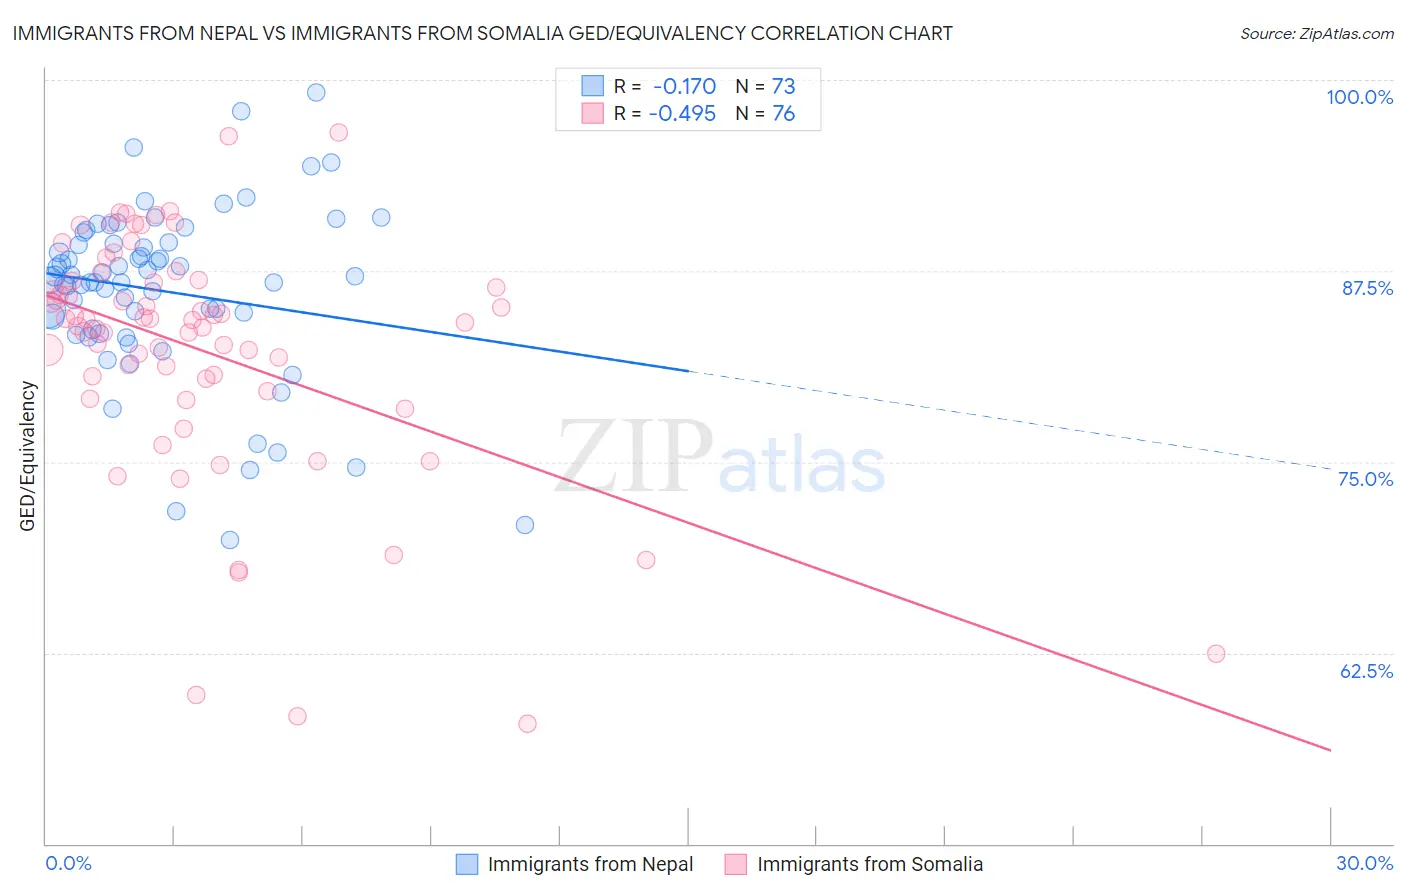
Immigrants from Nepal vs Immigrants from Somalia GED/Equivalency Correlation Chart
The statistical analysis conducted on geographies consisting of 186,780,807 people shows a poor negative correlation between the proportion of Immigrants from Nepal and percentage of population with at least ged/equivalency education in the United States with a correlation coefficient (R) of -0.170 and weighted average of 86.2%. Similarly, the statistical analysis conducted on geographies consisting of 92,111,755 people shows a moderate negative correlation between the proportion of Immigrants from Somalia and percentage of population with at least ged/equivalency education in the United States with a correlation coefficient (R) of -0.495 and weighted average of 84.8%, a difference of 1.6%.
GED/Equivalency Correlation Summary
| Measurement | Immigrants from Nepal | Immigrants from Somalia |
| Minimum | 69.8% | 57.9% |
| Maximum | 99.2% | 96.6% |
| Range | 29.4% | 38.7% |
| Mean | 86.2% | 82.3% |
| Median | 86.9% | 84.2% |
| Interquartile 25% (IQ1) | 83.5% | 80.0% |
| Interquartile 75% (IQ3) | 89.3% | 86.8% |
| Interquartile Range (IQR) | 5.8% | 6.8% |
| Standard Deviation (Sample) | 5.7% | 8.0% |
| Standard Deviation (Population) | 5.7% | 7.9% |
Similar Demographics by GED/Equivalency
Demographics Similar to Immigrants from Nepal by GED/Equivalency
In terms of ged/equivalency, the demographic groups most similar to Immigrants from Nepal are White/Caucasian (86.2%, a difference of 0.030%), German Russian (86.2%, a difference of 0.030%), Immigrants from Kenya (86.2%, a difference of 0.040%), Iraqi (86.2%, a difference of 0.050%), and Armenian (86.3%, a difference of 0.080%).
| Demographics | Rating | Rank | GED/Equivalency |
| Menominee | 79.3 /100 | #149 | Good 86.3% |
| Immigrants | Western Asia | 78.8 /100 | #150 | Good 86.3% |
| Immigrants | Bosnia and Herzegovina | 77.9 /100 | #151 | Good 86.3% |
| Brazilians | 77.2 /100 | #152 | Good 86.3% |
| Kenyans | 76.6 /100 | #153 | Good 86.3% |
| Armenians | 76.4 /100 | #154 | Good 86.3% |
| Iraqis | 75.2 /100 | #155 | Good 86.2% |
| Immigrants | Nepal | 73.3 /100 | #156 | Good 86.2% |
| Whites/Caucasians | 72.2 /100 | #157 | Good 86.2% |
| German Russians | 72.1 /100 | #158 | Good 86.2% |
| Immigrants | Kenya | 71.8 /100 | #159 | Good 86.2% |
| Immigrants | Morocco | 69.5 /100 | #160 | Good 86.1% |
| Immigrants | Syria | 69.3 /100 | #161 | Good 86.1% |
| Immigrants | Iraq | 68.1 /100 | #162 | Good 86.1% |
| Ugandans | 66.3 /100 | #163 | Good 86.1% |
Demographics Similar to Immigrants from Somalia by GED/Equivalency
In terms of ged/equivalency, the demographic groups most similar to Immigrants from Somalia are South American (84.8%, a difference of 0.020%), Immigrants from Philippines (84.8%, a difference of 0.030%), Osage (84.8%, a difference of 0.060%), Immigrants from Cameroon (84.9%, a difference of 0.080%), and Peruvian (84.7%, a difference of 0.080%).
| Demographics | Rating | Rank | GED/Equivalency |
| Liberians | 14.6 /100 | #205 | Poor 85.0% |
| Samoans | 13.7 /100 | #206 | Poor 84.9% |
| Hmong | 13.1 /100 | #207 | Poor 84.9% |
| Marshallese | 12.5 /100 | #208 | Poor 84.9% |
| Colombians | 12.3 /100 | #209 | Poor 84.9% |
| Immigrants | Cameroon | 12.1 /100 | #210 | Poor 84.9% |
| South Americans | 10.9 /100 | #211 | Poor 84.8% |
| Immigrants | Somalia | 10.6 /100 | #212 | Poor 84.8% |
| Immigrants | Philippines | 10.0 /100 | #213 | Poor 84.8% |
| Osage | 9.5 /100 | #214 | Tragic 84.8% |
| Peruvians | 9.2 /100 | #215 | Tragic 84.7% |
| Immigrants | Micronesia | 8.7 /100 | #216 | Tragic 84.7% |
| Nigerians | 8.6 /100 | #217 | Tragic 84.7% |
| Alaska Natives | 8.6 /100 | #218 | Tragic 84.7% |
| Potawatomi | 8.2 /100 | #219 | Tragic 84.7% |