Immigrants from Nepal vs Immigrants from Hungary GED/Equivalency
COMPARE
Immigrants from Nepal
Immigrants from Hungary
GED/Equivalency
GED/Equivalency Comparison
Immigrants from Nepal
Immigrants from Hungary
86.2%
GED/EQUIVALENCY
73.3/ 100
METRIC RATING
156th/ 347
METRIC RANK
87.2%
GED/EQUIVALENCY
96.0/ 100
METRIC RATING
104th/ 347
METRIC RANK
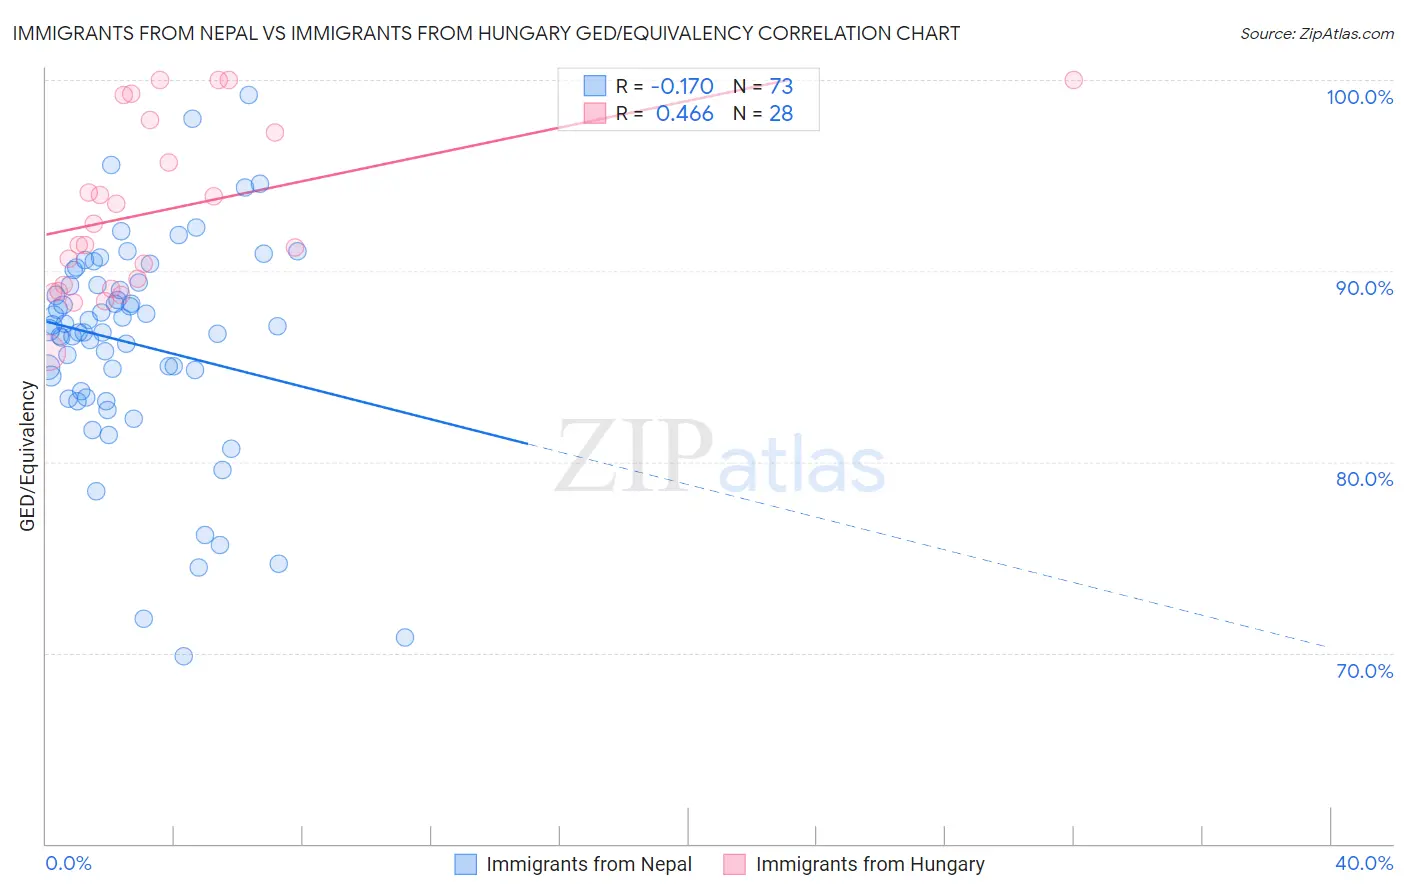
Immigrants from Nepal vs Immigrants from Hungary GED/Equivalency Correlation Chart
The statistical analysis conducted on geographies consisting of 186,780,807 people shows a poor negative correlation between the proportion of Immigrants from Nepal and percentage of population with at least ged/equivalency education in the United States with a correlation coefficient (R) of -0.170 and weighted average of 86.2%. Similarly, the statistical analysis conducted on geographies consisting of 195,707,305 people shows a moderate positive correlation between the proportion of Immigrants from Hungary and percentage of population with at least ged/equivalency education in the United States with a correlation coefficient (R) of 0.466 and weighted average of 87.2%, a difference of 1.1%.
GED/Equivalency Correlation Summary
| Measurement | Immigrants from Nepal | Immigrants from Hungary |
| Minimum | 69.8% | 85.7% |
| Maximum | 99.2% | 100.0% |
| Range | 29.4% | 14.3% |
| Mean | 86.2% | 93.2% |
| Median | 86.9% | 91.9% |
| Interquartile 25% (IQ1) | 83.5% | 89.2% |
| Interquartile 75% (IQ3) | 89.3% | 97.6% |
| Interquartile Range (IQR) | 5.8% | 8.4% |
| Standard Deviation (Sample) | 5.7% | 4.4% |
| Standard Deviation (Population) | 5.7% | 4.4% |
Similar Demographics by GED/Equivalency
Demographics Similar to Immigrants from Nepal by GED/Equivalency
In terms of ged/equivalency, the demographic groups most similar to Immigrants from Nepal are White/Caucasian (86.2%, a difference of 0.030%), German Russian (86.2%, a difference of 0.030%), Immigrants from Kenya (86.2%, a difference of 0.040%), Iraqi (86.2%, a difference of 0.050%), and Armenian (86.3%, a difference of 0.080%).
| Demographics | Rating | Rank | GED/Equivalency |
| Menominee | 79.3 /100 | #149 | Good 86.3% |
| Immigrants | Western Asia | 78.8 /100 | #150 | Good 86.3% |
| Immigrants | Bosnia and Herzegovina | 77.9 /100 | #151 | Good 86.3% |
| Brazilians | 77.2 /100 | #152 | Good 86.3% |
| Kenyans | 76.6 /100 | #153 | Good 86.3% |
| Armenians | 76.4 /100 | #154 | Good 86.3% |
| Iraqis | 75.2 /100 | #155 | Good 86.2% |
| Immigrants | Nepal | 73.3 /100 | #156 | Good 86.2% |
| Whites/Caucasians | 72.2 /100 | #157 | Good 86.2% |
| German Russians | 72.1 /100 | #158 | Good 86.2% |
| Immigrants | Kenya | 71.8 /100 | #159 | Good 86.2% |
| Immigrants | Morocco | 69.5 /100 | #160 | Good 86.1% |
| Immigrants | Syria | 69.3 /100 | #161 | Good 86.1% |
| Immigrants | Iraq | 68.1 /100 | #162 | Good 86.1% |
| Ugandans | 66.3 /100 | #163 | Good 86.1% |
Demographics Similar to Immigrants from Hungary by GED/Equivalency
In terms of ged/equivalency, the demographic groups most similar to Immigrants from Hungary are Jordanian (87.2%, a difference of 0.010%), Indian (Asian) (87.1%, a difference of 0.010%), Lebanese (87.2%, a difference of 0.020%), Immigrants from Zimbabwe (87.1%, a difference of 0.030%), and Icelander (87.1%, a difference of 0.030%).
| Demographics | Rating | Rank | GED/Equivalency |
| Immigrants | Western Europe | 97.3 /100 | #97 | Exceptional 87.3% |
| Immigrants | Croatia | 96.9 /100 | #98 | Exceptional 87.3% |
| Immigrants | Belarus | 96.9 /100 | #99 | Exceptional 87.3% |
| Palestinians | 96.8 /100 | #100 | Exceptional 87.3% |
| Syrians | 96.6 /100 | #101 | Exceptional 87.2% |
| Lebanese | 96.2 /100 | #102 | Exceptional 87.2% |
| Jordanians | 96.1 /100 | #103 | Exceptional 87.2% |
| Immigrants | Hungary | 96.0 /100 | #104 | Exceptional 87.2% |
| Indians (Asian) | 95.9 /100 | #105 | Exceptional 87.1% |
| Immigrants | Zimbabwe | 95.8 /100 | #106 | Exceptional 87.1% |
| Icelanders | 95.7 /100 | #107 | Exceptional 87.1% |
| Canadians | 95.6 /100 | #108 | Exceptional 87.1% |
| Immigrants | Eastern Europe | 95.5 /100 | #109 | Exceptional 87.1% |
| Egyptians | 95.3 /100 | #110 | Exceptional 87.1% |
| French | 95.2 /100 | #111 | Exceptional 87.1% |