Immigrants from Nepal vs Indonesian GED/Equivalency
COMPARE
Immigrants from Nepal
Indonesian
GED/Equivalency
GED/Equivalency Comparison
Immigrants from Nepal
Indonesians
86.2%
GED/EQUIVALENCY
73.3/ 100
METRIC RATING
156th/ 347
METRIC RANK
82.5%
GED/EQUIVALENCY
0.1/ 100
METRIC RATING
283rd/ 347
METRIC RANK
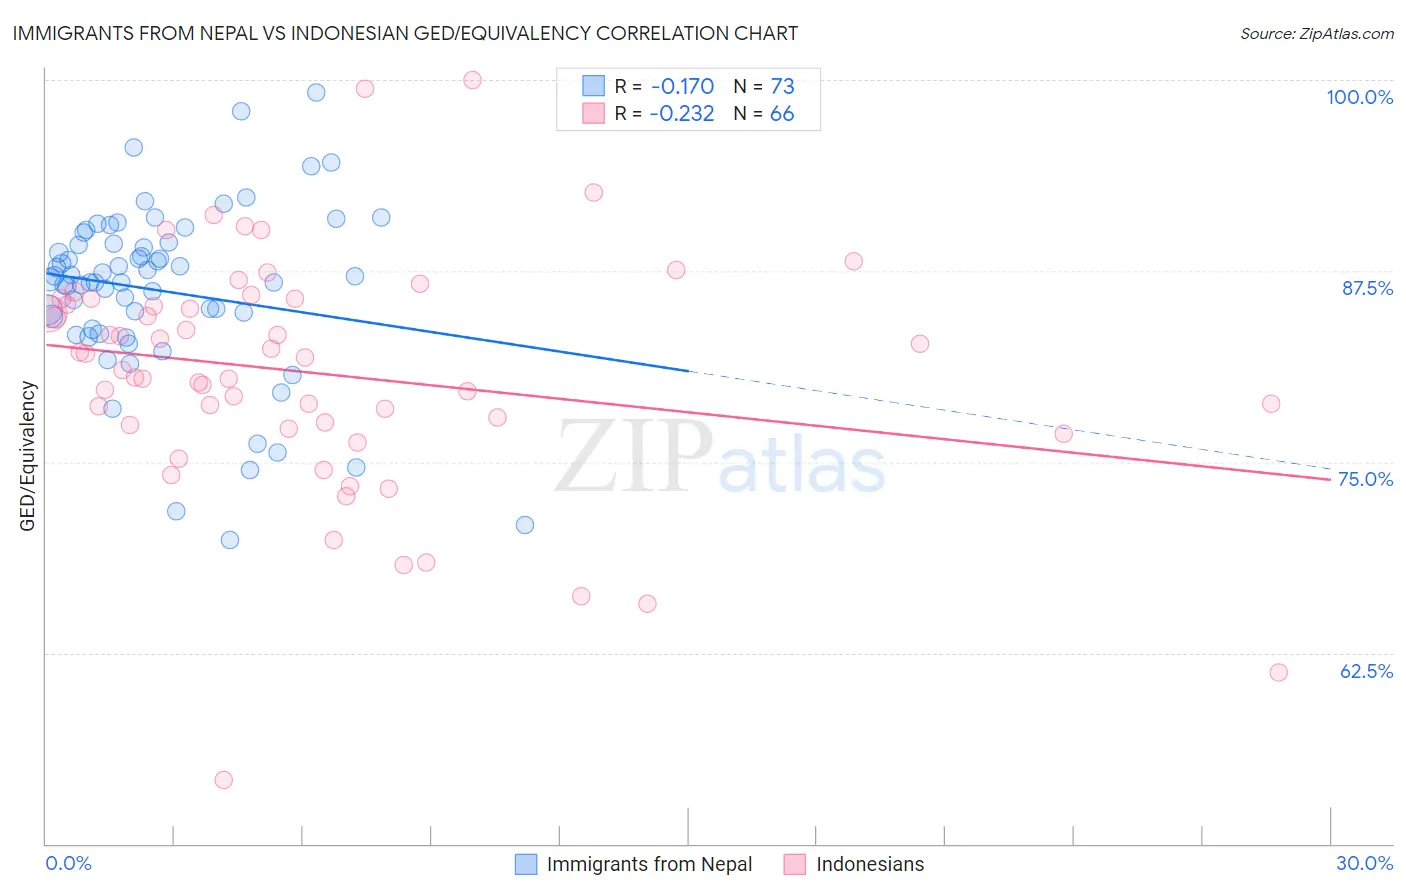
Immigrants from Nepal vs Indonesian GED/Equivalency Correlation Chart
The statistical analysis conducted on geographies consisting of 186,780,807 people shows a poor negative correlation between the proportion of Immigrants from Nepal and percentage of population with at least ged/equivalency education in the United States with a correlation coefficient (R) of -0.170 and weighted average of 86.2%. Similarly, the statistical analysis conducted on geographies consisting of 162,727,113 people shows a weak negative correlation between the proportion of Indonesians and percentage of population with at least ged/equivalency education in the United States with a correlation coefficient (R) of -0.232 and weighted average of 82.5%, a difference of 4.4%.
GED/Equivalency Correlation Summary
| Measurement | Immigrants from Nepal | Indonesian |
| Minimum | 69.8% | 54.2% |
| Maximum | 99.2% | 100.0% |
| Range | 29.4% | 45.8% |
| Mean | 86.2% | 80.8% |
| Median | 86.9% | 81.4% |
| Interquartile 25% (IQ1) | 83.5% | 77.4% |
| Interquartile 75% (IQ3) | 89.3% | 85.7% |
| Interquartile Range (IQR) | 5.8% | 8.2% |
| Standard Deviation (Sample) | 5.7% | 7.9% |
| Standard Deviation (Population) | 5.7% | 7.9% |
Similar Demographics by GED/Equivalency
Demographics Similar to Immigrants from Nepal by GED/Equivalency
In terms of ged/equivalency, the demographic groups most similar to Immigrants from Nepal are White/Caucasian (86.2%, a difference of 0.030%), German Russian (86.2%, a difference of 0.030%), Immigrants from Kenya (86.2%, a difference of 0.040%), Iraqi (86.2%, a difference of 0.050%), and Armenian (86.3%, a difference of 0.080%).
| Demographics | Rating | Rank | GED/Equivalency |
| Menominee | 79.3 /100 | #149 | Good 86.3% |
| Immigrants | Western Asia | 78.8 /100 | #150 | Good 86.3% |
| Immigrants | Bosnia and Herzegovina | 77.9 /100 | #151 | Good 86.3% |
| Brazilians | 77.2 /100 | #152 | Good 86.3% |
| Kenyans | 76.6 /100 | #153 | Good 86.3% |
| Armenians | 76.4 /100 | #154 | Good 86.3% |
| Iraqis | 75.2 /100 | #155 | Good 86.2% |
| Immigrants | Nepal | 73.3 /100 | #156 | Good 86.2% |
| Whites/Caucasians | 72.2 /100 | #157 | Good 86.2% |
| German Russians | 72.1 /100 | #158 | Good 86.2% |
| Immigrants | Kenya | 71.8 /100 | #159 | Good 86.2% |
| Immigrants | Morocco | 69.5 /100 | #160 | Good 86.1% |
| Immigrants | Syria | 69.3 /100 | #161 | Good 86.1% |
| Immigrants | Iraq | 68.1 /100 | #162 | Good 86.1% |
| Ugandans | 66.3 /100 | #163 | Good 86.1% |
Demographics Similar to Indonesians by GED/Equivalency
In terms of ged/equivalency, the demographic groups most similar to Indonesians are Immigrants (82.6%, a difference of 0.050%), Immigrants from Barbados (82.4%, a difference of 0.12%), Sioux (82.6%, a difference of 0.14%), Cajun (82.4%, a difference of 0.15%), and Immigrants from West Indies (82.4%, a difference of 0.18%).
| Demographics | Rating | Rank | GED/Equivalency |
| Blacks/African Americans | 0.1 /100 | #276 | Tragic 82.8% |
| Arapaho | 0.1 /100 | #277 | Tragic 82.8% |
| Immigrants | Laos | 0.1 /100 | #278 | Tragic 82.7% |
| Immigrants | Fiji | 0.1 /100 | #279 | Tragic 82.7% |
| Cheyenne | 0.1 /100 | #280 | Tragic 82.7% |
| Sioux | 0.1 /100 | #281 | Tragic 82.6% |
| Immigrants | Immigrants | 0.1 /100 | #282 | Tragic 82.6% |
| Indonesians | 0.1 /100 | #283 | Tragic 82.5% |
| Immigrants | Barbados | 0.1 /100 | #284 | Tragic 82.4% |
| Cajuns | 0.0 /100 | #285 | Tragic 82.4% |
| Immigrants | West Indies | 0.0 /100 | #286 | Tragic 82.4% |
| Japanese | 0.0 /100 | #287 | Tragic 82.4% |
| Pueblo | 0.0 /100 | #288 | Tragic 82.3% |
| Immigrants | Cambodia | 0.0 /100 | #289 | Tragic 82.2% |
| Haitians | 0.0 /100 | #290 | Tragic 82.1% |