Immigrants from Morocco vs Immigrants from Ukraine GED/Equivalency
COMPARE
Immigrants from Morocco
Immigrants from Ukraine
GED/Equivalency
GED/Equivalency Comparison
Immigrants from Morocco
Immigrants from Ukraine
86.1%
GED/EQUIVALENCY
69.5/ 100
METRIC RATING
160th/ 347
METRIC RANK
86.7%
GED/EQUIVALENCY
88.9/ 100
METRIC RATING
129th/ 347
METRIC RANK
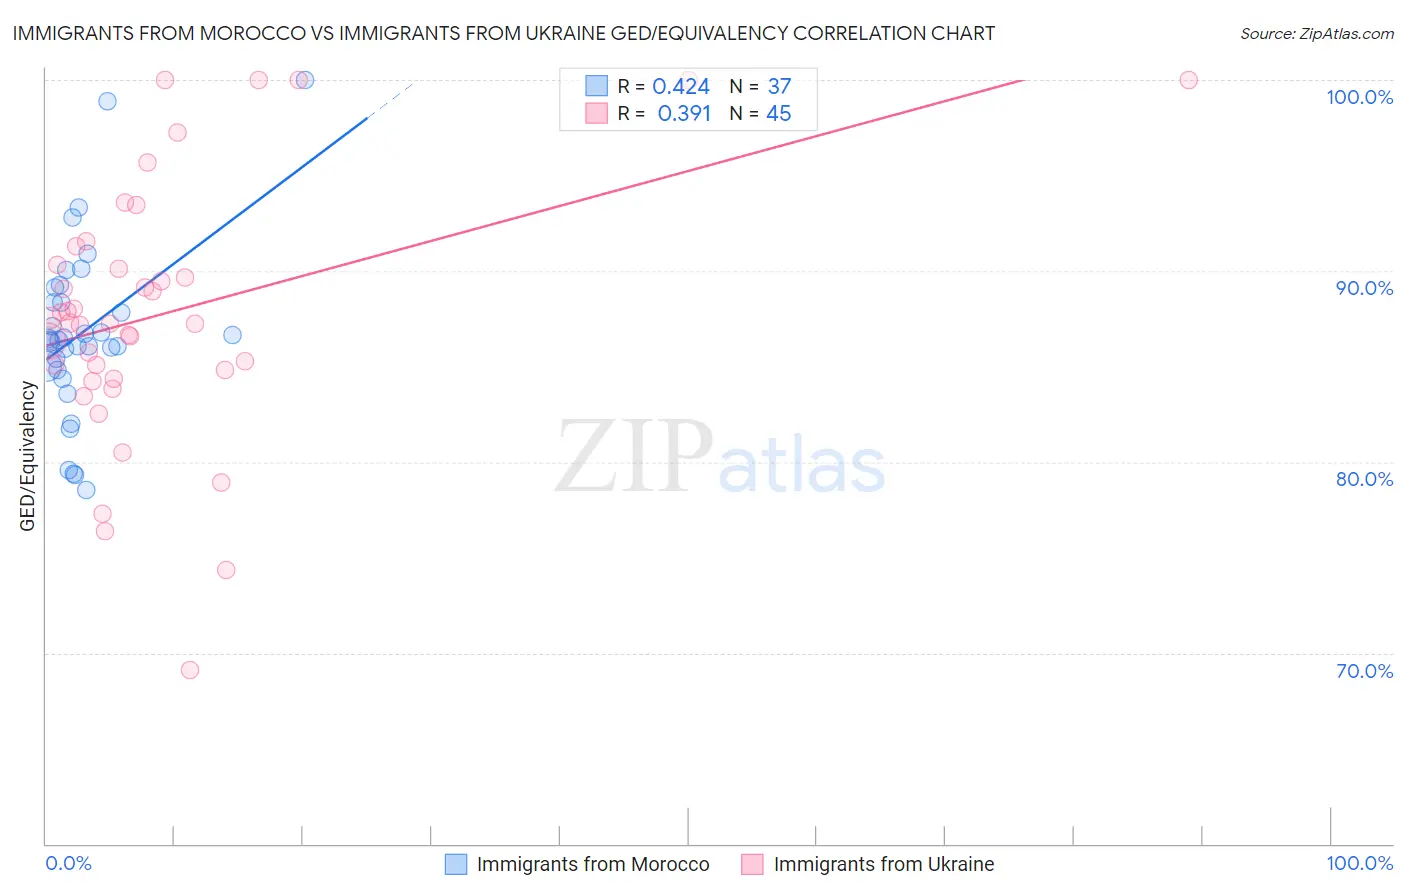
Immigrants from Morocco vs Immigrants from Ukraine GED/Equivalency Correlation Chart
The statistical analysis conducted on geographies consisting of 178,912,438 people shows a moderate positive correlation between the proportion of Immigrants from Morocco and percentage of population with at least ged/equivalency education in the United States with a correlation coefficient (R) of 0.424 and weighted average of 86.1%. Similarly, the statistical analysis conducted on geographies consisting of 289,714,613 people shows a mild positive correlation between the proportion of Immigrants from Ukraine and percentage of population with at least ged/equivalency education in the United States with a correlation coefficient (R) of 0.391 and weighted average of 86.7%, a difference of 0.64%.
GED/Equivalency Correlation Summary
| Measurement | Immigrants from Morocco | Immigrants from Ukraine |
| Minimum | 78.5% | 69.1% |
| Maximum | 100.0% | 100.0% |
| Range | 21.5% | 30.9% |
| Mean | 86.8% | 87.8% |
| Median | 86.4% | 87.3% |
| Interquartile 25% (IQ1) | 84.9% | 84.6% |
| Interquartile 75% (IQ3) | 88.7% | 90.8% |
| Interquartile Range (IQR) | 3.8% | 6.2% |
| Standard Deviation (Sample) | 4.6% | 6.8% |
| Standard Deviation (Population) | 4.6% | 6.7% |
Similar Demographics by GED/Equivalency
Demographics Similar to Immigrants from Morocco by GED/Equivalency
In terms of ged/equivalency, the demographic groups most similar to Immigrants from Morocco are Immigrants from Syria (86.1%, a difference of 0.010%), Immigrants from Iraq (86.1%, a difference of 0.030%), German Russian (86.2%, a difference of 0.060%), Immigrants from Kenya (86.2%, a difference of 0.060%), and White/Caucasian (86.2%, a difference of 0.070%).
| Demographics | Rating | Rank | GED/Equivalency |
| Kenyans | 76.6 /100 | #153 | Good 86.3% |
| Armenians | 76.4 /100 | #154 | Good 86.3% |
| Iraqis | 75.2 /100 | #155 | Good 86.2% |
| Immigrants | Nepal | 73.3 /100 | #156 | Good 86.2% |
| Whites/Caucasians | 72.2 /100 | #157 | Good 86.2% |
| German Russians | 72.1 /100 | #158 | Good 86.2% |
| Immigrants | Kenya | 71.8 /100 | #159 | Good 86.2% |
| Immigrants | Morocco | 69.5 /100 | #160 | Good 86.1% |
| Immigrants | Syria | 69.3 /100 | #161 | Good 86.1% |
| Immigrants | Iraq | 68.1 /100 | #162 | Good 86.1% |
| Ugandans | 66.3 /100 | #163 | Good 86.1% |
| Venezuelans | 65.5 /100 | #164 | Good 86.0% |
| Alsatians | 64.3 /100 | #165 | Good 86.0% |
| Immigrants | Albania | 64.2 /100 | #166 | Good 86.0% |
| Ethiopians | 63.7 /100 | #167 | Good 86.0% |
Demographics Similar to Immigrants from Ukraine by GED/Equivalency
In terms of ged/equivalency, the demographic groups most similar to Immigrants from Ukraine are Immigrants from Germany (86.7%, a difference of 0.0%), Immigrants from Spain (86.7%, a difference of 0.020%), Yugoslavian (86.7%, a difference of 0.030%), Immigrants from Brazil (86.6%, a difference of 0.030%), and Tsimshian (86.6%, a difference of 0.030%).
| Demographics | Rating | Rank | GED/Equivalency |
| Immigrants | Jordan | 90.8 /100 | #122 | Exceptional 86.8% |
| Immigrants | Italy | 90.5 /100 | #123 | Exceptional 86.7% |
| Immigrants | Egypt | 90.4 /100 | #124 | Exceptional 86.7% |
| Celtics | 90.4 /100 | #125 | Exceptional 86.7% |
| Asians | 90.3 /100 | #126 | Exceptional 86.7% |
| Argentineans | 89.7 /100 | #127 | Excellent 86.7% |
| Yugoslavians | 89.5 /100 | #128 | Excellent 86.7% |
| Immigrants | Ukraine | 88.9 /100 | #129 | Excellent 86.7% |
| Immigrants | Germany | 88.8 /100 | #130 | Excellent 86.7% |
| Immigrants | Spain | 88.5 /100 | #131 | Excellent 86.7% |
| Immigrants | Brazil | 88.4 /100 | #132 | Excellent 86.6% |
| Tsimshian | 88.3 /100 | #133 | Excellent 86.6% |
| Albanians | 87.7 /100 | #134 | Excellent 86.6% |
| Immigrants | Asia | 87.4 /100 | #135 | Excellent 86.6% |
| Chileans | 86.9 /100 | #136 | Excellent 86.6% |