Immigrants from Morocco vs South American Indian GED/Equivalency
COMPARE
Immigrants from Morocco
South American Indian
GED/Equivalency
GED/Equivalency Comparison
Immigrants from Morocco
South American Indians
86.1%
GED/EQUIVALENCY
69.5/ 100
METRIC RATING
160th/ 347
METRIC RANK
85.2%
GED/EQUIVALENCY
22.8/ 100
METRIC RATING
191st/ 347
METRIC RANK
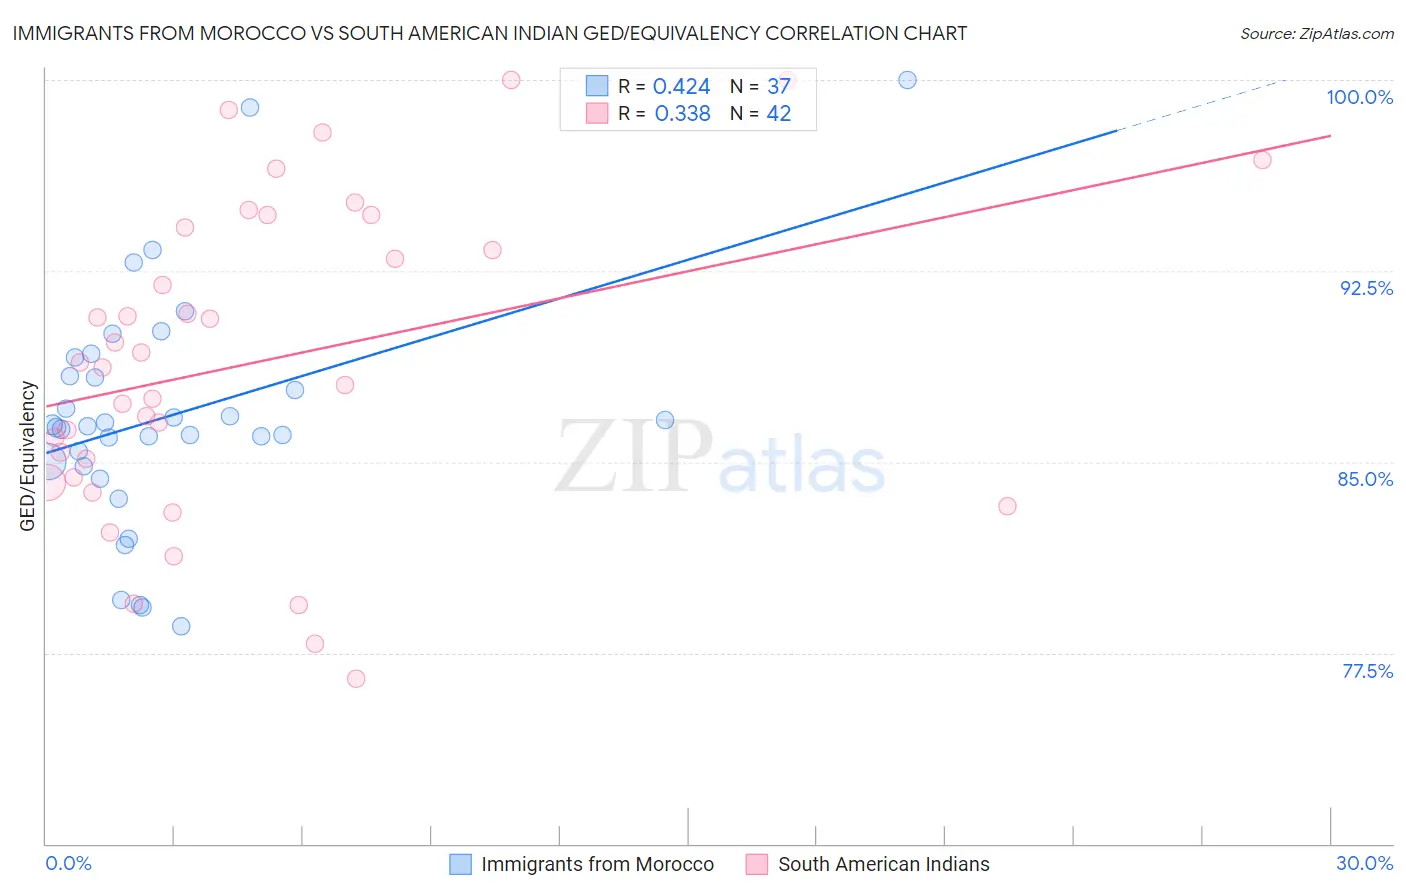
Immigrants from Morocco vs South American Indian GED/Equivalency Correlation Chart
The statistical analysis conducted on geographies consisting of 178,912,438 people shows a moderate positive correlation between the proportion of Immigrants from Morocco and percentage of population with at least ged/equivalency education in the United States with a correlation coefficient (R) of 0.424 and weighted average of 86.1%. Similarly, the statistical analysis conducted on geographies consisting of 164,573,088 people shows a mild positive correlation between the proportion of South American Indians and percentage of population with at least ged/equivalency education in the United States with a correlation coefficient (R) of 0.338 and weighted average of 85.2%, a difference of 1.1%.
GED/Equivalency Correlation Summary
| Measurement | Immigrants from Morocco | South American Indian |
| Minimum | 78.5% | 76.5% |
| Maximum | 100.0% | 100.0% |
| Range | 21.5% | 23.5% |
| Mean | 86.8% | 88.9% |
| Median | 86.4% | 88.8% |
| Interquartile 25% (IQ1) | 84.9% | 84.4% |
| Interquartile 75% (IQ3) | 88.7% | 94.2% |
| Interquartile Range (IQR) | 3.8% | 9.8% |
| Standard Deviation (Sample) | 4.6% | 6.1% |
| Standard Deviation (Population) | 4.6% | 6.0% |
Similar Demographics by GED/Equivalency
Demographics Similar to Immigrants from Morocco by GED/Equivalency
In terms of ged/equivalency, the demographic groups most similar to Immigrants from Morocco are Immigrants from Syria (86.1%, a difference of 0.010%), Immigrants from Iraq (86.1%, a difference of 0.030%), German Russian (86.2%, a difference of 0.060%), Immigrants from Kenya (86.2%, a difference of 0.060%), and White/Caucasian (86.2%, a difference of 0.070%).
| Demographics | Rating | Rank | GED/Equivalency |
| Kenyans | 76.6 /100 | #153 | Good 86.3% |
| Armenians | 76.4 /100 | #154 | Good 86.3% |
| Iraqis | 75.2 /100 | #155 | Good 86.2% |
| Immigrants | Nepal | 73.3 /100 | #156 | Good 86.2% |
| Whites/Caucasians | 72.2 /100 | #157 | Good 86.2% |
| German Russians | 72.1 /100 | #158 | Good 86.2% |
| Immigrants | Kenya | 71.8 /100 | #159 | Good 86.2% |
| Immigrants | Morocco | 69.5 /100 | #160 | Good 86.1% |
| Immigrants | Syria | 69.3 /100 | #161 | Good 86.1% |
| Immigrants | Iraq | 68.1 /100 | #162 | Good 86.1% |
| Ugandans | 66.3 /100 | #163 | Good 86.1% |
| Venezuelans | 65.5 /100 | #164 | Good 86.0% |
| Alsatians | 64.3 /100 | #165 | Good 86.0% |
| Immigrants | Albania | 64.2 /100 | #166 | Good 86.0% |
| Ethiopians | 63.7 /100 | #167 | Good 86.0% |
Demographics Similar to South American Indians by GED/Equivalency
In terms of ged/equivalency, the demographic groups most similar to South American Indians are Nonimmigrants (85.2%, a difference of 0.0%), Delaware (85.2%, a difference of 0.020%), Puget Sound Salish (85.2%, a difference of 0.060%), Chippewa (85.2%, a difference of 0.060%), and Tongan (85.2%, a difference of 0.060%).
| Demographics | Rating | Rank | GED/Equivalency |
| Immigrants | Oceania | 33.6 /100 | #184 | Fair 85.5% |
| Spanish | 32.8 /100 | #185 | Fair 85.4% |
| Spaniards | 31.9 /100 | #186 | Fair 85.4% |
| Immigrants | Afghanistan | 29.8 /100 | #187 | Fair 85.4% |
| Immigrants | Sierra Leone | 29.0 /100 | #188 | Fair 85.4% |
| Guamanians/Chamorros | 28.4 /100 | #189 | Fair 85.3% |
| Alaskan Athabascans | 27.5 /100 | #190 | Fair 85.3% |
| South American Indians | 22.8 /100 | #191 | Fair 85.2% |
| Immigrants | Nonimmigrants | 22.7 /100 | #192 | Fair 85.2% |
| Delaware | 22.2 /100 | #193 | Fair 85.2% |
| Puget Sound Salish | 20.8 /100 | #194 | Fair 85.2% |
| Chippewa | 20.8 /100 | #195 | Fair 85.2% |
| Tongans | 20.7 /100 | #196 | Fair 85.2% |
| Costa Ricans | 20.4 /100 | #197 | Fair 85.2% |
| Immigrants | Africa | 17.5 /100 | #198 | Poor 85.1% |