Immigrants from Morocco vs Immigrants from Laos GED/Equivalency
COMPARE
Immigrants from Morocco
Immigrants from Laos
GED/Equivalency
GED/Equivalency Comparison
Immigrants from Morocco
Immigrants from Laos
86.1%
GED/EQUIVALENCY
69.5/ 100
METRIC RATING
160th/ 347
METRIC RANK
82.7%
GED/EQUIVALENCY
0.1/ 100
METRIC RATING
278th/ 347
METRIC RANK
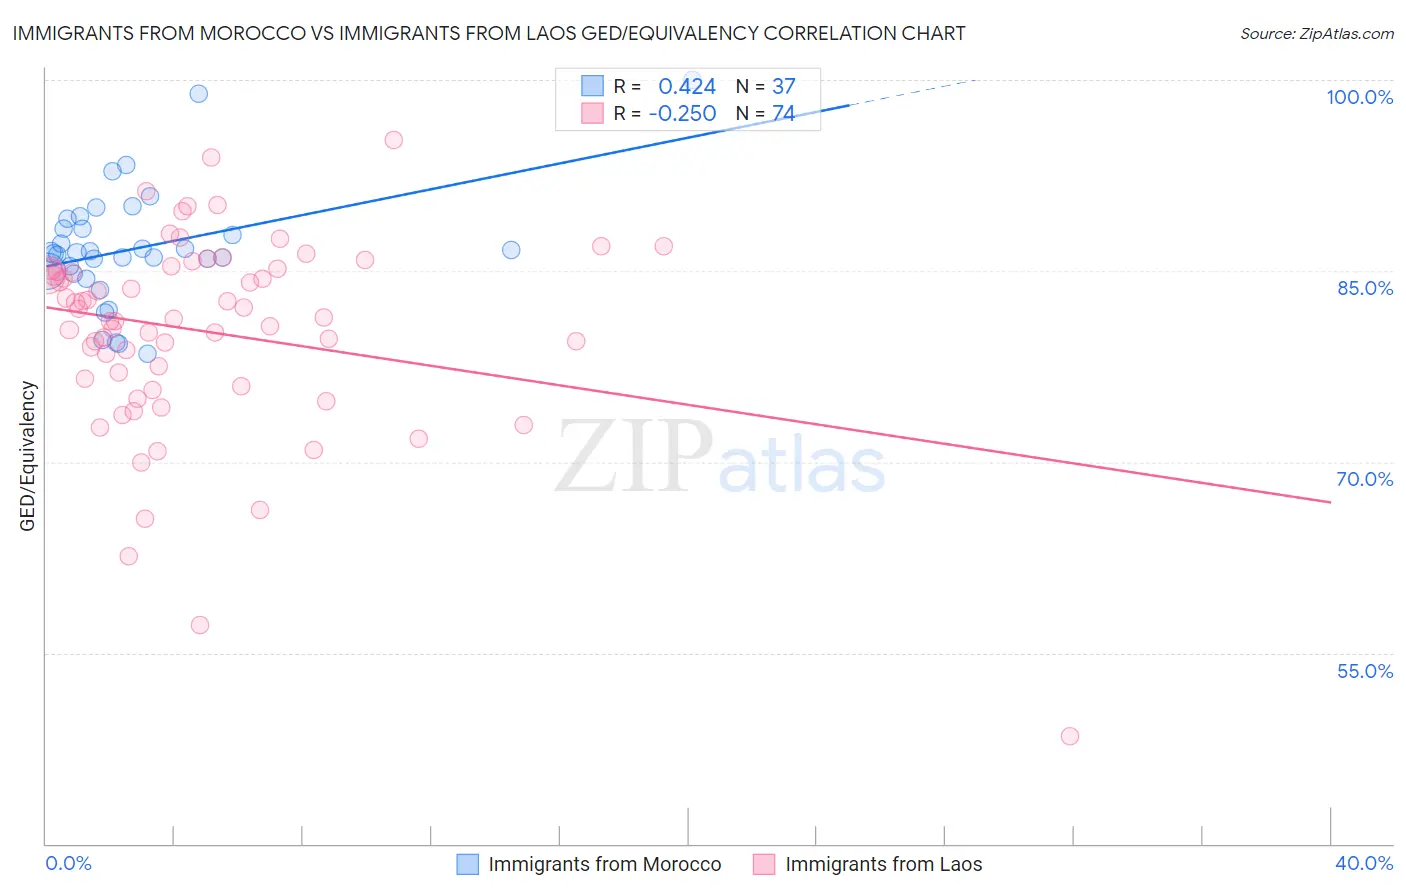
Immigrants from Morocco vs Immigrants from Laos GED/Equivalency Correlation Chart
The statistical analysis conducted on geographies consisting of 178,912,438 people shows a moderate positive correlation between the proportion of Immigrants from Morocco and percentage of population with at least ged/equivalency education in the United States with a correlation coefficient (R) of 0.424 and weighted average of 86.1%. Similarly, the statistical analysis conducted on geographies consisting of 201,472,886 people shows a weak negative correlation between the proportion of Immigrants from Laos and percentage of population with at least ged/equivalency education in the United States with a correlation coefficient (R) of -0.250 and weighted average of 82.7%, a difference of 4.1%.
GED/Equivalency Correlation Summary
| Measurement | Immigrants from Morocco | Immigrants from Laos |
| Minimum | 78.5% | 48.4% |
| Maximum | 100.0% | 95.3% |
| Range | 21.5% | 46.9% |
| Mean | 86.8% | 80.2% |
| Median | 86.4% | 81.3% |
| Interquartile 25% (IQ1) | 84.9% | 76.5% |
| Interquartile 75% (IQ3) | 88.7% | 85.2% |
| Interquartile Range (IQR) | 3.8% | 8.6% |
| Standard Deviation (Sample) | 4.6% | 7.9% |
| Standard Deviation (Population) | 4.6% | 7.8% |
Similar Demographics by GED/Equivalency
Demographics Similar to Immigrants from Morocco by GED/Equivalency
In terms of ged/equivalency, the demographic groups most similar to Immigrants from Morocco are Immigrants from Syria (86.1%, a difference of 0.010%), Immigrants from Iraq (86.1%, a difference of 0.030%), German Russian (86.2%, a difference of 0.060%), Immigrants from Kenya (86.2%, a difference of 0.060%), and White/Caucasian (86.2%, a difference of 0.070%).
| Demographics | Rating | Rank | GED/Equivalency |
| Kenyans | 76.6 /100 | #153 | Good 86.3% |
| Armenians | 76.4 /100 | #154 | Good 86.3% |
| Iraqis | 75.2 /100 | #155 | Good 86.2% |
| Immigrants | Nepal | 73.3 /100 | #156 | Good 86.2% |
| Whites/Caucasians | 72.2 /100 | #157 | Good 86.2% |
| German Russians | 72.1 /100 | #158 | Good 86.2% |
| Immigrants | Kenya | 71.8 /100 | #159 | Good 86.2% |
| Immigrants | Morocco | 69.5 /100 | #160 | Good 86.1% |
| Immigrants | Syria | 69.3 /100 | #161 | Good 86.1% |
| Immigrants | Iraq | 68.1 /100 | #162 | Good 86.1% |
| Ugandans | 66.3 /100 | #163 | Good 86.1% |
| Venezuelans | 65.5 /100 | #164 | Good 86.0% |
| Alsatians | 64.3 /100 | #165 | Good 86.0% |
| Immigrants | Albania | 64.2 /100 | #166 | Good 86.0% |
| Ethiopians | 63.7 /100 | #167 | Good 86.0% |
Demographics Similar to Immigrants from Laos by GED/Equivalency
In terms of ged/equivalency, the demographic groups most similar to Immigrants from Laos are Immigrants from Fiji (82.7%, a difference of 0.010%), Cheyenne (82.7%, a difference of 0.010%), Arapaho (82.8%, a difference of 0.030%), Black/African American (82.8%, a difference of 0.050%), and Seminole (82.8%, a difference of 0.070%).
| Demographics | Rating | Rank | GED/Equivalency |
| U.S. Virgin Islanders | 0.2 /100 | #271 | Tragic 82.9% |
| Barbadians | 0.1 /100 | #272 | Tragic 82.9% |
| Pennsylvania Germans | 0.1 /100 | #273 | Tragic 82.9% |
| Immigrants | Trinidad and Tobago | 0.1 /100 | #274 | Tragic 82.8% |
| Seminole | 0.1 /100 | #275 | Tragic 82.8% |
| Blacks/African Americans | 0.1 /100 | #276 | Tragic 82.8% |
| Arapaho | 0.1 /100 | #277 | Tragic 82.8% |
| Immigrants | Laos | 0.1 /100 | #278 | Tragic 82.7% |
| Immigrants | Fiji | 0.1 /100 | #279 | Tragic 82.7% |
| Cheyenne | 0.1 /100 | #280 | Tragic 82.7% |
| Sioux | 0.1 /100 | #281 | Tragic 82.6% |
| Immigrants | Immigrants | 0.1 /100 | #282 | Tragic 82.6% |
| Indonesians | 0.1 /100 | #283 | Tragic 82.5% |
| Immigrants | Barbados | 0.1 /100 | #284 | Tragic 82.4% |
| Cajuns | 0.0 /100 | #285 | Tragic 82.4% |