Croatian vs Immigrants from Ukraine GED/Equivalency
COMPARE
Croatian
Immigrants from Ukraine
GED/Equivalency
GED/Equivalency Comparison
Croatians
Immigrants from Ukraine
88.8%
GED/EQUIVALENCY
99.9/ 100
METRIC RATING
17th/ 347
METRIC RANK
86.7%
GED/EQUIVALENCY
88.9/ 100
METRIC RATING
129th/ 347
METRIC RANK
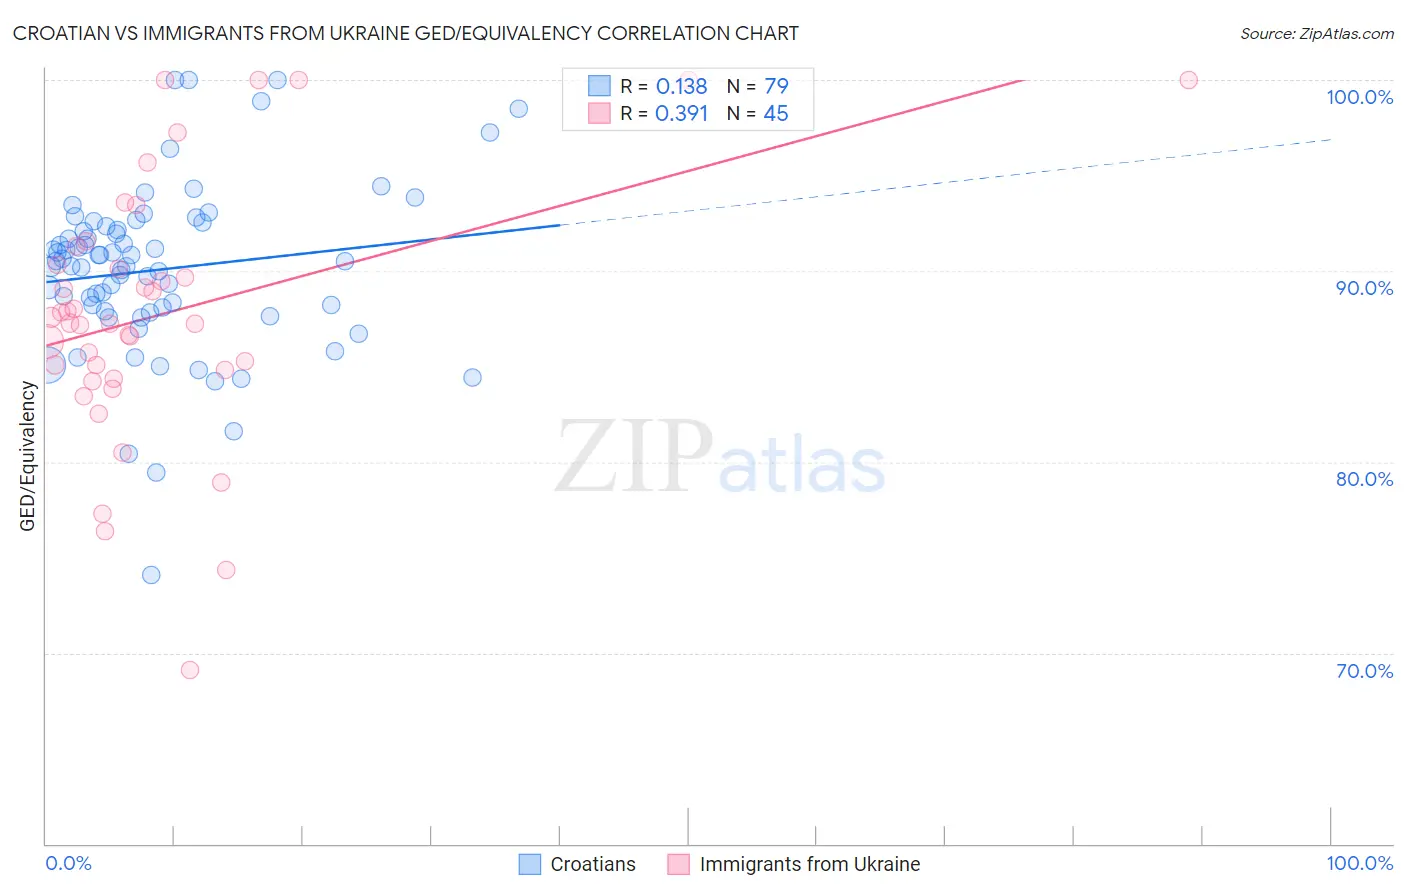
Croatian vs Immigrants from Ukraine GED/Equivalency Correlation Chart
The statistical analysis conducted on geographies consisting of 375,732,690 people shows a poor positive correlation between the proportion of Croatians and percentage of population with at least ged/equivalency education in the United States with a correlation coefficient (R) of 0.138 and weighted average of 88.8%. Similarly, the statistical analysis conducted on geographies consisting of 289,714,613 people shows a mild positive correlation between the proportion of Immigrants from Ukraine and percentage of population with at least ged/equivalency education in the United States with a correlation coefficient (R) of 0.391 and weighted average of 86.7%, a difference of 2.5%.
GED/Equivalency Correlation Summary
| Measurement | Croatian | Immigrants from Ukraine |
| Minimum | 74.1% | 69.1% |
| Maximum | 100.0% | 100.0% |
| Range | 25.9% | 30.9% |
| Mean | 90.1% | 87.8% |
| Median | 90.5% | 87.3% |
| Interquartile 25% (IQ1) | 87.9% | 84.6% |
| Interquartile 75% (IQ3) | 92.3% | 90.8% |
| Interquartile Range (IQR) | 4.4% | 6.2% |
| Standard Deviation (Sample) | 4.5% | 6.8% |
| Standard Deviation (Population) | 4.4% | 6.7% |
Similar Demographics by GED/Equivalency
Demographics Similar to Croatians by GED/Equivalency
In terms of ged/equivalency, the demographic groups most similar to Croatians are Immigrants from Taiwan (88.8%, a difference of 0.030%), Slovene (88.8%, a difference of 0.030%), Okinawan (88.9%, a difference of 0.060%), Cypriot (88.9%, a difference of 0.080%), and Swedish (88.8%, a difference of 0.080%).
| Demographics | Rating | Rank | GED/Equivalency |
| Norwegians | 99.9 /100 | #10 | Exceptional 89.0% |
| Bulgarians | 99.9 /100 | #11 | Exceptional 89.0% |
| Lithuanians | 99.9 /100 | #12 | Exceptional 88.9% |
| Immigrants | Iran | 99.9 /100 | #13 | Exceptional 88.9% |
| Cypriots | 99.9 /100 | #14 | Exceptional 88.9% |
| Okinawans | 99.9 /100 | #15 | Exceptional 88.9% |
| Immigrants | Taiwan | 99.9 /100 | #16 | Exceptional 88.8% |
| Croatians | 99.9 /100 | #17 | Exceptional 88.8% |
| Slovenes | 99.9 /100 | #18 | Exceptional 88.8% |
| Swedes | 99.9 /100 | #19 | Exceptional 88.8% |
| Maltese | 99.9 /100 | #20 | Exceptional 88.6% |
| Luxembourgers | 99.8 /100 | #21 | Exceptional 88.6% |
| Immigrants | Ireland | 99.8 /100 | #22 | Exceptional 88.6% |
| Russians | 99.8 /100 | #23 | Exceptional 88.6% |
| Slovaks | 99.8 /100 | #24 | Exceptional 88.6% |
Demographics Similar to Immigrants from Ukraine by GED/Equivalency
In terms of ged/equivalency, the demographic groups most similar to Immigrants from Ukraine are Immigrants from Germany (86.7%, a difference of 0.0%), Immigrants from Spain (86.7%, a difference of 0.020%), Yugoslavian (86.7%, a difference of 0.030%), Immigrants from Brazil (86.6%, a difference of 0.030%), and Tsimshian (86.6%, a difference of 0.030%).
| Demographics | Rating | Rank | GED/Equivalency |
| Immigrants | Jordan | 90.8 /100 | #122 | Exceptional 86.8% |
| Immigrants | Italy | 90.5 /100 | #123 | Exceptional 86.7% |
| Immigrants | Egypt | 90.4 /100 | #124 | Exceptional 86.7% |
| Celtics | 90.4 /100 | #125 | Exceptional 86.7% |
| Asians | 90.3 /100 | #126 | Exceptional 86.7% |
| Argentineans | 89.7 /100 | #127 | Excellent 86.7% |
| Yugoslavians | 89.5 /100 | #128 | Excellent 86.7% |
| Immigrants | Ukraine | 88.9 /100 | #129 | Excellent 86.7% |
| Immigrants | Germany | 88.8 /100 | #130 | Excellent 86.7% |
| Immigrants | Spain | 88.5 /100 | #131 | Excellent 86.7% |
| Immigrants | Brazil | 88.4 /100 | #132 | Excellent 86.6% |
| Tsimshian | 88.3 /100 | #133 | Excellent 86.6% |
| Albanians | 87.7 /100 | #134 | Excellent 86.6% |
| Immigrants | Asia | 87.4 /100 | #135 | Excellent 86.6% |
| Chileans | 86.9 /100 | #136 | Excellent 86.6% |