Basque vs Immigrants from South Central Asia GED/Equivalency
COMPARE
Basque
Immigrants from South Central Asia
GED/Equivalency
GED/Equivalency Comparison
Basques
Immigrants from South Central Asia
86.4%
GED/EQUIVALENCY
79.5/ 100
METRIC RATING
146th/ 347
METRIC RANK
88.4%
GED/EQUIVALENCY
99.7/ 100
METRIC RATING
35th/ 347
METRIC RANK
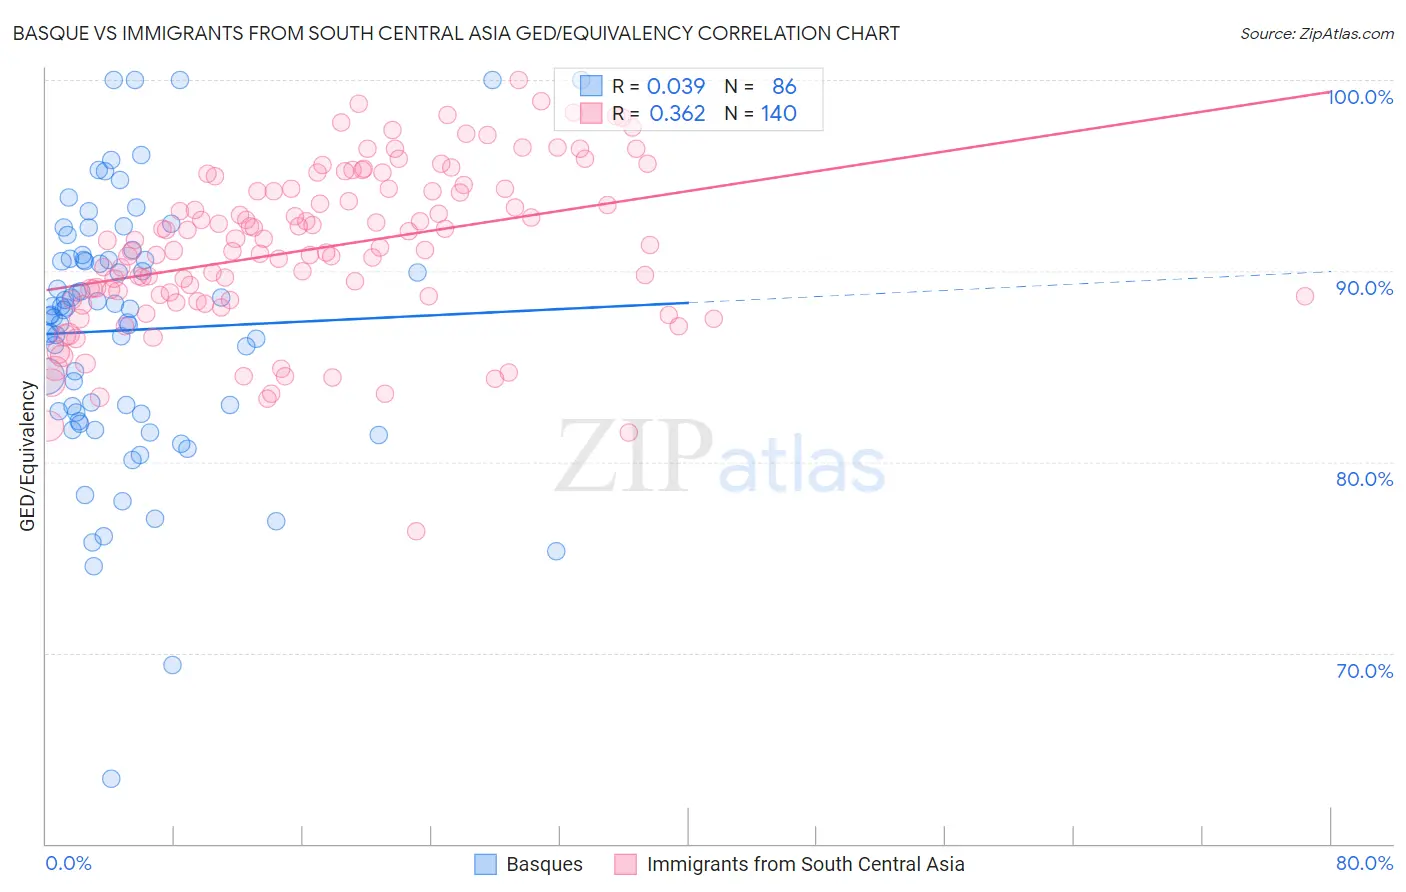
Basque vs Immigrants from South Central Asia GED/Equivalency Correlation Chart
The statistical analysis conducted on geographies consisting of 165,778,463 people shows no correlation between the proportion of Basques and percentage of population with at least ged/equivalency education in the United States with a correlation coefficient (R) of 0.039 and weighted average of 86.4%. Similarly, the statistical analysis conducted on geographies consisting of 473,113,181 people shows a mild positive correlation between the proportion of Immigrants from South Central Asia and percentage of population with at least ged/equivalency education in the United States with a correlation coefficient (R) of 0.362 and weighted average of 88.4%, a difference of 2.3%.
GED/Equivalency Correlation Summary
| Measurement | Basque | Immigrants from South Central Asia |
| Minimum | 63.4% | 76.4% |
| Maximum | 100.0% | 100.0% |
| Range | 36.6% | 23.6% |
| Mean | 86.9% | 91.2% |
| Median | 87.8% | 91.3% |
| Interquartile 25% (IQ1) | 82.6% | 88.6% |
| Interquartile 75% (IQ3) | 90.6% | 94.3% |
| Interquartile Range (IQR) | 8.0% | 5.7% |
| Standard Deviation (Sample) | 6.8% | 4.3% |
| Standard Deviation (Population) | 6.7% | 4.2% |
Similar Demographics by GED/Equivalency
Demographics Similar to Basques by GED/Equivalency
In terms of ged/equivalency, the demographic groups most similar to Basques are Immigrants from Northern Africa (86.3%, a difference of 0.0%), Immigrants from Poland (86.3%, a difference of 0.0%), Menominee (86.3%, a difference of 0.010%), Immigrants from Western Asia (86.3%, a difference of 0.020%), and Pakistani (86.4%, a difference of 0.030%).
| Demographics | Rating | Rank | GED/Equivalency |
| Immigrants | Malaysia | 85.0 /100 | #139 | Excellent 86.5% |
| Paraguayans | 84.1 /100 | #140 | Excellent 86.5% |
| Laotians | 83.2 /100 | #141 | Excellent 86.5% |
| Immigrants | Indonesia | 82.4 /100 | #142 | Excellent 86.4% |
| Immigrants | Pakistan | 82.4 /100 | #143 | Excellent 86.4% |
| Bolivians | 82.1 /100 | #144 | Excellent 86.4% |
| Pakistanis | 80.4 /100 | #145 | Excellent 86.4% |
| Basques | 79.5 /100 | #146 | Good 86.4% |
| Immigrants | Northern Africa | 79.3 /100 | #147 | Good 86.3% |
| Immigrants | Poland | 79.3 /100 | #148 | Good 86.3% |
| Menominee | 79.3 /100 | #149 | Good 86.3% |
| Immigrants | Western Asia | 78.8 /100 | #150 | Good 86.3% |
| Immigrants | Bosnia and Herzegovina | 77.9 /100 | #151 | Good 86.3% |
| Brazilians | 77.2 /100 | #152 | Good 86.3% |
| Kenyans | 76.6 /100 | #153 | Good 86.3% |
Demographics Similar to Immigrants from South Central Asia by GED/Equivalency
In terms of ged/equivalency, the demographic groups most similar to Immigrants from South Central Asia are Immigrants from Sweden (88.4%, a difference of 0.020%), Immigrants from Japan (88.4%, a difference of 0.020%), Immigrants from Belgium (88.3%, a difference of 0.020%), Immigrants from Austria (88.3%, a difference of 0.050%), and Danish (88.4%, a difference of 0.060%).
| Demographics | Rating | Rank | GED/Equivalency |
| Immigrants | Northern Europe | 99.8 /100 | #28 | Exceptional 88.5% |
| Poles | 99.8 /100 | #29 | Exceptional 88.5% |
| Turks | 99.8 /100 | #30 | Exceptional 88.5% |
| Bhutanese | 99.8 /100 | #31 | Exceptional 88.4% |
| Danes | 99.8 /100 | #32 | Exceptional 88.4% |
| Immigrants | Sweden | 99.7 /100 | #33 | Exceptional 88.4% |
| Immigrants | Japan | 99.7 /100 | #34 | Exceptional 88.4% |
| Immigrants | South Central Asia | 99.7 /100 | #35 | Exceptional 88.4% |
| Immigrants | Belgium | 99.7 /100 | #36 | Exceptional 88.3% |
| Immigrants | Austria | 99.7 /100 | #37 | Exceptional 88.3% |
| Burmese | 99.7 /100 | #38 | Exceptional 88.3% |
| Immigrants | Israel | 99.6 /100 | #39 | Exceptional 88.2% |
| Italians | 99.6 /100 | #40 | Exceptional 88.2% |
| Finns | 99.6 /100 | #41 | Exceptional 88.2% |
| Cambodians | 99.6 /100 | #42 | Exceptional 88.2% |