Basque vs Pima GED/Equivalency
COMPARE
Basque
Pima
GED/Equivalency
GED/Equivalency Comparison
Basques
Pima
86.4%
GED/EQUIVALENCY
79.5/ 100
METRIC RATING
146th/ 347
METRIC RANK
76.4%
GED/EQUIVALENCY
0.0/ 100
METRIC RATING
342nd/ 347
METRIC RANK
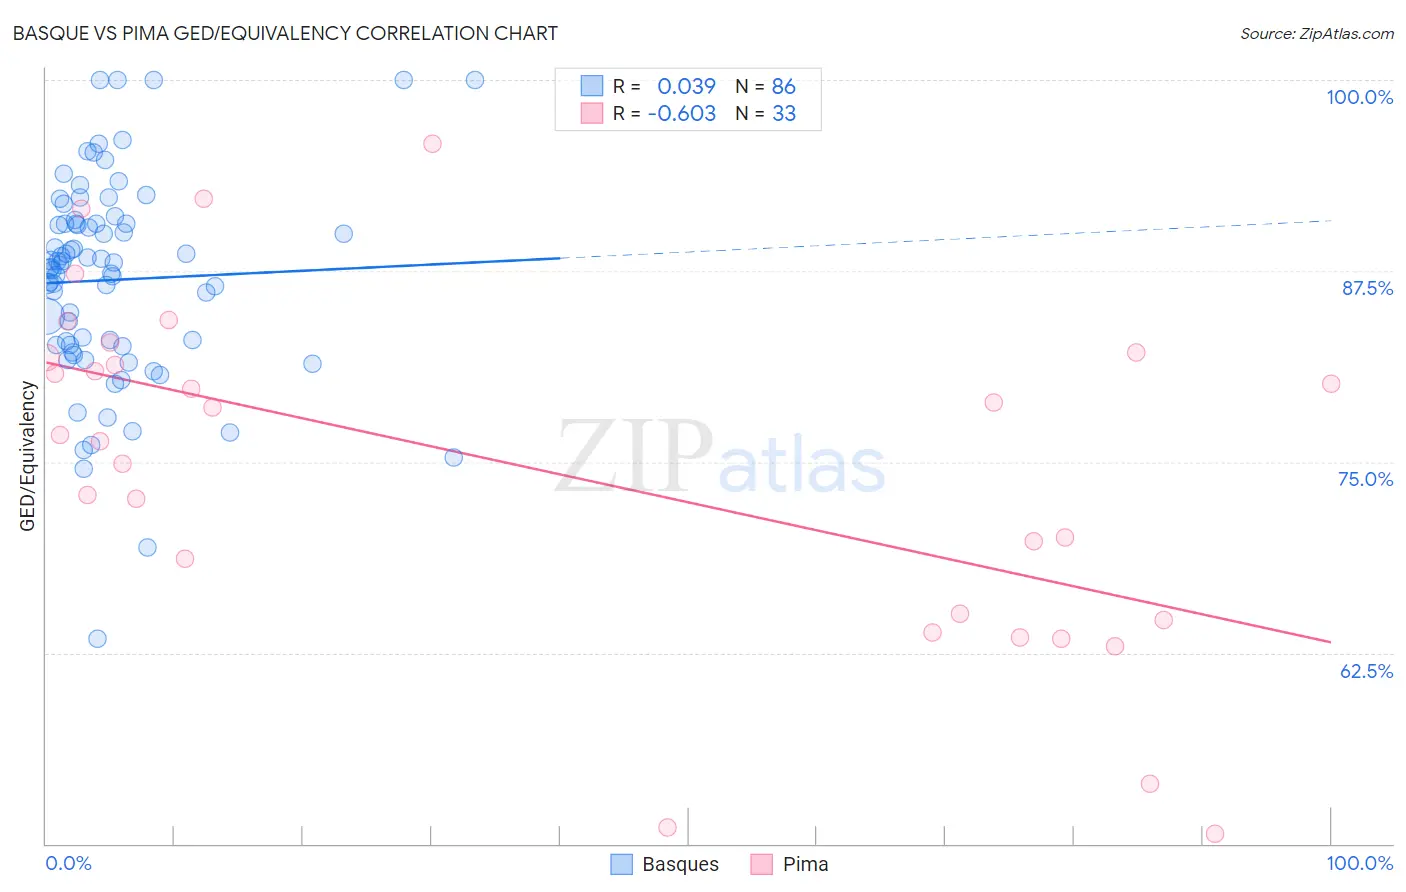
Basque vs Pima GED/Equivalency Correlation Chart
The statistical analysis conducted on geographies consisting of 165,778,463 people shows no correlation between the proportion of Basques and percentage of population with at least ged/equivalency education in the United States with a correlation coefficient (R) of 0.039 and weighted average of 86.4%. Similarly, the statistical analysis conducted on geographies consisting of 61,552,828 people shows a significant negative correlation between the proportion of Pima and percentage of population with at least ged/equivalency education in the United States with a correlation coefficient (R) of -0.603 and weighted average of 76.4%, a difference of 13.0%.
GED/Equivalency Correlation Summary
| Measurement | Basque | Pima |
| Minimum | 63.4% | 50.7% |
| Maximum | 100.0% | 95.8% |
| Range | 36.6% | 45.2% |
| Mean | 86.9% | 74.7% |
| Median | 87.8% | 76.8% |
| Interquartile 25% (IQ1) | 82.6% | 64.8% |
| Interquartile 75% (IQ3) | 90.6% | 82.0% |
| Interquartile Range (IQR) | 8.0% | 17.2% |
| Standard Deviation (Sample) | 6.8% | 11.4% |
| Standard Deviation (Population) | 6.7% | 11.2% |
Similar Demographics by GED/Equivalency
Demographics Similar to Basques by GED/Equivalency
In terms of ged/equivalency, the demographic groups most similar to Basques are Immigrants from Northern Africa (86.3%, a difference of 0.0%), Immigrants from Poland (86.3%, a difference of 0.0%), Menominee (86.3%, a difference of 0.010%), Immigrants from Western Asia (86.3%, a difference of 0.020%), and Pakistani (86.4%, a difference of 0.030%).
| Demographics | Rating | Rank | GED/Equivalency |
| Immigrants | Malaysia | 85.0 /100 | #139 | Excellent 86.5% |
| Paraguayans | 84.1 /100 | #140 | Excellent 86.5% |
| Laotians | 83.2 /100 | #141 | Excellent 86.5% |
| Immigrants | Indonesia | 82.4 /100 | #142 | Excellent 86.4% |
| Immigrants | Pakistan | 82.4 /100 | #143 | Excellent 86.4% |
| Bolivians | 82.1 /100 | #144 | Excellent 86.4% |
| Pakistanis | 80.4 /100 | #145 | Excellent 86.4% |
| Basques | 79.5 /100 | #146 | Good 86.4% |
| Immigrants | Northern Africa | 79.3 /100 | #147 | Good 86.3% |
| Immigrants | Poland | 79.3 /100 | #148 | Good 86.3% |
| Menominee | 79.3 /100 | #149 | Good 86.3% |
| Immigrants | Western Asia | 78.8 /100 | #150 | Good 86.3% |
| Immigrants | Bosnia and Herzegovina | 77.9 /100 | #151 | Good 86.3% |
| Brazilians | 77.2 /100 | #152 | Good 86.3% |
| Kenyans | 76.6 /100 | #153 | Good 86.3% |
Demographics Similar to Pima by GED/Equivalency
In terms of ged/equivalency, the demographic groups most similar to Pima are Immigrants from Central America (76.4%, a difference of 0.090%), Spanish American Indian (76.3%, a difference of 0.12%), Immigrants from Mexico (75.7%, a difference of 1.0%), Mexican (77.4%, a difference of 1.3%), and Tohono O'odham (77.5%, a difference of 1.4%).
| Demographics | Rating | Rank | GED/Equivalency |
| Salvadorans | 0.0 /100 | #333 | Tragic 78.6% |
| Guatemalans | 0.0 /100 | #334 | Tragic 78.5% |
| Immigrants | Latin America | 0.0 /100 | #335 | Tragic 78.5% |
| Immigrants | Dominican Republic | 0.0 /100 | #336 | Tragic 78.0% |
| Immigrants | Yemen | 0.0 /100 | #337 | Tragic 77.9% |
| Immigrants | Guatemala | 0.0 /100 | #338 | Tragic 77.9% |
| Immigrants | El Salvador | 0.0 /100 | #339 | Tragic 77.6% |
| Tohono O'odham | 0.0 /100 | #340 | Tragic 77.5% |
| Mexicans | 0.0 /100 | #341 | Tragic 77.4% |
| Pima | 0.0 /100 | #342 | Tragic 76.4% |
| Immigrants | Central America | 0.0 /100 | #343 | Tragic 76.4% |
| Spanish American Indians | 0.0 /100 | #344 | Tragic 76.3% |
| Immigrants | Mexico | 0.0 /100 | #345 | Tragic 75.7% |
| Houma | 0.0 /100 | #346 | Tragic 75.0% |
| Yakama | 0.0 /100 | #347 | Tragic 74.5% |