Basque vs Asian GED/Equivalency
COMPARE
Basque
Asian
GED/Equivalency
GED/Equivalency Comparison
Basques
Asians
86.4%
GED/EQUIVALENCY
79.5/ 100
METRIC RATING
146th/ 347
METRIC RANK
86.7%
GED/EQUIVALENCY
90.3/ 100
METRIC RATING
126th/ 347
METRIC RANK
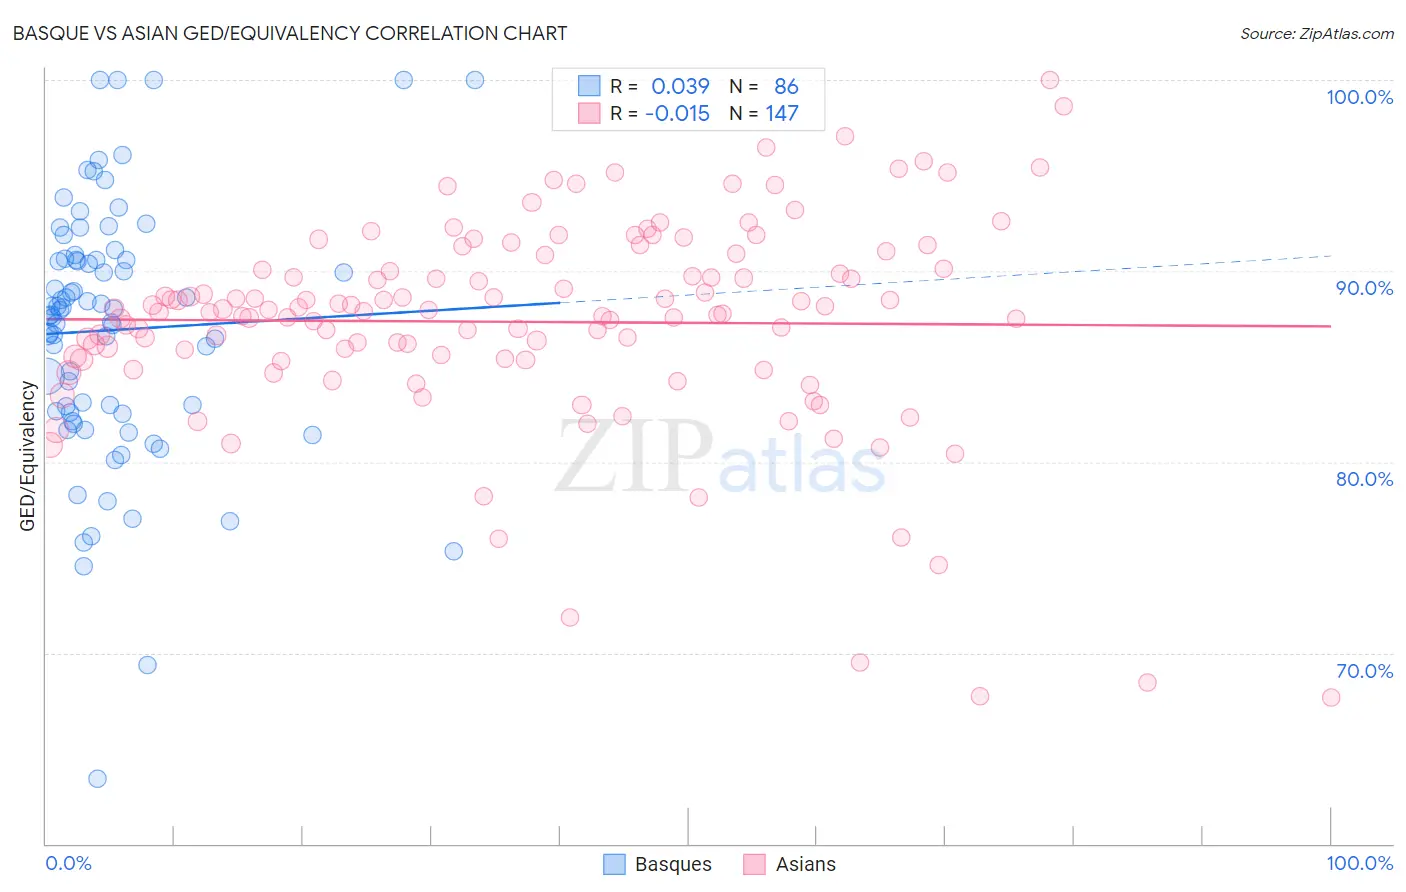
Basque vs Asian GED/Equivalency Correlation Chart
The statistical analysis conducted on geographies consisting of 165,778,463 people shows no correlation between the proportion of Basques and percentage of population with at least ged/equivalency education in the United States with a correlation coefficient (R) of 0.039 and weighted average of 86.4%. Similarly, the statistical analysis conducted on geographies consisting of 550,857,886 people shows no correlation between the proportion of Asians and percentage of population with at least ged/equivalency education in the United States with a correlation coefficient (R) of -0.015 and weighted average of 86.7%, a difference of 0.45%.
GED/Equivalency Correlation Summary
| Measurement | Basque | Asian |
| Minimum | 63.4% | 67.7% |
| Maximum | 100.0% | 100.0% |
| Range | 36.6% | 32.3% |
| Mean | 86.9% | 87.3% |
| Median | 87.8% | 87.9% |
| Interquartile 25% (IQ1) | 82.6% | 85.4% |
| Interquartile 75% (IQ3) | 90.6% | 90.1% |
| Interquartile Range (IQR) | 8.0% | 4.8% |
| Standard Deviation (Sample) | 6.8% | 5.5% |
| Standard Deviation (Population) | 6.7% | 5.5% |
Demographics Similar to Basques and Asians by GED/Equivalency
In terms of ged/equivalency, the demographic groups most similar to Basques are Pakistani (86.4%, a difference of 0.030%), Bolivian (86.4%, a difference of 0.090%), Immigrants from Indonesia (86.4%, a difference of 0.10%), Immigrants from Pakistan (86.4%, a difference of 0.10%), and Laotian (86.5%, a difference of 0.12%). Similarly, the demographic groups most similar to Asians are Argentinean (86.7%, a difference of 0.030%), Yugoslavian (86.7%, a difference of 0.040%), Immigrants from Ukraine (86.7%, a difference of 0.070%), Immigrants from Germany (86.7%, a difference of 0.080%), and Immigrants from Spain (86.7%, a difference of 0.10%).
| Demographics | Rating | Rank | GED/Equivalency |
| Asians | 90.3 /100 | #126 | Exceptional 86.7% |
| Argentineans | 89.7 /100 | #127 | Excellent 86.7% |
| Yugoslavians | 89.5 /100 | #128 | Excellent 86.7% |
| Immigrants | Ukraine | 88.9 /100 | #129 | Excellent 86.7% |
| Immigrants | Germany | 88.8 /100 | #130 | Excellent 86.7% |
| Immigrants | Spain | 88.5 /100 | #131 | Excellent 86.7% |
| Immigrants | Brazil | 88.4 /100 | #132 | Excellent 86.6% |
| Tsimshian | 88.3 /100 | #133 | Excellent 86.6% |
| Albanians | 87.7 /100 | #134 | Excellent 86.6% |
| Immigrants | Asia | 87.4 /100 | #135 | Excellent 86.6% |
| Chileans | 86.9 /100 | #136 | Excellent 86.6% |
| Arabs | 86.7 /100 | #137 | Excellent 86.6% |
| Immigrants | Argentina | 86.5 /100 | #138 | Excellent 86.6% |
| Immigrants | Malaysia | 85.0 /100 | #139 | Excellent 86.5% |
| Paraguayans | 84.1 /100 | #140 | Excellent 86.5% |
| Laotians | 83.2 /100 | #141 | Excellent 86.5% |
| Immigrants | Indonesia | 82.4 /100 | #142 | Excellent 86.4% |
| Immigrants | Pakistan | 82.4 /100 | #143 | Excellent 86.4% |
| Bolivians | 82.1 /100 | #144 | Excellent 86.4% |
| Pakistanis | 80.4 /100 | #145 | Excellent 86.4% |
| Basques | 79.5 /100 | #146 | Good 86.4% |