Luxembourger Male Disability

COMPARE

Luxembourger
Race
Ancestry
AfghanAfricanAlaska NativeAlaskan AthabascanAlbanianAleutAlsatianAmericanApacheArabArapahoArgentineanArmenianAssyrian/Chaldean/SyriacAustralianAustrianBahamianBangladeshiBarbadianBasqueBelgianBelizeanBermudanBhutaneseBlackfeetBolivianBrazilianBritishBritish West IndianBulgarianBurmeseCajunCambodianCanadianCape VerdeanCarpatho RusynCelticCentral AmericanCentral American IndianCherokeeCheyenneChickasawChileanChineseChippewaChoctawColombianColvilleComancheCosta RicanCreeCreekCroatianCrowCubanCypriotCzechCzechoslovakianDanishDelawareDominicanDutchDutch West IndianEastern EuropeanEcuadorianEgyptianEnglishEstonianEthiopianEuropeanFijianFilipinoFinnishFrenchFrench American IndianFrench CanadianGermanGerman RussianGhanaianGreekGuamanian/ChamorroGuatemalanGuyaneseHaitianHmongHonduranHopiHoumaHungarianIcelanderIndian (Asian)IndonesianInupiatIranianIraqiIrishIroquoisIsraeliItalianJamaicanJapaneseJordanianKenyanKiowaKoreanLaotianLatvianLebaneseLiberianLithuanianLumbeeLuxembourgerMacedonianMalaysianMalteseMarshalleseMenomineeMexicanMexican American IndianMongolianMoroccanNative HawaiianNavajoNepaleseNew ZealanderNicaraguanNigerianNorthern EuropeanNorwegianOkinawanOsageOttawaPaiutePakistaniPalestinianPanamanianParaguayanPennsylvania GermanPeruvianPimaPolishPortuguesePotawatomiPuebloPuerto RicanPuget Sound SalishRomanianRussianSalvadoranSamoanScandinavianScotch-IrishScottishSeminoleSenegaleseSerbianShoshoneSierra LeoneanSiouxSlavicSlovakSloveneSomaliSouth AfricanSouth AmericanSouth American IndianSoviet UnionSpaniardSpanishSpanish AmericanSpanish American IndianSri LankanSubsaharan AfricanSudaneseSwedishSwissSyrianTaiwaneseThaiTlingit-HaidaTohono O'OdhamTonganTrinidadian and TobagonianTsimshianTurkishU.S. Virgin IslanderUgandanUkrainianUruguayanUteVenezuelanVietnameseWelshWest IndianYakamaYaquiYugoslavianYumanYup'ikZimbabwean
Immigration
NonimmigrantsImmigrantsAfghanistanAfricaAlbaniaArgentinaArmeniaAsiaAustraliaAustriaBahamasBangladeshBarbadosBelarusBelgiumBelizeBoliviaBosnia and HerzegovinaBrazilBulgariaBurma/MyanmarCabo VerdeCambodiaCameroonCanadaCaribbeanCentral AmericaChileChinaColombiaCongoCosta RicaCroatiaCubaCzechoslovakiaDenmarkDominicaDominican RepublicEastern AfricaEastern AsiaEastern EuropeEcuadorEgyptEl SalvadorEnglandEritreaEthiopiaEuropeFijiFranceGermanyGhanaGreeceGrenadaGuatemalaGuyanaHaitiHondurasHong KongHungaryIndiaIndonesiaIranIraqIrelandIsraelItalyJamaicaJapanJordanKazakhstanKenyaKoreaKuwaitLaosLatin AmericaLatviaLebanonLiberiaLithuaniaMalaysiaMexicoMicronesiaMiddle AfricaMoldovaMoroccoNepalNetherlandsNicaraguaNigeriaNorth AmericaNorth MacedoniaNorthern AfricaNorthern EuropeNorwayOceaniaPakistanPanamaPeruPhilippinesPolandPortugalRomaniaRussiaSaudi ArabiaScotlandSenegalSerbiaSierra LeoneSingaporeSomaliaSouth AfricaSouth AmericaSouth Central AsiaSouth Eastern AsiaSouthern EuropeSpainSri LankaSt. Vincent and the GrenadinesSudanSwedenSwitzerlandSyriaTaiwanThailandTrinidad and TobagoTurkeyUgandaUkraineUruguayUzbekistanVenezuelaVietnamWest IndiesWestern AfricaWestern AsiaWestern EuropeYemenZaireZimbabweAzores
Select to Compare
Race
Ancestry
AfghanAfricanAlaska NativeAlaskan AthabascanAlbanianAleutAlsatianAmericanApacheArabArapahoArgentineanArmenianAssyrian/Chaldean/SyriacAustralianAustrianBahamianBangladeshiBarbadianBasqueBelgianBelizeanBermudanBhutaneseBlackfeetBolivianBrazilianBritishBritish West IndianBulgarianBurmeseCajunCambodianCanadianCape VerdeanCarpatho RusynCelticCentral AmericanCentral American IndianCherokeeCheyenneChickasawChileanChineseChippewaChoctawColombianColvilleComancheCosta RicanCreeCreekCroatianCrowCubanCypriotCzechCzechoslovakianDanishDelawareDominicanDutchDutch West IndianEastern EuropeanEcuadorianEgyptianEnglishEstonianEthiopianEuropeanFijianFilipinoFinnishFrenchFrench American IndianFrench CanadianGermanGerman RussianGhanaianGreekGuamanian/ChamorroGuatemalanGuyaneseHaitianHmongHonduranHopiHoumaHungarianIcelanderIndian (Asian)IndonesianInupiatIranianIraqiIrishIroquoisIsraeliItalianJamaicanJapaneseJordanianKenyanKiowaKoreanLaotianLatvianLebaneseLiberianLithuanianLumbeeMacedonianMalaysianMalteseMarshalleseMenomineeMexicanMexican American IndianMongolianMoroccanNative HawaiianNavajoNepaleseNew ZealanderNicaraguanNigerianNorthern EuropeanNorwegianOkinawanOsageOttawaPaiutePakistaniPalestinianPanamanianParaguayanPennsylvania GermanPeruvianPimaPolishPortuguesePotawatomiPuebloPuerto RicanPuget Sound SalishRomanianRussianSalvadoranSamoanScandinavianScotch-IrishScottishSeminoleSenegaleseSerbianShoshoneSierra LeoneanSiouxSlavicSlovakSloveneSomaliSouth AfricanSouth AmericanSouth American IndianSoviet UnionSpaniardSpanishSpanish AmericanSpanish American IndianSri LankanSubsaharan AfricanSudaneseSwedishSwissSyrianTaiwaneseThaiTlingit-HaidaTohono O'OdhamTonganTrinidadian and TobagonianTsimshianTurkishU.S. Virgin IslanderUgandanUkrainianUruguayanUteVenezuelanVietnameseWelshWest IndianYakamaYaquiYugoslavianYumanYup'ikZimbabwean
Immigration
NonimmigrantsImmigrantsAfghanistanAfricaAlbaniaArgentinaArmeniaAsiaAustraliaAustriaBahamasBangladeshBarbadosBelarusBelgiumBelizeBoliviaBosnia and HerzegovinaBrazilBulgariaBurma/MyanmarCabo VerdeCambodiaCameroonCanadaCaribbeanCentral AmericaChileChinaColombiaCongoCosta RicaCroatiaCubaCzechoslovakiaDenmarkDominicaDominican RepublicEastern AfricaEastern AsiaEastern EuropeEcuadorEgyptEl SalvadorEnglandEritreaEthiopiaEuropeFijiFranceGermanyGhanaGreeceGrenadaGuatemalaGuyanaHaitiHondurasHong KongHungaryIndiaIndonesiaIranIraqIrelandIsraelItalyJamaicaJapanJordanKazakhstanKenyaKoreaKuwaitLaosLatin AmericaLatviaLebanonLiberiaLithuaniaMalaysiaMexicoMicronesiaMiddle AfricaMoldovaMoroccoNepalNetherlandsNicaraguaNigeriaNorth AmericaNorth MacedoniaNorthern AfricaNorthern EuropeNorwayOceaniaPakistanPanamaPeruPhilippinesPolandPortugalRomaniaRussiaSaudi ArabiaScotlandSenegalSerbiaSierra LeoneSingaporeSomaliaSouth AfricaSouth AmericaSouth Central AsiaSouth Eastern AsiaSouthern EuropeSpainSri LankaSt. Vincent and the GrenadinesSudanSwedenSwitzerlandSyriaTaiwanThailandTrinidad and TobagoTurkeyUgandaUkraineUruguayUzbekistanVenezuelaVietnamWest IndiesWestern AfricaWestern AsiaWestern EuropeYemenZaireZimbabweAzores
Male Disability
Income
Poverty
Unemployment
Labor Participation
Family Structure
Vehicle Availability
Education Level
Disability

Luxembourger Male Disability
Good

11.1%
DISABILITY | MALES
61.9/ 100
METRIC RATING
165th/ 347
METRIC RANK

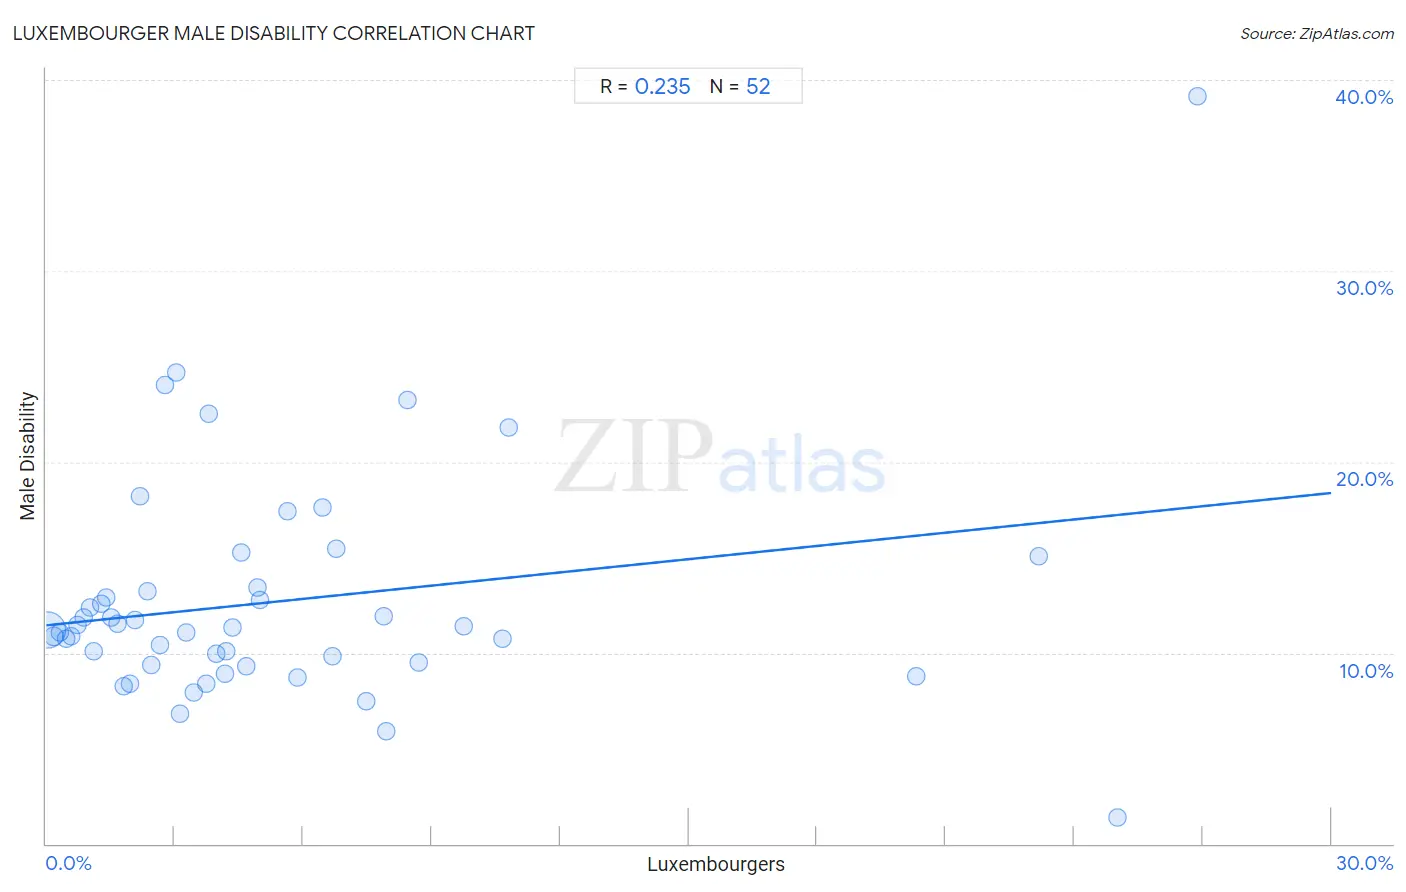
Luxembourger Male Disability Correlation Chart

The statistical analysis conducted on geographies consisting of 144,678,542 people shows a weak positive correlation between the proportion of Luxembourgers and percentage of males with a disability in the United States with a correlation coefficient (R) of 0.235 and weighted average of 11.1%. On average, for every 1% (one percent) increase in Luxembourgers within a typical geography, there is an increase of 0.23% in percentage of males with a disability.
Luxembourger Male Disability
It is essential to understand that the correlation between the percentage of Luxembourgers and percentage of males with a disability does not imply a direct cause-and-effect relationship. It remains uncertain whether the presence of Luxembourgers influences an upward or downward trend in the level of percentage of males with a disability within an area, or if Luxembourgers simply ended up residing in those areas with higher or lower levels of percentage of males with a disability due to other factors.

Demographics Similar to Luxembourgers by Male Disability

In terms of male disability, the demographic groups most similar to Luxembourgers are Immigrants from Hungary (11.1%, a difference of 0.040%), British West Indian (11.1%, a difference of 0.050%), Immigrants from Kenya (11.1%, a difference of 0.11%), Immigrants from Haiti (11.1%, a difference of 0.20%), and Immigrants from West Indies (11.1%, a difference of 0.23%).
DemographicsRating | RankMale Disability
Latvians
68.1
/100
|
#158
Good
11.1%
Guatemalans
67.2
/100
|
#159
Good
11.1%
Albanians
66.5
/100
|
#160
Good
11.1%
Immigrants from West Indies
65.7
/100
|
#161
Good
11.1%
Immigrants from Haiti
65.3
/100
|
#162
Good
11.1%
Immigrants from Kenya
63.8
/100
|
#163
Good
11.1%
British West Indians
62.8
/100
|
#164
Good
11.1%
Luxembourgers
61.9
/100
|
#165
Good
11.1%
Immigrants from Hungary
61.2
/100
|
#166
Good
11.1%
Immigrants from Southern Europe
54.4
/100
|
#167
Average
11.2%
Immigrants from Latin America
54.0
/100
|
#168
Average
11.2%
Barbadians
53.4
/100
|
#169
Average
11.2%
New Zealanders
52.9
/100
|
#170
Average
11.2%
Haitians
52.5
/100
|
#171
Average
11.2%
Romanians
50.7
/100
|
#172
Average
11.2%

Luxembourger Male Disability Correlation Summary

MeasurementLuxembourger DataMale Disability Data
Minimum0.026%1.4%
Maximum26.9%39.1%
Range26.8%37.8%
Mean5.5%12.7%
Median3.8%11.3%
Interquartile 25% (IQ1)1.7%9.4%
Interquartile 75% (IQ3)6.7%13.3%
Interquartile Range (IQR)5.0%3.9%
Standard Deviation (Sample)6.1%6.0%
Standard Deviation (Population)6.0%5.9%

Correlation Details

Luxembourger PercentileSample SizeMale Disability
[
0.0%
-
0.5%
]
0.026%
133,175,45211.2%
[
0.0%
-
0.5%
]
0.18%
7,647,92710.9%
[
0.0%
-
0.5%
]
0.32%
1,625,97811.1%
[
0.0%
-
0.5%
]
0.46%
873,93810.7%
[
0.5%
-
1.0%
]
0.59%
427,07310.9%
[
0.5%
-
1.0%
]
0.72%
212,63811.5%
[
0.5%
-
1.0%
]
0.88%
175,13511.9%
[
1.0%
-
1.5%
]
1.01%
91,61812.4%
[
1.0%
-
1.5%
]
1.12%
52,97210.1%
[
1.0%
-
1.5%
]
1.27%
45,14112.6%
[
1.0%
-
1.5%
]
1.39%
108,68412.9%
[
1.5%
-
2.0%
]
1.52%
32,60511.9%
[
1.5%
-
2.0%
]
1.67%
13,13911.5%
[
1.5%
-
2.0%
]
1.81%
73,4348.2%
[
1.5%
-
2.0%
]
1.96%
9,9548.4%
[
2.0%
-
2.5%
]
2.06%
20,18111.7%
[
2.0%
-
2.5%
]
2.20%
7,91918.2%
[
2.0%
-
2.5%
]
2.35%
16,57313.2%
[
2.0%
-
2.5%
]
2.44%
6,9609.4%
[
2.5%
-
3.0%
]
2.66%
3,54010.4%
[
2.5%
-
3.0%
]
2.77%
25324.0%
[
3.0%
-
3.5%
]
3.03%
13224.7%
[
3.0%
-
3.5%
]
3.13%
1,9816.8%
[
3.0%
-
3.5%
]
3.27%
6,72411.1%
[
3.0%
-
3.5%
]
3.44%
9607.9%
[
3.5%
-
4.0%
]
3.73%
2,7118.4%
[
3.5%
-
4.0%
]
3.80%
7922.5%
[
3.5%
-
4.0%
]
3.98%
5,1569.9%
[
4.0%
-
4.5%
]
4.16%
5298.9%
[
4.0%
-
4.5%
]
4.20%
2,90210.1%
[
4.0%
-
4.5%
]
4.36%
4,90711.3%
[
4.5%
-
5.0%
]
4.56%
2,49915.3%
[
4.5%
-
5.0%
]
4.67%
1,0709.3%
[
4.5%
-
5.0%
]
4.95%
18213.4%
[
4.5%
-
5.0%
]
4.99%
3,80512.7%
[
5.5%
-
6.0%
]
5.62%
49817.4%
[
5.5%
-
6.0%
]
5.88%
5,4428.7%
[
6.0%
-
6.5%
]
6.44%
41917.6%
[
6.5%
-
7.0%
]
6.69%
1,1369.8%
[
6.5%
-
7.0%
]
6.78%
67815.5%
[
7.0%
-
7.5%
]
7.46%
3,1647.4%
[
7.5%
-
8.0%
]
7.88%
3,09611.9%
[
7.5%
-
8.0%
]
7.95%
4155.9%
[
8.0%
-
8.5%
]
8.43%
1,28123.2%
[
8.5%
-
9.0%
]
8.69%
2,0959.5%
[
9.5%
-
10.0%
]
9.76%
3,59611.4%
[
10.5%
-
11.0%
]
10.64%
23510.7%
[
10.5%
-
11.0%
]
10.80%
28721.8%
[
20.0%
-
20.5%
]
20.30%
1338.7%
[
23.0%
-
23.5%
]
23.16%
99315.1%
[
25.0%
-
25.5%
]
25.00%
2561.4%
[
26.5%
-
27.0%
]
26.87%
6739.1%