Luxembourger Wage/Income Gap

COMPARE

Luxembourger
Race
Ancestry
AfghanAfricanAlaska NativeAlaskan AthabascanAlbanianAleutAlsatianAmericanApacheArabArapahoArgentineanArmenianAssyrian/Chaldean/SyriacAustralianAustrianBahamianBangladeshiBarbadianBasqueBelgianBelizeanBermudanBhutaneseBlackfeetBolivianBrazilianBritishBritish West IndianBulgarianBurmeseCajunCambodianCanadianCape VerdeanCarpatho RusynCelticCentral AmericanCentral American IndianCherokeeCheyenneChickasawChileanChineseChippewaChoctawColombianColvilleComancheCosta RicanCreeCreekCroatianCrowCubanCypriotCzechCzechoslovakianDanishDelawareDominicanDutchDutch West IndianEastern EuropeanEcuadorianEgyptianEnglishEstonianEthiopianEuropeanFijianFilipinoFinnishFrenchFrench American IndianFrench CanadianGermanGerman RussianGhanaianGreekGuamanian/ChamorroGuatemalanGuyaneseHaitianHmongHonduranHopiHoumaHungarianIcelanderIndian (Asian)IndonesianInupiatIranianIraqiIrishIroquoisIsraeliItalianJamaicanJapaneseJordanianKenyanKiowaKoreanLaotianLatvianLebaneseLiberianLithuanianLumbeeLuxembourgerMacedonianMalaysianMalteseMarshalleseMenomineeMexicanMexican American IndianMongolianMoroccanNative HawaiianNavajoNepaleseNew ZealanderNicaraguanNigerianNorthern EuropeanNorwegianOkinawanOsageOttawaPaiutePakistaniPalestinianPanamanianParaguayanPennsylvania GermanPeruvianPimaPolishPortuguesePotawatomiPuebloPuerto RicanPuget Sound SalishRomanianRussianSalvadoranSamoanScandinavianScotch-IrishScottishSeminoleSenegaleseSerbianShoshoneSierra LeoneanSiouxSlavicSlovakSloveneSomaliSouth AfricanSouth AmericanSouth American IndianSoviet UnionSpaniardSpanishSpanish AmericanSpanish American IndianSri LankanSubsaharan AfricanSudaneseSwedishSwissSyrianTaiwaneseThaiTlingit-HaidaTohono O'OdhamTonganTrinidadian and TobagonianTsimshianTurkishU.S. Virgin IslanderUgandanUkrainianUruguayanUteVenezuelanVietnameseWelshWest IndianYakamaYaquiYugoslavianYumanYup'ikZimbabwean
Immigration
NonimmigrantsImmigrantsAfghanistanAfricaAlbaniaArgentinaArmeniaAsiaAustraliaAustriaBahamasBangladeshBarbadosBelarusBelgiumBelizeBoliviaBosnia and HerzegovinaBrazilBulgariaBurma/MyanmarCabo VerdeCambodiaCameroonCanadaCaribbeanCentral AmericaChileChinaColombiaCongoCosta RicaCroatiaCubaCzechoslovakiaDenmarkDominicaDominican RepublicEastern AfricaEastern AsiaEastern EuropeEcuadorEgyptEl SalvadorEnglandEritreaEthiopiaEuropeFijiFranceGermanyGhanaGreeceGrenadaGuatemalaGuyanaHaitiHondurasHong KongHungaryIndiaIndonesiaIranIraqIrelandIsraelItalyJamaicaJapanJordanKazakhstanKenyaKoreaKuwaitLaosLatin AmericaLatviaLebanonLiberiaLithuaniaMalaysiaMexicoMicronesiaMiddle AfricaMoldovaMoroccoNepalNetherlandsNicaraguaNigeriaNorth AmericaNorth MacedoniaNorthern AfricaNorthern EuropeNorwayOceaniaPakistanPanamaPeruPhilippinesPolandPortugalRomaniaRussiaSaudi ArabiaScotlandSenegalSerbiaSierra LeoneSingaporeSomaliaSouth AfricaSouth AmericaSouth Central AsiaSouth Eastern AsiaSouthern EuropeSpainSri LankaSt. Vincent and the GrenadinesSudanSwedenSwitzerlandSyriaTaiwanThailandTrinidad and TobagoTurkeyUgandaUkraineUruguayUzbekistanVenezuelaVietnamWest IndiesWestern AfricaWestern AsiaWestern EuropeYemenZaireZimbabweAzores
Select to Compare
Race
Ancestry
AfghanAfricanAlaska NativeAlaskan AthabascanAlbanianAleutAlsatianAmericanApacheArabArapahoArgentineanArmenianAssyrian/Chaldean/SyriacAustralianAustrianBahamianBangladeshiBarbadianBasqueBelgianBelizeanBermudanBhutaneseBlackfeetBolivianBrazilianBritishBritish West IndianBulgarianBurmeseCajunCambodianCanadianCape VerdeanCarpatho RusynCelticCentral AmericanCentral American IndianCherokeeCheyenneChickasawChileanChineseChippewaChoctawColombianColvilleComancheCosta RicanCreeCreekCroatianCrowCubanCypriotCzechCzechoslovakianDanishDelawareDominicanDutchDutch West IndianEastern EuropeanEcuadorianEgyptianEnglishEstonianEthiopianEuropeanFijianFilipinoFinnishFrenchFrench American IndianFrench CanadianGermanGerman RussianGhanaianGreekGuamanian/ChamorroGuatemalanGuyaneseHaitianHmongHonduranHopiHoumaHungarianIcelanderIndian (Asian)IndonesianInupiatIranianIraqiIrishIroquoisIsraeliItalianJamaicanJapaneseJordanianKenyanKiowaKoreanLaotianLatvianLebaneseLiberianLithuanianLumbeeMacedonianMalaysianMalteseMarshalleseMenomineeMexicanMexican American IndianMongolianMoroccanNative HawaiianNavajoNepaleseNew ZealanderNicaraguanNigerianNorthern EuropeanNorwegianOkinawanOsageOttawaPaiutePakistaniPalestinianPanamanianParaguayanPennsylvania GermanPeruvianPimaPolishPortuguesePotawatomiPuebloPuerto RicanPuget Sound SalishRomanianRussianSalvadoranSamoanScandinavianScotch-IrishScottishSeminoleSenegaleseSerbianShoshoneSierra LeoneanSiouxSlavicSlovakSloveneSomaliSouth AfricanSouth AmericanSouth American IndianSoviet UnionSpaniardSpanishSpanish AmericanSpanish American IndianSri LankanSubsaharan AfricanSudaneseSwedishSwissSyrianTaiwaneseThaiTlingit-HaidaTohono O'OdhamTonganTrinidadian and TobagonianTsimshianTurkishU.S. Virgin IslanderUgandanUkrainianUruguayanUteVenezuelanVietnameseWelshWest IndianYakamaYaquiYugoslavianYumanYup'ikZimbabwean
Immigration
NonimmigrantsImmigrantsAfghanistanAfricaAlbaniaArgentinaArmeniaAsiaAustraliaAustriaBahamasBangladeshBarbadosBelarusBelgiumBelizeBoliviaBosnia and HerzegovinaBrazilBulgariaBurma/MyanmarCabo VerdeCambodiaCameroonCanadaCaribbeanCentral AmericaChileChinaColombiaCongoCosta RicaCroatiaCubaCzechoslovakiaDenmarkDominicaDominican RepublicEastern AfricaEastern AsiaEastern EuropeEcuadorEgyptEl SalvadorEnglandEritreaEthiopiaEuropeFijiFranceGermanyGhanaGreeceGrenadaGuatemalaGuyanaHaitiHondurasHong KongHungaryIndiaIndonesiaIranIraqIrelandIsraelItalyJamaicaJapanJordanKazakhstanKenyaKoreaKuwaitLaosLatin AmericaLatviaLebanonLiberiaLithuaniaMalaysiaMexicoMicronesiaMiddle AfricaMoldovaMoroccoNepalNetherlandsNicaraguaNigeriaNorth AmericaNorth MacedoniaNorthern AfricaNorthern EuropeNorwayOceaniaPakistanPanamaPeruPhilippinesPolandPortugalRomaniaRussiaSaudi ArabiaScotlandSenegalSerbiaSierra LeoneSingaporeSomaliaSouth AfricaSouth AmericaSouth Central AsiaSouth Eastern AsiaSouthern EuropeSpainSri LankaSt. Vincent and the GrenadinesSudanSwedenSwitzerlandSyriaTaiwanThailandTrinidad and TobagoTurkeyUgandaUkraineUruguayUzbekistanVenezuelaVietnamWest IndiesWestern AfricaWestern AsiaWestern EuropeYemenZaireZimbabweAzores
Wage/Income Gap
Income
Poverty
Unemployment
Labor Participation
Family Structure
Vehicle Availability
Education Level
Disability

Luxembourger Wage/Income Gap
Tragic

27.4%
WAGE/INCOME GAP
1.9/ 100
METRIC RATING
257th/ 347
METRIC RANK

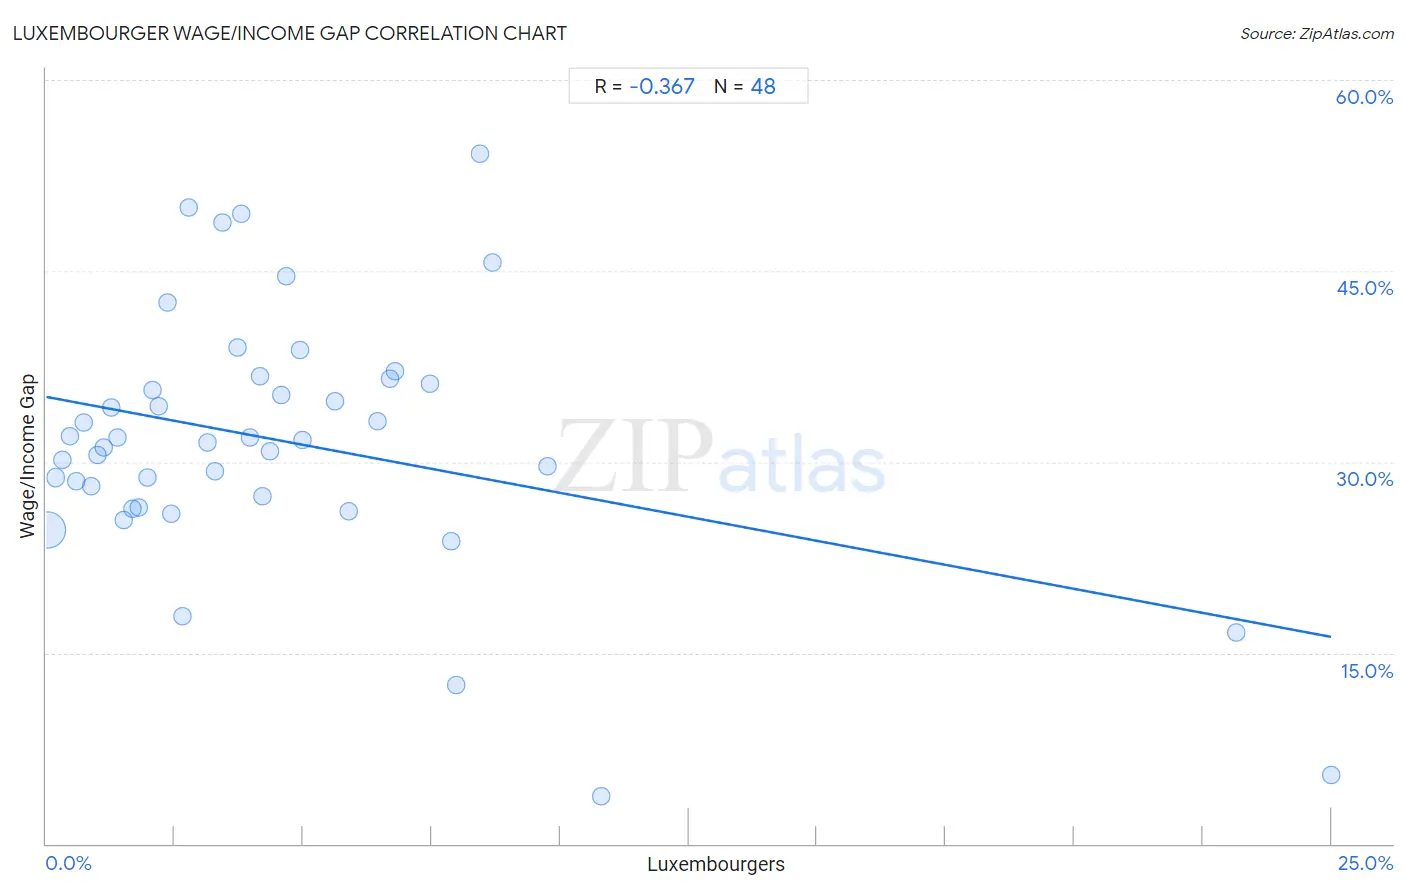
Luxembourger Wage/Income Gap Correlation Chart

The statistical analysis conducted on geographies consisting of 144,643,301 people shows a mild negative correlation between the proportion of Luxembourgers and wage/income gap percentage in the United States with a correlation coefficient (R) of -0.367 and weighted average of 27.4%. On average, for every 1% (one percent) increase in Luxembourgers within a typical geography, there is a decrease of 0.75% in wage/income gap percentage.
Luxembourger Wage/Income Gap
It is essential to understand that the correlation between the percentage of Luxembourgers and wage/income gap percentage does not imply a direct cause-and-effect relationship. It remains uncertain whether the presence of Luxembourgers influences an upward or downward trend in the level of wage/income gap percentage within an area, or if Luxembourgers simply ended up residing in those areas with higher or lower levels of wage/income gap percentage due to other factors.

Demographics Similar to Luxembourgers by Wage/Income Gap

In terms of wage/income gap, the demographic groups most similar to Luxembourgers are Slavic (27.4%, a difference of 0.040%), Cherokee (27.4%, a difference of 0.050%), Icelander (27.5%, a difference of 0.11%), Tongan (27.5%, a difference of 0.13%), and Immigrants from France (27.4%, a difference of 0.15%).
DemographicsRating | RankWage/Income Gap
Immigrants from Czechoslovakia
2.7
/100
|
#250
Tragic
27.3%
Immigrants from Norway
2.5
/100
|
#251
Tragic
27.3%
Ukrainians
2.4
/100
|
#252
Tragic
27.3%
Portuguese
2.2
/100
|
#253
Tragic
27.4%
Israelis
2.1
/100
|
#254
Tragic
27.4%
Immigrants from France
2.1
/100
|
#255
Tragic
27.4%
Cherokee
1.9
/100
|
#256
Tragic
27.4%
Luxembourgers
1.9
/100
|
#257
Tragic
27.4%
Slavs
1.8
/100
|
#258
Tragic
27.4%
Icelanders
1.8
/100
|
#259
Tragic
27.5%
Tongans
1.7
/100
|
#260
Tragic
27.5%
Immigrants from Germany
1.5
/100
|
#261
Tragic
27.5%
Immigrants from Lebanon
1.5
/100
|
#262
Tragic
27.5%
Syrians
1.4
/100
|
#263
Tragic
27.6%
Immigrants from Switzerland
1.0
/100
|
#264
Tragic
27.7%

Luxembourger Wage/Income Gap Correlation Summary

MeasurementLuxembourger DataWage/Income Gap Data
Minimum0.026%3.7%
Maximum25.0%54.2%
Range25.0%50.5%
Mean4.7%31.6%
Median3.6%31.6%
Interquartile 25% (IQ1)1.6%26.9%
Interquartile 75% (IQ3)6.2%36.3%
Interquartile Range (IQR)4.6%9.5%
Standard Deviation (Sample)4.9%10.1%
Standard Deviation (Population)4.9%10.0%

Correlation Details

Luxembourger PercentileSample SizeWage/Income Gap
[
0.0%
-
0.5%
]
0.026%
133,171,16124.7%
[
0.0%
-
0.5%
]
0.18%
7,635,33428.8%
[
0.0%
-
0.5%
]
0.32%
1,623,47730.2%
[
0.0%
-
0.5%
]
0.46%
867,31532.0%
[
0.5%
-
1.0%
]
0.59%
426,39728.5%
[
0.5%
-
1.0%
]
0.72%
211,60733.1%
[
0.5%
-
1.0%
]
0.88%
174,66828.1%
[
1.0%
-
1.5%
]
1.01%
90,38030.5%
[
1.0%
-
1.5%
]
1.12%
52,35931.1%
[
1.0%
-
1.5%
]
1.27%
44,33134.3%
[
1.0%
-
1.5%
]
1.39%
108,68431.9%
[
1.5%
-
2.0%
]
1.51%
34,52525.4%
[
1.5%
-
2.0%
]
1.67%
13,01526.3%
[
1.5%
-
2.0%
]
1.81%
71,28026.4%
[
1.5%
-
2.0%
]
1.96%
9,80328.8%
[
2.0%
-
2.5%
]
2.06%
19,39535.6%
[
2.0%
-
2.5%
]
2.20%
7,22934.4%
[
2.0%
-
2.5%
]
2.35%
15,63542.6%
[
2.0%
-
2.5%
]
2.44%
6,96025.9%
[
2.5%
-
3.0%
]
2.66%
3,42617.8%
[
2.5%
-
3.0%
]
2.77%
25350.0%
[
3.0%
-
3.5%
]
3.13%
1,98131.5%
[
3.0%
-
3.5%
]
3.27%
6,72429.3%
[
3.0%
-
3.5%
]
3.44%
96048.8%
[
3.5%
-
4.0%
]
3.73%
2,71139.0%
[
3.5%
-
4.0%
]
3.80%
7949.5%
[
3.5%
-
4.0%
]
3.98%
5,15631.9%
[
4.0%
-
4.5%
]
4.16%
52936.8%
[
4.0%
-
4.5%
]
4.21%
2,44627.3%
[
4.0%
-
4.5%
]
4.36%
4,90730.8%
[
4.5%
-
5.0%
]
4.56%
2,49935.2%
[
4.5%
-
5.0%
]
4.67%
1,07044.6%
[
4.5%
-
5.0%
]
4.95%
18238.8%
[
4.5%
-
5.0%
]
4.99%
3,80531.7%
[
5.5%
-
6.0%
]
5.63%
46234.8%
[
5.5%
-
6.0%
]
5.88%
5,44226.1%
[
6.0%
-
6.5%
]
6.44%
41933.2%
[
6.5%
-
7.0%
]
6.69%
1,13636.5%
[
6.5%
-
7.0%
]
6.78%
67837.2%
[
7.0%
-
7.5%
]
7.46%
3,16436.1%
[
7.5%
-
8.0%
]
7.88%
3,09623.8%
[
7.5%
-
8.0%
]
7.96%
11312.5%
[
8.0%
-
8.5%
]
8.43%
1,28154.2%
[
8.5%
-
9.0%
]
8.69%
2,09545.7%
[
9.5%
-
10.0%
]
9.76%
3,59629.6%
[
10.5%
-
11.0%
]
10.80%
2873.7%
[
23.0%
-
23.5%
]
23.16%
99316.6%
[
25.0%
-
25.5%
]
25.00%
2565.4%