Luxembourger Unemployment Among Women with Children Ages 6 to 17 years
COMPARE
Luxembourger
Select to Compare
Unemployment Among Women with Children Ages 6 to 17 years
Luxembourger Unemployment Among Women with Children Ages 6 to 17 years
8.3%
UNEMPLOYMENT | WOMEN W/ CHILDREN 6 TO 17
99.9/ 100
METRIC RATING
66th/ 347
METRIC RANK
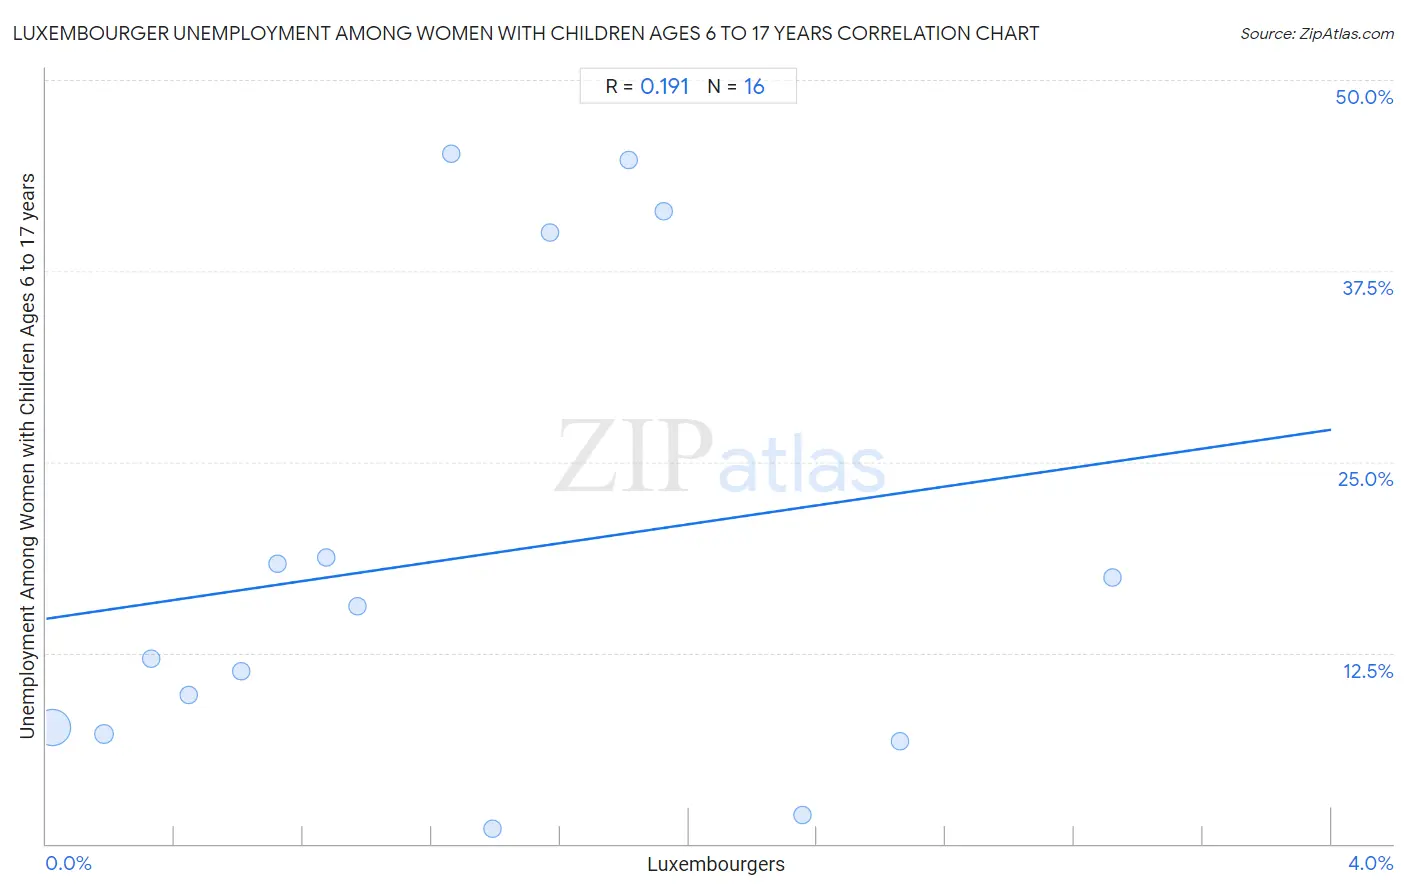
Luxembourger Unemployment Among Women with Children Ages 6 to 17 years Correlation Chart
The statistical analysis conducted on geographies consisting of 115,314,125 people shows a poor positive correlation between the proportion of Luxembourgers and unemployment rate among women with children between the ages 6 and 17 in the United States with a correlation coefficient (R) of 0.191 and weighted average of 8.3%. On average, for every 1% (one percent) increase in Luxembourgers within a typical geography, there is an increase of 3.1% in unemployment rate among women with children between the ages 6 and 17.
It is essential to understand that the correlation between the percentage of Luxembourgers and unemployment rate among women with children between the ages 6 and 17 does not imply a direct cause-and-effect relationship. It remains uncertain whether the presence of Luxembourgers influences an upward or downward trend in the level of unemployment rate among women with children between the ages 6 and 17 within an area, or if Luxembourgers simply ended up residing in those areas with higher or lower levels of unemployment rate among women with children between the ages 6 and 17 due to other factors.
Demographics Similar to Luxembourgers by Unemployment Among Women with Children Ages 6 to 17 years
In terms of unemployment among women with children ages 6 to 17 years, the demographic groups most similar to Luxembourgers are Armenian (8.3%, a difference of 0.10%), Immigrants from Albania (8.3%, a difference of 0.13%), Marshallese (8.3%, a difference of 0.18%), Immigrants from Thailand (8.3%, a difference of 0.21%), and Immigrants from Kuwait (8.3%, a difference of 0.22%).
| Demographics | Rating | Rank | Unemployment Among Women with Children Ages 6 to 17 years |
| Immigrants from Philippines | 100.0 /100 | #59 | Exceptional 8.2% |
| Basques | 100.0 /100 | #60 | Exceptional 8.2% |
| Koreans | 100.0 /100 | #61 | Exceptional 8.2% |
| Spanish American Indians | 100.0 /100 | #62 | Exceptional 8.2% |
| Immigrants from South Eastern Asia | 99.9 /100 | #63 | Exceptional 8.2% |
| Immigrants from Kuwait | 99.9 /100 | #64 | Exceptional 8.3% |
| Immigrants from Albania | 99.9 /100 | #65 | Exceptional 8.3% |
| Luxembourgers | 99.9 /100 | #66 | Exceptional 8.3% |
| Armenians | 99.9 /100 | #67 | Exceptional 8.3% |
| Marshallese | 99.9 /100 | #68 | Exceptional 8.3% |
| Immigrants from Thailand | 99.9 /100 | #69 | Exceptional 8.3% |
| Norwegians | 99.9 /100 | #70 | Exceptional 8.3% |
| Immigrants from Australia | 99.8 /100 | #71 | Exceptional 8.3% |
| Immigrants from Nepal | 99.8 /100 | #72 | Exceptional 8.3% |
| Spanish Americans | 99.8 /100 | #73 | Exceptional 8.4% |
Luxembourger Unemployment Among Women with Children Ages 6 to 17 years Correlation Summary
| Measurement | Luxembourger Data | Unemployment Among Women with Children Ages 6 to 17 years Data |
| Minimum | 0.021% | 0.97% |
| Maximum | 3.3% | 45.2% |
| Range | 3.3% | 44.2% |
| Mean | 1.3% | 18.7% |
| Median | 1.1% | 13.9% |
| Interquartile 25% (IQ1) | 0.52% | 7.4% |
| Interquartile 75% (IQ3) | 1.9% | 29.4% |
| Interquartile Range (IQR) | 1.3% | 21.9% |
| Standard Deviation (Sample) | 0.95% | 15.4% |
| Standard Deviation (Population) | 0.92% | 14.9% |
Correlation Details
| Luxembourger Percentile | Sample Size | Unemployment Among Women with Children Ages 6 to 17 years |
[ 0.0% - 0.5% ] 0.021% | 109,850,549 | 7.6% |
[ 0.0% - 0.5% ] 0.18% | 4,136,020 | 7.2% |
[ 0.0% - 0.5% ] 0.33% | 685,063 | 12.1% |
[ 0.0% - 0.5% ] 0.44% | 270,386 | 9.7% |
[ 0.5% - 1.0% ] 0.61% | 133,017 | 11.3% |
[ 0.5% - 1.0% ] 0.72% | 53,958 | 18.3% |
[ 0.5% - 1.0% ] 0.87% | 29,699 | 18.7% |
[ 0.5% - 1.0% ] 0.97% | 8,041 | 15.6% |
[ 1.0% - 1.5% ] 1.26% | 9,514 | 45.2% |
[ 1.0% - 1.5% ] 1.39% | 102,210 | 0.97% |
[ 1.5% - 2.0% ] 1.57% | 8,154 | 40.0% |
[ 1.5% - 2.0% ] 1.81% | 8,654 | 44.8% |
[ 1.5% - 2.0% ] 1.92% | 1,768 | 41.4% |
[ 2.0% - 2.5% ] 2.35% | 13,343 | 1.9% |
[ 2.5% - 3.0% ] 2.66% | 2,031 | 6.7% |
[ 3.0% - 3.5% ] 3.32% | 1,718 | 17.4% |