Luxembourger Self-Care Disability
COMPARE
Luxembourger
Select to Compare
Self-Care Disability
Luxembourger Self-Care Disability
2.2%
SELF-CARE DISABILITY
100.0/ 100
METRIC RATING
14th/ 347
METRIC RANK
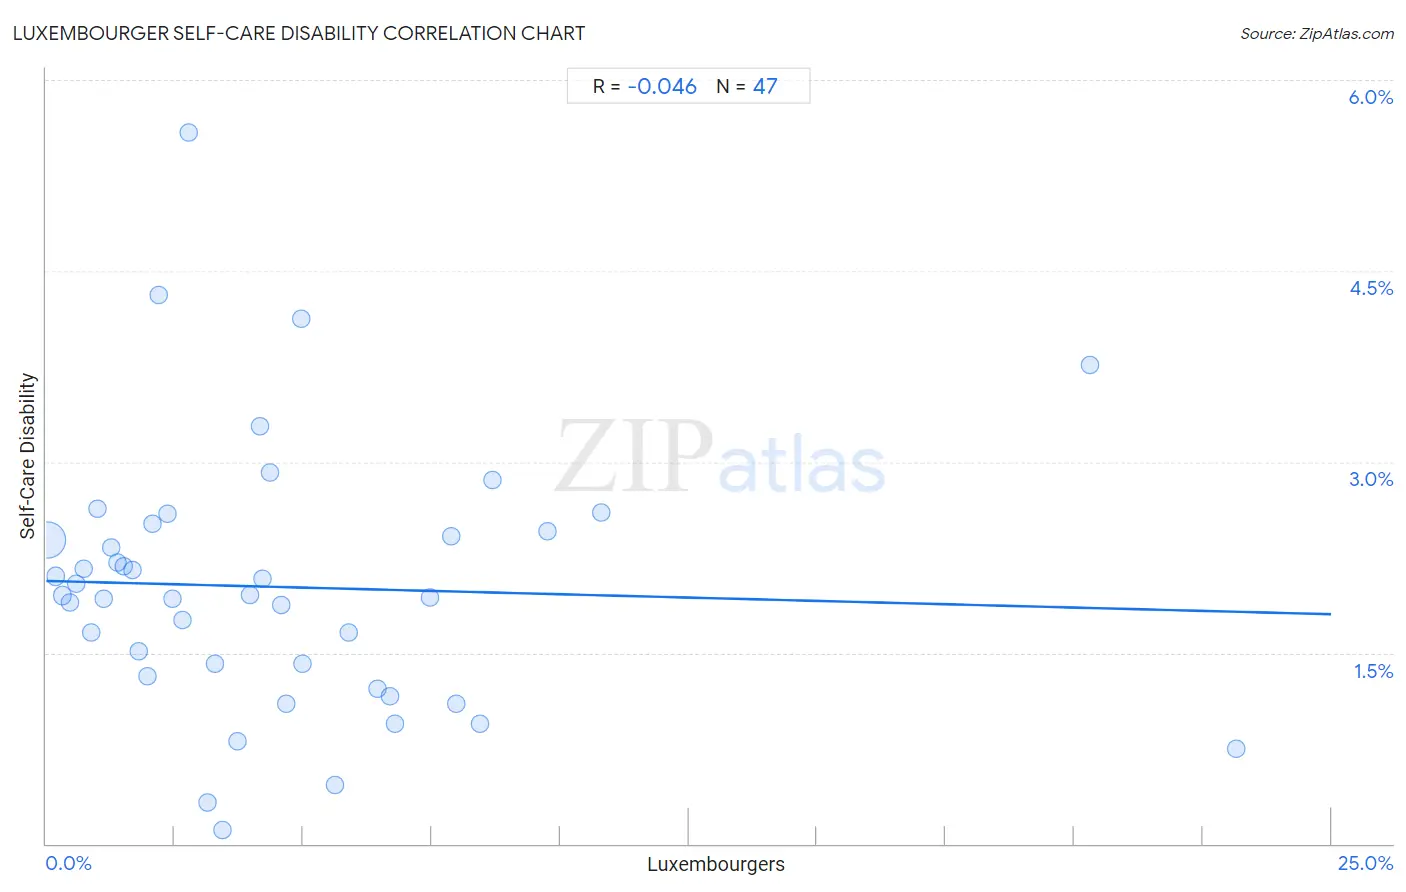
Luxembourger Self-Care Disability Correlation Chart
The statistical analysis conducted on geographies consisting of 144,609,683 people shows no correlation between the proportion of Luxembourgers and percentage of population with self-care disability in the United States with a correlation coefficient (R) of -0.046 and weighted average of 2.2%. On average, for every 1% (one percent) increase in Luxembourgers within a typical geography, there is a decrease of 0.010% in percentage of population with self-care disability.
It is essential to understand that the correlation between the percentage of Luxembourgers and percentage of population with self-care disability does not imply a direct cause-and-effect relationship. It remains uncertain whether the presence of Luxembourgers influences an upward or downward trend in the level of percentage of population with self-care disability within an area, or if Luxembourgers simply ended up residing in those areas with higher or lower levels of percentage of population with self-care disability due to other factors.
Demographics Similar to Luxembourgers by Self-Care Disability
In terms of self-care disability, the demographic groups most similar to Luxembourgers are Okinawan (2.2%, a difference of 0.010%), Ethiopian (2.2%, a difference of 0.16%), Immigrants from Ethiopia (2.2%, a difference of 0.17%), Immigrants from South Central Asia (2.2%, a difference of 0.23%), and Immigrants from Kuwait (2.2%, a difference of 0.29%).
| Demographics | Rating | Rank | Self-Care Disability |
| Immigrants from Bolivia | 100.0 /100 | #7 | Exceptional 2.2% |
| Bolivians | 100.0 /100 | #8 | Exceptional 2.2% |
| Immigrants from Nepal | 100.0 /100 | #9 | Exceptional 2.2% |
| Sudanese | 100.0 /100 | #10 | Exceptional 2.2% |
| Immigrants from South Central Asia | 100.0 /100 | #11 | Exceptional 2.2% |
| Immigrants from Ethiopia | 100.0 /100 | #12 | Exceptional 2.2% |
| Ethiopians | 100.0 /100 | #13 | Exceptional 2.2% |
| Luxembourgers | 100.0 /100 | #14 | Exceptional 2.2% |
| Okinawans | 100.0 /100 | #15 | Exceptional 2.2% |
| Immigrants from Kuwait | 100.0 /100 | #16 | Exceptional 2.2% |
| Immigrants from Saudi Arabia | 100.0 /100 | #17 | Exceptional 2.2% |
| Immigrants from Taiwan | 100.0 /100 | #18 | Exceptional 2.2% |
| Immigrants from Eritrea | 100.0 /100 | #19 | Exceptional 2.2% |
| Tongans | 100.0 /100 | #20 | Exceptional 2.2% |
| Bulgarians | 100.0 /100 | #21 | Exceptional 2.2% |
Luxembourger Self-Care Disability Correlation Summary
| Measurement | Luxembourger Data | Self-Care Disability Data |
| Minimum | 0.026% | 0.11% |
| Maximum | 23.2% | 5.6% |
| Range | 23.1% | 5.5% |
| Mean | 4.6% | 2.0% |
| Median | 3.4% | 1.9% |
| Interquartile 25% (IQ1) | 1.5% | 1.3% |
| Interquartile 75% (IQ3) | 6.4% | 2.5% |
| Interquartile Range (IQR) | 4.9% | 1.1% |
| Standard Deviation (Sample) | 4.6% | 1.0% |
| Standard Deviation (Population) | 4.5% | 1.0% |
Correlation Details
| Luxembourger Percentile | Sample Size | Self-Care Disability |
[ 0.0% - 0.5% ] 0.026% | 133,155,547 | 2.4% |
[ 0.0% - 0.5% ] 0.18% | 7,621,240 | 2.1% |
[ 0.0% - 0.5% ] 0.32% | 1,623,212 | 1.9% |
[ 0.0% - 0.5% ] 0.46% | 868,759 | 1.9% |
[ 0.5% - 1.0% ] 0.59% | 426,343 | 2.0% |
[ 0.5% - 1.0% ] 0.72% | 209,996 | 2.2% |
[ 0.5% - 1.0% ] 0.88% | 173,545 | 1.7% |
[ 1.0% - 1.5% ] 1.01% | 89,100 | 2.6% |
[ 1.0% - 1.5% ] 1.12% | 52,023 | 1.9% |
[ 1.0% - 1.5% ] 1.27% | 44,746 | 2.3% |
[ 1.0% - 1.5% ] 1.39% | 108,187 | 2.2% |
[ 1.5% - 2.0% ] 1.51% | 34,998 | 2.2% |
[ 1.5% - 2.0% ] 1.67% | 13,015 | 2.1% |
[ 1.5% - 2.0% ] 1.81% | 70,995 | 1.5% |
[ 1.5% - 2.0% ] 1.96% | 9,803 | 1.3% |
[ 2.0% - 2.5% ] 2.06% | 19,686 | 2.5% |
[ 2.0% - 2.5% ] 2.20% | 7,919 | 4.3% |
[ 2.0% - 2.5% ] 2.35% | 16,573 | 2.6% |
[ 2.0% - 2.5% ] 2.45% | 4,777 | 1.9% |
[ 2.5% - 3.0% ] 2.66% | 3,426 | 1.8% |
[ 2.5% - 3.0% ] 2.77% | 253 | 5.6% |
[ 3.0% - 3.5% ] 3.13% | 1,981 | 0.33% |
[ 3.0% - 3.5% ] 3.27% | 6,481 | 1.4% |
[ 3.0% - 3.5% ] 3.44% | 960 | 0.11% |
[ 3.5% - 4.0% ] 3.73% | 2,575 | 0.81% |
[ 3.5% - 4.0% ] 3.98% | 5,156 | 2.0% |
[ 4.0% - 4.5% ] 4.16% | 529 | 3.3% |
[ 4.0% - 4.5% ] 4.20% | 2,902 | 2.1% |
[ 4.0% - 4.5% ] 4.36% | 4,907 | 2.9% |
[ 4.5% - 5.0% ] 4.56% | 2,499 | 1.9% |
[ 4.5% - 5.0% ] 4.67% | 749 | 1.1% |
[ 4.5% - 5.0% ] 4.95% | 101 | 4.1% |
[ 4.5% - 5.0% ] 4.99% | 3,805 | 1.4% |
[ 5.5% - 6.0% ] 5.63% | 462 | 0.47% |
[ 5.5% - 6.0% ] 5.88% | 5,442 | 1.7% |
[ 6.0% - 6.5% ] 6.44% | 419 | 1.2% |
[ 6.5% - 7.0% ] 6.69% | 1,136 | 1.2% |
[ 6.5% - 7.0% ] 6.78% | 678 | 0.94% |
[ 7.0% - 7.5% ] 7.46% | 3,164 | 1.9% |
[ 7.5% - 8.0% ] 7.88% | 3,096 | 2.4% |
[ 7.5% - 8.0% ] 7.96% | 113 | 1.1% |
[ 8.0% - 8.5% ] 8.43% | 1,281 | 0.94% |
[ 8.5% - 9.0% ] 8.69% | 2,095 | 2.9% |
[ 9.5% - 10.0% ] 9.76% | 3,596 | 2.5% |
[ 10.5% - 11.0% ] 10.80% | 287 | 2.6% |
[ 20.0% - 20.5% ] 20.30% | 133 | 3.8% |
[ 23.0% - 23.5% ] 23.16% | 993 | 0.74% |