Immigrants from Congo vs Fijian Married-Couple Family Poverty
COMPARE
Immigrants from Congo
Fijian
Married-Couple Family Poverty
Married-Couple Family Poverty Comparison
Immigrants from Congo
Fijians
6.1%
MARRIED-COUPLE FAMILY POVERTY
0.2/ 100
METRIC RATING
264th/ 347
METRIC RANK
5.8%
MARRIED-COUPLE FAMILY POVERTY
2.5/ 100
METRIC RATING
240th/ 347
METRIC RANK
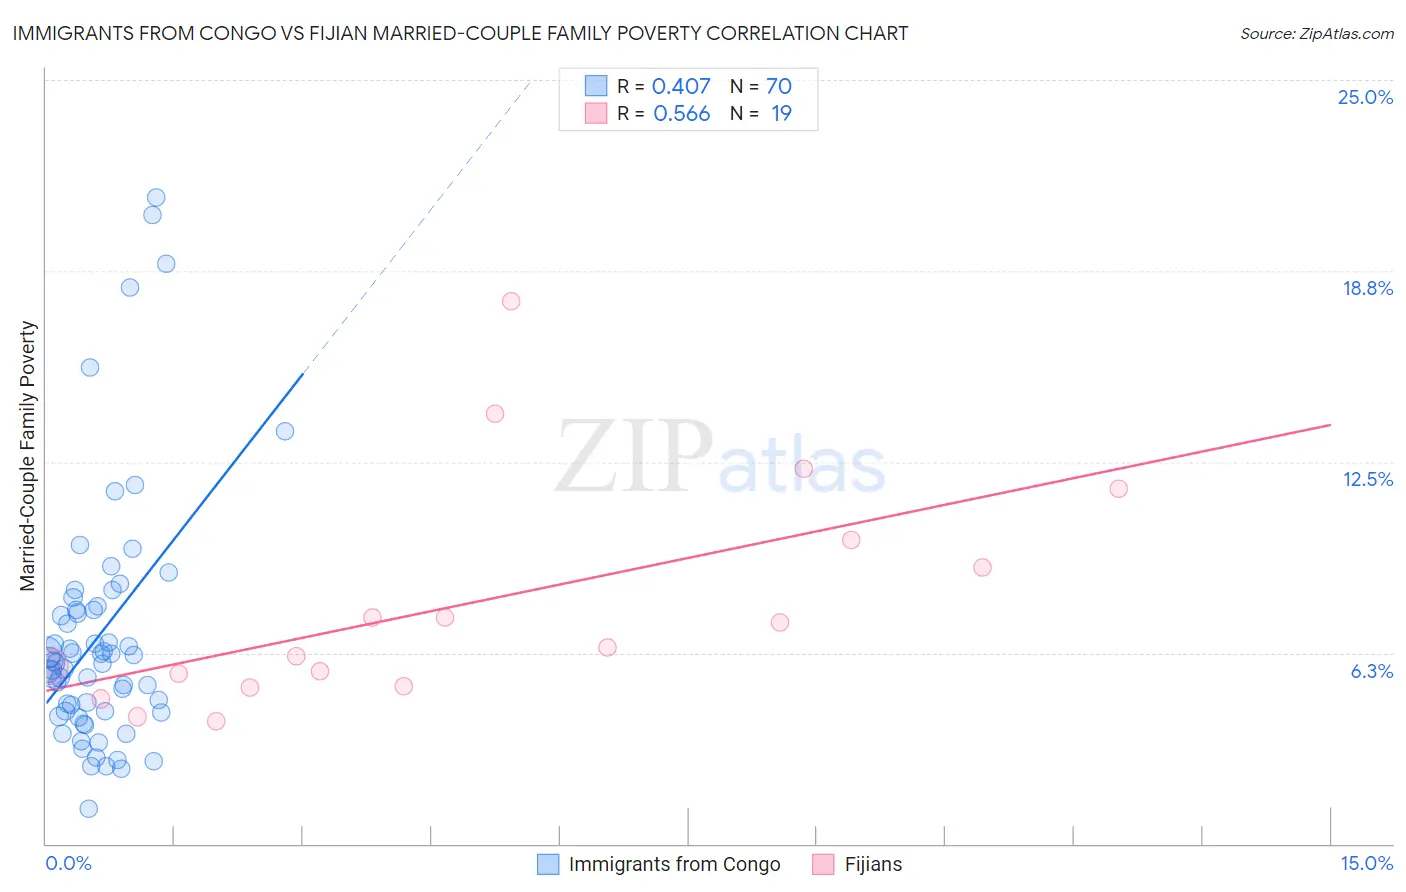
Immigrants from Congo vs Fijian Married-Couple Family Poverty Correlation Chart
The statistical analysis conducted on geographies consisting of 91,968,062 people shows a moderate positive correlation between the proportion of Immigrants from Congo and poverty level among married-couple families in the United States with a correlation coefficient (R) of 0.407 and weighted average of 6.1%. Similarly, the statistical analysis conducted on geographies consisting of 55,857,947 people shows a substantial positive correlation between the proportion of Fijians and poverty level among married-couple families in the United States with a correlation coefficient (R) of 0.566 and weighted average of 5.8%, a difference of 6.3%.
Married-Couple Family Poverty Correlation Summary
| Measurement | Immigrants from Congo | Fijian |
| Minimum | 1.1% | 4.0% |
| Maximum | 21.1% | 17.8% |
| Range | 20.0% | 13.8% |
| Mean | 6.8% | 7.9% |
| Median | 6.0% | 6.4% |
| Interquartile 25% (IQ1) | 4.3% | 5.2% |
| Interquartile 75% (IQ3) | 7.7% | 10.0% |
| Interquartile Range (IQR) | 3.3% | 4.8% |
| Standard Deviation (Sample) | 4.1% | 3.7% |
| Standard Deviation (Population) | 4.1% | 3.6% |
Similar Demographics by Married-Couple Family Poverty
Demographics Similar to Immigrants from Congo by Married-Couple Family Poverty
In terms of married-couple family poverty, the demographic groups most similar to Immigrants from Congo are Immigrants from Senegal (6.1%, a difference of 0.22%), Blackfeet (6.2%, a difference of 0.43%), Creek (6.2%, a difference of 0.51%), Spanish American (6.2%, a difference of 0.56%), and Shoshone (6.1%, a difference of 0.62%).
| Demographics | Rating | Rank | Married-Couple Family Poverty |
| Immigrants | Burma/Myanmar | 0.5 /100 | #257 | Tragic 6.0% |
| Immigrants | Immigrants | 0.5 /100 | #258 | Tragic 6.0% |
| Alaskan Athabascans | 0.4 /100 | #259 | Tragic 6.1% |
| Jamaicans | 0.3 /100 | #260 | Tragic 6.1% |
| Senegalese | 0.3 /100 | #261 | Tragic 6.1% |
| Shoshone | 0.3 /100 | #262 | Tragic 6.1% |
| Immigrants | Senegal | 0.3 /100 | #263 | Tragic 6.1% |
| Immigrants | Congo | 0.2 /100 | #264 | Tragic 6.1% |
| Blackfeet | 0.2 /100 | #265 | Tragic 6.2% |
| Creek | 0.2 /100 | #266 | Tragic 6.2% |
| Spanish Americans | 0.2 /100 | #267 | Tragic 6.2% |
| Alaska Natives | 0.2 /100 | #268 | Tragic 6.2% |
| Immigrants | West Indies | 0.1 /100 | #269 | Tragic 6.2% |
| Immigrants | Jamaica | 0.1 /100 | #270 | Tragic 6.2% |
| Immigrants | Bahamas | 0.1 /100 | #271 | Tragic 6.2% |
Demographics Similar to Fijians by Married-Couple Family Poverty
In terms of married-couple family poverty, the demographic groups most similar to Fijians are Immigrants from Panama (5.8%, a difference of 0.020%), Immigrants from Western Africa (5.8%, a difference of 0.11%), Venezuelan (5.8%, a difference of 0.17%), Cherokee (5.8%, a difference of 0.19%), and Somali (5.8%, a difference of 0.27%).
| Demographics | Rating | Rank | Married-Couple Family Poverty |
| Immigrants | Colombia | 3.7 /100 | #233 | Tragic 5.7% |
| Immigrants | Uruguay | 3.7 /100 | #234 | Tragic 5.7% |
| Immigrants | Sudan | 3.5 /100 | #235 | Tragic 5.7% |
| Ghanaians | 3.3 /100 | #236 | Tragic 5.7% |
| Immigrants | South America | 3.1 /100 | #237 | Tragic 5.7% |
| Cherokee | 2.7 /100 | #238 | Tragic 5.8% |
| Venezuelans | 2.7 /100 | #239 | Tragic 5.8% |
| Fijians | 2.5 /100 | #240 | Tragic 5.8% |
| Immigrants | Panama | 2.5 /100 | #241 | Tragic 5.8% |
| Immigrants | Western Africa | 2.4 /100 | #242 | Tragic 5.8% |
| Somalis | 2.3 /100 | #243 | Tragic 5.8% |
| Chickasaw | 2.3 /100 | #244 | Tragic 5.8% |
| Immigrants | Afghanistan | 2.1 /100 | #245 | Tragic 5.8% |
| Immigrants | Venezuela | 1.8 /100 | #246 | Tragic 5.8% |
| Iraqis | 1.4 /100 | #247 | Tragic 5.9% |