Ecuadorian Female Disability
COMPARE
Ecuadorian
Select to Compare
Female Disability
Ecuadorian Female Disability
11.9%
DISABILITY | FEMALES
93.4/ 100
METRIC RATING
138th/ 347
METRIC RANK
Ecuadorian Female Disability Correlation Chart
The statistical analysis conducted on geographies consisting of 317,804,285 people shows a poor negative correlation between the proportion of Ecuadorians and percentage of females with a disability in the United States with a correlation coefficient (R) of -0.152 and weighted average of 11.9%. On average, for every 1% (one percent) increase in Ecuadorians within a typical geography, there is a decrease of 0.056% in percentage of females with a disability.
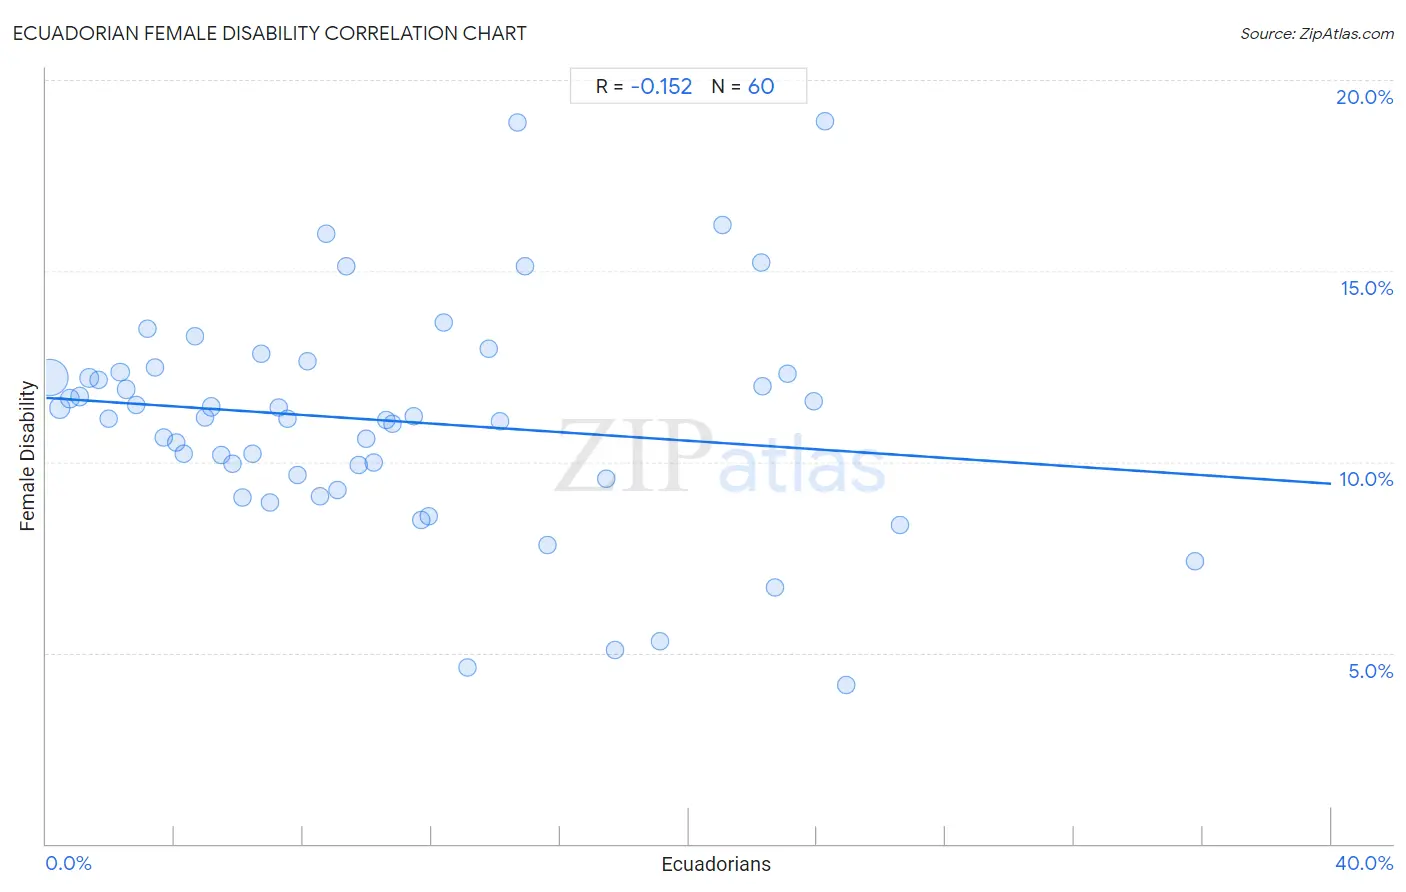
It is essential to understand that the correlation between the percentage of Ecuadorians and percentage of females with a disability does not imply a direct cause-and-effect relationship. It remains uncertain whether the presence of Ecuadorians influences an upward or downward trend in the level of percentage of females with a disability within an area, or if Ecuadorians simply ended up residing in those areas with higher or lower levels of percentage of females with a disability due to other factors.
Demographics Similar to Ecuadorians by Female Disability
In terms of female disability, the demographic groups most similar to Ecuadorians are Immigrants from Norway (11.9%, a difference of 0.060%), Immigrants from Hungary (11.9%, a difference of 0.090%), Ugandan (11.9%, a difference of 0.10%), Central American (11.9%, a difference of 0.12%), and Kenyan (11.9%, a difference of 0.19%).
| Demographics | Rating | Rank | Female Disability |
| Arabs | 95.1 /100 | #131 | Exceptional 11.9% |
| Immigrants from Syria | 94.6 /100 | #132 | Exceptional 11.9% |
| Kenyans | 94.5 /100 | #133 | Exceptional 11.9% |
| Immigrants from Nicaragua | 94.5 /100 | #134 | Exceptional 11.9% |
| Central Americans | 94.2 /100 | #135 | Exceptional 11.9% |
| Ugandans | 94.0 /100 | #136 | Exceptional 11.9% |
| Immigrants from Norway | 93.8 /100 | #137 | Exceptional 11.9% |
| Ecuadorians | 93.4 /100 | #138 | Exceptional 11.9% |
| Immigrants from Hungary | 92.8 /100 | #139 | Exceptional 11.9% |
| Romanians | 91.6 /100 | #140 | Exceptional 11.9% |
| Immigrants from Ecuador | 91.5 /100 | #141 | Exceptional 11.9% |
| Immigrants from Africa | 90.0 /100 | #142 | Excellent 11.9% |
| Immigrants from Sudan | 89.6 /100 | #143 | Excellent 11.9% |
| Immigrants from Austria | 87.9 /100 | #144 | Excellent 12.0% |
| Estonians | 87.8 /100 | #145 | Excellent 12.0% |
Ecuadorian Female Disability Correlation Summary
| Measurement | Ecuadorian Data | Female Disability Data |
| Minimum | 0.10% | 4.2% |
| Maximum | 35.8% | 18.9% |
| Range | 35.7% | 14.7% |
| Mean | 10.6% | 11.1% |
| Median | 8.9% | 11.2% |
| Interquartile 25% (IQ1) | 4.5% | 9.6% |
| Interquartile 75% (IQ3) | 14.8% | 12.3% |
| Interquartile Range (IQR) | 10.3% | 2.7% |
| Standard Deviation (Sample) | 8.0% | 2.9% |
| Standard Deviation (Population) | 7.9% | 2.9% |
Correlation Details
| Ecuadorian Percentile | Sample Size | Female Disability |
[ 0.0% - 0.5% ] 0.10% | 225,932,093 | 12.2% |
[ 0.0% - 0.5% ] 0.42% | 35,442,412 | 11.4% |
[ 0.5% - 1.0% ] 0.74% | 18,235,609 | 11.7% |
[ 1.0% - 1.5% ] 1.03% | 7,929,214 | 11.7% |
[ 1.0% - 1.5% ] 1.33% | 4,841,795 | 12.2% |
[ 1.5% - 2.0% ] 1.64% | 3,863,454 | 12.1% |
[ 1.5% - 2.0% ] 1.93% | 1,926,871 | 11.1% |
[ 2.0% - 2.5% ] 2.29% | 10,139,482 | 12.3% |
[ 2.0% - 2.5% ] 2.49% | 1,888,677 | 11.9% |
[ 2.5% - 3.0% ] 2.82% | 1,070,403 | 11.5% |
[ 3.0% - 3.5% ] 3.16% | 1,010,391 | 13.5% |
[ 3.0% - 3.5% ] 3.39% | 701,516 | 12.5% |
[ 3.5% - 4.0% ] 3.68% | 275,994 | 10.6% |
[ 4.0% - 4.5% ] 4.04% | 209,404 | 10.5% |
[ 4.0% - 4.5% ] 4.28% | 370,549 | 10.2% |
[ 4.5% - 5.0% ] 4.62% | 297,502 | 13.3% |
[ 4.5% - 5.0% ] 4.94% | 76,880 | 11.2% |
[ 5.0% - 5.5% ] 5.12% | 295,399 | 11.4% |
[ 5.0% - 5.5% ] 5.45% | 98,704 | 10.2% |
[ 5.5% - 6.0% ] 5.79% | 75,504 | 10.0% |
[ 6.0% - 6.5% ] 6.10% | 159,101 | 9.1% |
[ 6.0% - 6.5% ] 6.41% | 105,683 | 10.2% |
[ 6.5% - 7.0% ] 6.71% | 199,062 | 12.8% |
[ 6.5% - 7.0% ] 6.97% | 101,959 | 8.9% |
[ 7.0% - 7.5% ] 7.25% | 222,817 | 11.4% |
[ 7.5% - 8.0% ] 7.52% | 182,213 | 11.1% |
[ 7.5% - 8.0% ] 7.83% | 150,353 | 9.6% |
[ 8.0% - 8.5% ] 8.12% | 107,043 | 12.6% |
[ 8.5% - 9.0% ] 8.53% | 156,526 | 9.1% |
[ 8.5% - 9.0% ] 8.72% | 334,815 | 16.0% |
[ 9.0% - 9.5% ] 9.07% | 31,554 | 9.3% |
[ 9.0% - 9.5% ] 9.34% | 12,343 | 15.1% |
[ 9.5% - 10.0% ] 9.74% | 51,505 | 9.9% |
[ 9.5% - 10.0% ] 9.96% | 227,148 | 10.6% |
[ 10.0% - 10.5% ] 10.20% | 32,963 | 10.0% |
[ 10.5% - 11.0% ] 10.58% | 91,516 | 11.1% |
[ 10.5% - 11.0% ] 10.78% | 86,456 | 11.0% |
[ 11.0% - 11.5% ] 11.43% | 22,800 | 11.2% |
[ 11.5% - 12.0% ] 11.65% | 127,356 | 8.5% |
[ 11.5% - 12.0% ] 11.90% | 112,396 | 8.6% |
[ 12.0% - 12.5% ] 12.37% | 100,539 | 13.6% |
[ 13.0% - 13.5% ] 13.11% | 9,606 | 4.6% |
[ 13.5% - 14.0% ] 13.78% | 112,299 | 13.0% |
[ 14.0% - 14.5% ] 14.12% | 70,524 | 11.1% |
[ 14.5% - 15.0% ] 14.65% | 42,547 | 18.9% |
[ 14.5% - 15.0% ] 14.89% | 27,708 | 15.1% |
[ 15.5% - 16.0% ] 15.59% | 9,126 | 7.8% |
[ 17.0% - 17.5% ] 17.43% | 11,777 | 9.6% |
[ 17.5% - 18.0% ] 17.72% | 1,078 | 5.1% |
[ 19.0% - 19.5% ] 19.11% | 21,040 | 5.3% |
[ 21.0% - 21.5% ] 21.04% | 1,231 | 16.2% |
[ 22.0% - 22.5% ] 22.25% | 5,946 | 15.2% |
[ 22.0% - 22.5% ] 22.28% | 1,077 | 12.0% |
[ 22.5% - 23.0% ] 22.68% | 5,587 | 6.7% |
[ 23.0% - 23.5% ] 23.08% | 1,005 | 12.3% |
[ 23.5% - 24.0% ] 23.90% | 112,750 | 11.6% |
[ 24.0% - 24.5% ] 24.24% | 56,696 | 18.9% |
[ 24.5% - 25.0% ] 24.90% | 9,162 | 4.2% |
[ 26.5% - 27.0% ] 26.59% | 4,407 | 8.3% |
[ 35.5% - 36.0% ] 35.76% | 2,718 | 7.4% |