Ecuadorian vs Immigrants from Northern Africa Married-Couple Family Poverty
COMPARE
Ecuadorian
Immigrants from Northern Africa
Married-Couple Family Poverty
Married-Couple Family Poverty Comparison
Ecuadorians
Immigrants from Northern Africa
6.5%
MARRIED-COUPLE FAMILY POVERTY
0.0/ 100
METRIC RATING
287th/ 347
METRIC RANK
5.2%
MARRIED-COUPLE FAMILY POVERTY
51.3/ 100
METRIC RATING
172nd/ 347
METRIC RANK
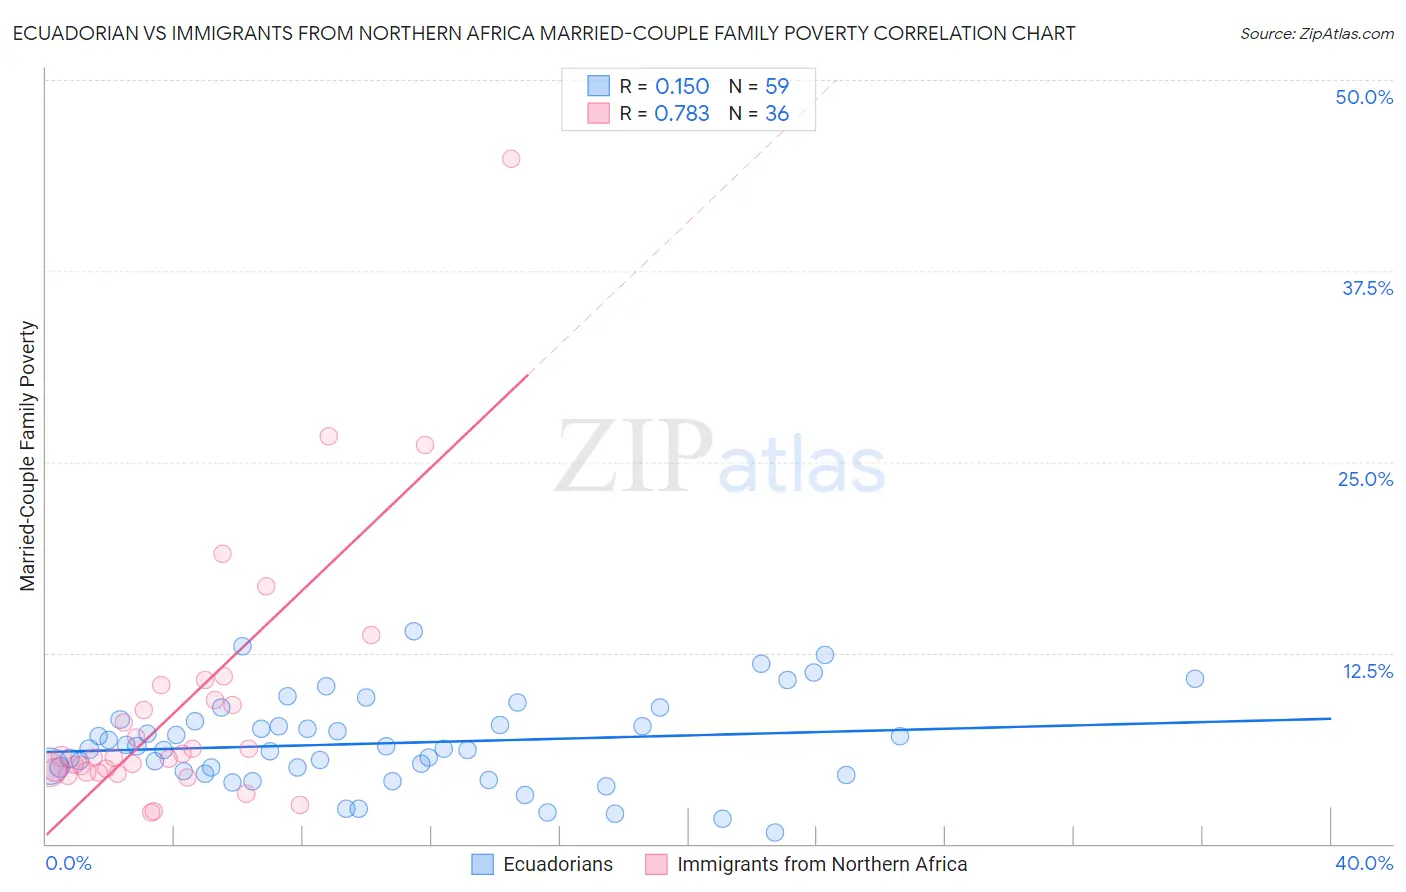
Ecuadorian vs Immigrants from Northern Africa Married-Couple Family Poverty Correlation Chart
The statistical analysis conducted on geographies consisting of 315,566,767 people shows a poor positive correlation between the proportion of Ecuadorians and poverty level among married-couple families in the United States with a correlation coefficient (R) of 0.150 and weighted average of 6.5%. Similarly, the statistical analysis conducted on geographies consisting of 319,156,358 people shows a strong positive correlation between the proportion of Immigrants from Northern Africa and poverty level among married-couple families in the United States with a correlation coefficient (R) of 0.783 and weighted average of 5.2%, a difference of 24.9%.
Married-Couple Family Poverty Correlation Summary
| Measurement | Ecuadorian | Immigrants from Northern Africa |
| Minimum | 0.76% | 2.0% |
| Maximum | 13.9% | 44.8% |
| Range | 13.2% | 42.8% |
| Mean | 6.6% | 9.0% |
| Median | 6.2% | 5.7% |
| Interquartile 25% (IQ1) | 4.8% | 4.8% |
| Interquartile 75% (IQ3) | 8.1% | 9.9% |
| Interquartile Range (IQR) | 3.3% | 5.2% |
| Standard Deviation (Sample) | 2.9% | 8.5% |
| Standard Deviation (Population) | 2.9% | 8.4% |
Similar Demographics by Married-Couple Family Poverty
Demographics Similar to Ecuadorians by Married-Couple Family Poverty
In terms of married-couple family poverty, the demographic groups most similar to Ecuadorians are Salvadoran (6.5%, a difference of 0.19%), Nepalese (6.5%, a difference of 0.36%), Guyanese (6.5%, a difference of 0.37%), Black/African American (6.5%, a difference of 0.47%), and Immigrants from Barbados (6.5%, a difference of 0.59%).
| Demographics | Rating | Rank | Married-Couple Family Poverty |
| West Indians | 0.0 /100 | #280 | Tragic 6.4% |
| Mexican American Indians | 0.0 /100 | #281 | Tragic 6.4% |
| Seminole | 0.0 /100 | #282 | Tragic 6.4% |
| Ute | 0.0 /100 | #283 | Tragic 6.4% |
| Dutch West Indians | 0.0 /100 | #284 | Tragic 6.4% |
| Blacks/African Americans | 0.0 /100 | #285 | Tragic 6.5% |
| Guyanese | 0.0 /100 | #286 | Tragic 6.5% |
| Ecuadorians | 0.0 /100 | #287 | Tragic 6.5% |
| Salvadorans | 0.0 /100 | #288 | Tragic 6.5% |
| Nepalese | 0.0 /100 | #289 | Tragic 6.5% |
| Immigrants | Barbados | 0.0 /100 | #290 | Tragic 6.5% |
| Belizeans | 0.0 /100 | #291 | Tragic 6.5% |
| Immigrants | Lebanon | 0.0 /100 | #292 | Tragic 6.6% |
| Arapaho | 0.0 /100 | #293 | Tragic 6.6% |
| Bahamians | 0.0 /100 | #294 | Tragic 6.6% |
Demographics Similar to Immigrants from Northern Africa by Married-Couple Family Poverty
In terms of married-couple family poverty, the demographic groups most similar to Immigrants from Northern Africa are Alsatian (5.2%, a difference of 0.020%), Immigrants from Eastern Africa (5.2%, a difference of 0.16%), Bermudan (5.2%, a difference of 0.18%), Immigrants from Argentina (5.2%, a difference of 0.35%), and Ottawa (5.2%, a difference of 0.37%).
| Demographics | Rating | Rank | Married-Couple Family Poverty |
| Immigrants | Malaysia | 62.2 /100 | #165 | Good 5.1% |
| Paraguayans | 61.5 /100 | #166 | Good 5.1% |
| Costa Ricans | 61.5 /100 | #167 | Good 5.1% |
| Immigrants | Uganda | 54.9 /100 | #168 | Average 5.2% |
| Ottawa | 54.5 /100 | #169 | Average 5.2% |
| Immigrants | Argentina | 54.4 /100 | #170 | Average 5.2% |
| Bermudans | 52.9 /100 | #171 | Average 5.2% |
| Immigrants | Northern Africa | 51.3 /100 | #172 | Average 5.2% |
| Alsatians | 51.2 /100 | #173 | Average 5.2% |
| Immigrants | Eastern Africa | 50.0 /100 | #174 | Average 5.2% |
| Marshallese | 47.9 /100 | #175 | Average 5.2% |
| Menominee | 47.8 /100 | #176 | Average 5.2% |
| Immigrants | Kazakhstan | 45.1 /100 | #177 | Average 5.2% |
| Immigrants | Ukraine | 44.9 /100 | #178 | Average 5.2% |
| Spanish | 41.4 /100 | #179 | Average 5.3% |