Ecuadorian vs South American Indian Married-Couple Family Poverty
COMPARE
Ecuadorian
South American Indian
Married-Couple Family Poverty
Married-Couple Family Poverty Comparison
Ecuadorians
South American Indians
6.5%
MARRIED-COUPLE FAMILY POVERTY
0.0/ 100
METRIC RATING
287th/ 347
METRIC RANK
5.3%
MARRIED-COUPLE FAMILY POVERTY
32.5/ 100
METRIC RATING
189th/ 347
METRIC RANK
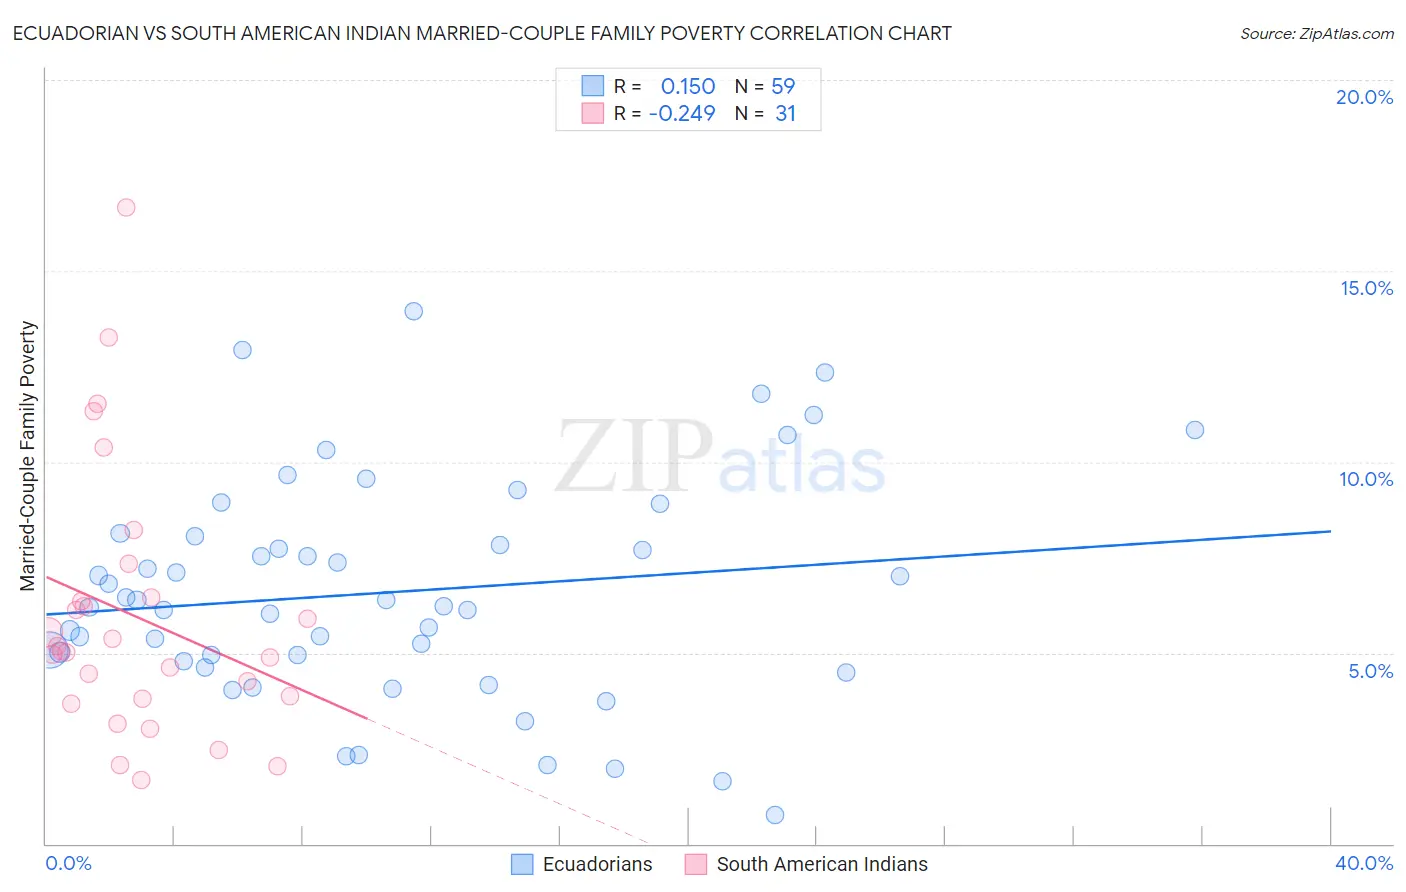
Ecuadorian vs South American Indian Married-Couple Family Poverty Correlation Chart
The statistical analysis conducted on geographies consisting of 315,566,767 people shows a poor positive correlation between the proportion of Ecuadorians and poverty level among married-couple families in the United States with a correlation coefficient (R) of 0.150 and weighted average of 6.5%. Similarly, the statistical analysis conducted on geographies consisting of 164,101,002 people shows a weak negative correlation between the proportion of South American Indians and poverty level among married-couple families in the United States with a correlation coefficient (R) of -0.249 and weighted average of 5.3%, a difference of 22.1%.
Married-Couple Family Poverty Correlation Summary
| Measurement | Ecuadorian | South American Indian |
| Minimum | 0.76% | 1.7% |
| Maximum | 13.9% | 16.7% |
| Range | 13.2% | 15.0% |
| Mean | 6.6% | 6.0% |
| Median | 6.2% | 5.0% |
| Interquartile 25% (IQ1) | 4.8% | 3.8% |
| Interquartile 75% (IQ3) | 8.1% | 6.5% |
| Interquartile Range (IQR) | 3.3% | 2.7% |
| Standard Deviation (Sample) | 2.9% | 3.5% |
| Standard Deviation (Population) | 2.9% | 3.4% |
Similar Demographics by Married-Couple Family Poverty
Demographics Similar to Ecuadorians by Married-Couple Family Poverty
In terms of married-couple family poverty, the demographic groups most similar to Ecuadorians are Salvadoran (6.5%, a difference of 0.19%), Nepalese (6.5%, a difference of 0.36%), Guyanese (6.5%, a difference of 0.37%), Black/African American (6.5%, a difference of 0.47%), and Immigrants from Barbados (6.5%, a difference of 0.59%).
| Demographics | Rating | Rank | Married-Couple Family Poverty |
| West Indians | 0.0 /100 | #280 | Tragic 6.4% |
| Mexican American Indians | 0.0 /100 | #281 | Tragic 6.4% |
| Seminole | 0.0 /100 | #282 | Tragic 6.4% |
| Ute | 0.0 /100 | #283 | Tragic 6.4% |
| Dutch West Indians | 0.0 /100 | #284 | Tragic 6.4% |
| Blacks/African Americans | 0.0 /100 | #285 | Tragic 6.5% |
| Guyanese | 0.0 /100 | #286 | Tragic 6.5% |
| Ecuadorians | 0.0 /100 | #287 | Tragic 6.5% |
| Salvadorans | 0.0 /100 | #288 | Tragic 6.5% |
| Nepalese | 0.0 /100 | #289 | Tragic 6.5% |
| Immigrants | Barbados | 0.0 /100 | #290 | Tragic 6.5% |
| Belizeans | 0.0 /100 | #291 | Tragic 6.5% |
| Immigrants | Lebanon | 0.0 /100 | #292 | Tragic 6.6% |
| Arapaho | 0.0 /100 | #293 | Tragic 6.6% |
| Bahamians | 0.0 /100 | #294 | Tragic 6.6% |
Demographics Similar to South American Indians by Married-Couple Family Poverty
In terms of married-couple family poverty, the demographic groups most similar to South American Indians are Israeli (5.3%, a difference of 0.090%), Ugandan (5.3%, a difference of 0.11%), Immigrants from Albania (5.3%, a difference of 0.18%), Immigrants from Cabo Verde (5.3%, a difference of 0.20%), and Cape Verdean (5.3%, a difference of 0.23%).
| Demographics | Rating | Rank | Married-Couple Family Poverty |
| Immigrants | Vietnam | 37.7 /100 | #182 | Fair 5.3% |
| Peruvians | 37.6 /100 | #183 | Fair 5.3% |
| Immigrants | Nonimmigrants | 35.8 /100 | #184 | Fair 5.3% |
| Americans | 35.4 /100 | #185 | Fair 5.3% |
| Hungarians | 34.7 /100 | #186 | Fair 5.3% |
| Immigrants | Albania | 33.8 /100 | #187 | Fair 5.3% |
| Israelis | 33.1 /100 | #188 | Fair 5.3% |
| South American Indians | 32.5 /100 | #189 | Fair 5.3% |
| Ugandans | 31.6 /100 | #190 | Fair 5.3% |
| Immigrants | Cabo Verde | 30.9 /100 | #191 | Fair 5.3% |
| Cape Verdeans | 30.7 /100 | #192 | Fair 5.3% |
| Malaysians | 29.5 /100 | #193 | Fair 5.4% |
| Immigrants | Israel | 27.8 /100 | #194 | Fair 5.4% |
| Immigrants | Azores | 27.5 /100 | #195 | Fair 5.4% |
| Spaniards | 27.4 /100 | #196 | Fair 5.4% |