Ecuadorian vs Dutch West Indian Married-Couple Family Poverty
COMPARE
Ecuadorian
Dutch West Indian
Married-Couple Family Poverty
Married-Couple Family Poverty Comparison
Ecuadorians
Dutch West Indians
6.5%
MARRIED-COUPLE FAMILY POVERTY
0.0/ 100
METRIC RATING
287th/ 347
METRIC RANK
6.4%
MARRIED-COUPLE FAMILY POVERTY
0.0/ 100
METRIC RATING
284th/ 347
METRIC RANK
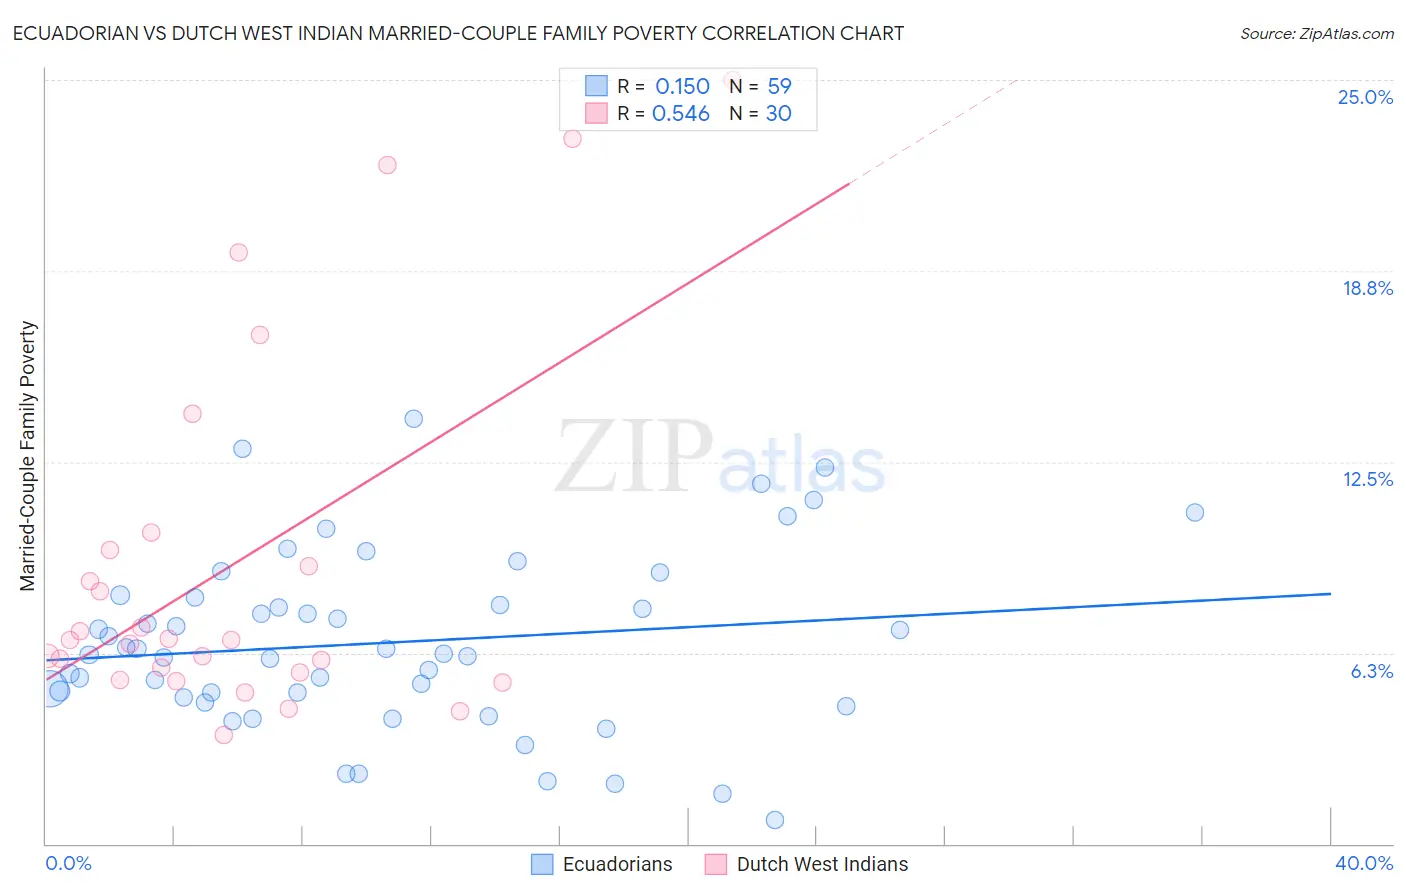
Ecuadorian vs Dutch West Indian Married-Couple Family Poverty Correlation Chart
The statistical analysis conducted on geographies consisting of 315,566,767 people shows a poor positive correlation between the proportion of Ecuadorians and poverty level among married-couple families in the United States with a correlation coefficient (R) of 0.150 and weighted average of 6.5%. Similarly, the statistical analysis conducted on geographies consisting of 85,614,682 people shows a substantial positive correlation between the proportion of Dutch West Indians and poverty level among married-couple families in the United States with a correlation coefficient (R) of 0.546 and weighted average of 6.4%, a difference of 0.99%.
Married-Couple Family Poverty Correlation Summary
| Measurement | Ecuadorian | Dutch West Indian |
| Minimum | 0.76% | 3.6% |
| Maximum | 13.9% | 25.0% |
| Range | 13.2% | 21.4% |
| Mean | 6.6% | 9.2% |
| Median | 6.2% | 6.7% |
| Interquartile 25% (IQ1) | 4.8% | 5.6% |
| Interquartile 75% (IQ3) | 8.1% | 9.6% |
| Interquartile Range (IQR) | 3.3% | 4.0% |
| Standard Deviation (Sample) | 2.9% | 6.0% |
| Standard Deviation (Population) | 2.9% | 5.9% |
Demographics Similar to Ecuadorians and Dutch West Indians by Married-Couple Family Poverty
In terms of married-couple family poverty, the demographic groups most similar to Ecuadorians are Salvadoran (6.5%, a difference of 0.19%), Nepalese (6.5%, a difference of 0.36%), Guyanese (6.5%, a difference of 0.37%), Black/African American (6.5%, a difference of 0.47%), and Immigrants from Barbados (6.5%, a difference of 0.59%). Similarly, the demographic groups most similar to Dutch West Indians are Ute (6.4%, a difference of 0.12%), Mexican American Indian (6.4%, a difference of 0.50%), Seminole (6.4%, a difference of 0.50%), Black/African American (6.5%, a difference of 0.51%), and Guyanese (6.5%, a difference of 0.61%).
| Demographics | Rating | Rank | Married-Couple Family Poverty |
| Choctaw | 0.1 /100 | #275 | Tragic 6.3% |
| Yaqui | 0.1 /100 | #276 | Tragic 6.3% |
| Indonesians | 0.1 /100 | #277 | Tragic 6.3% |
| Immigrants | Trinidad and Tobago | 0.1 /100 | #278 | Tragic 6.4% |
| Houma | 0.0 /100 | #279 | Tragic 6.4% |
| West Indians | 0.0 /100 | #280 | Tragic 6.4% |
| Mexican American Indians | 0.0 /100 | #281 | Tragic 6.4% |
| Seminole | 0.0 /100 | #282 | Tragic 6.4% |
| Ute | 0.0 /100 | #283 | Tragic 6.4% |
| Dutch West Indians | 0.0 /100 | #284 | Tragic 6.4% |
| Blacks/African Americans | 0.0 /100 | #285 | Tragic 6.5% |
| Guyanese | 0.0 /100 | #286 | Tragic 6.5% |
| Ecuadorians | 0.0 /100 | #287 | Tragic 6.5% |
| Salvadorans | 0.0 /100 | #288 | Tragic 6.5% |
| Nepalese | 0.0 /100 | #289 | Tragic 6.5% |
| Immigrants | Barbados | 0.0 /100 | #290 | Tragic 6.5% |
| Belizeans | 0.0 /100 | #291 | Tragic 6.5% |
| Immigrants | Lebanon | 0.0 /100 | #292 | Tragic 6.6% |
| Arapaho | 0.0 /100 | #293 | Tragic 6.6% |
| Bahamians | 0.0 /100 | #294 | Tragic 6.6% |
| Immigrants | Uzbekistan | 0.0 /100 | #295 | Tragic 6.6% |