Manderson, WY Map & Demographics
Manderson Map
Manderson Overview
$28,082
PER CAPITA INCOME
$48,000
AVG FAMILY INCOME
$43,438
AVG HOUSEHOLD INCOME
0.36
INEQUALITY / GINI INDEX
121
TOTAL POPULATION
53
MALE POPULATION
68
FEMALE POPULATION
77.94
MALES / 100 FEMALES
128.30
FEMALES / 100 MALES
51.7
MEDIAN AGE
2.7
AVG FAMILY SIZE
2.3
AVG HOUSEHOLD SIZE
84
LABOR FORCE [ PEOPLE ]
75.7%
PERCENT IN LABOR FORCE
1.2%
UNEMPLOYMENT RATE
Manderson Zip Codes
Manderson Area Codes
Income in Manderson
Income Overview in Manderson
Per Capita Income in Manderson is $28,082, while median incomes of families and households are $48,000 and $43,438 respectively.
| Characteristic | Number | Measure |
| Per Capita Income | 121 | $28,082 |
| Median Family Income | 32 | $48,000 |
| Mean Family Income | 32 | $71,184 |
| Median Household Income | 53 | $43,438 |
| Mean Household Income | 53 | $58,191 |
| Income Deficit | 32 | $0 |
| Wage / Income Gap (%) | 121 | 0.00% |
| Wage / Income Gap ($) | 121 | 100.00¢ per $1 |
| Gini / Inequality Index | 121 | 0.36 |
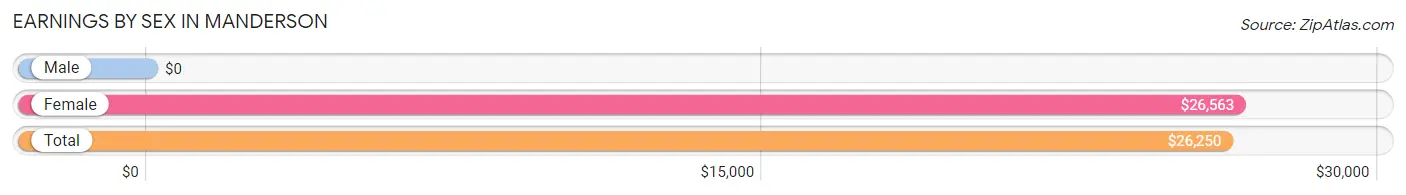
Earnings by Sex in Manderson
| Sex | Number | Average Earnings |
| Male | 27 (32.1%) | $0 |
| Female | 57 (67.9%) | $26,563 |
| Total | 84 (100.0%) | $26,250 |
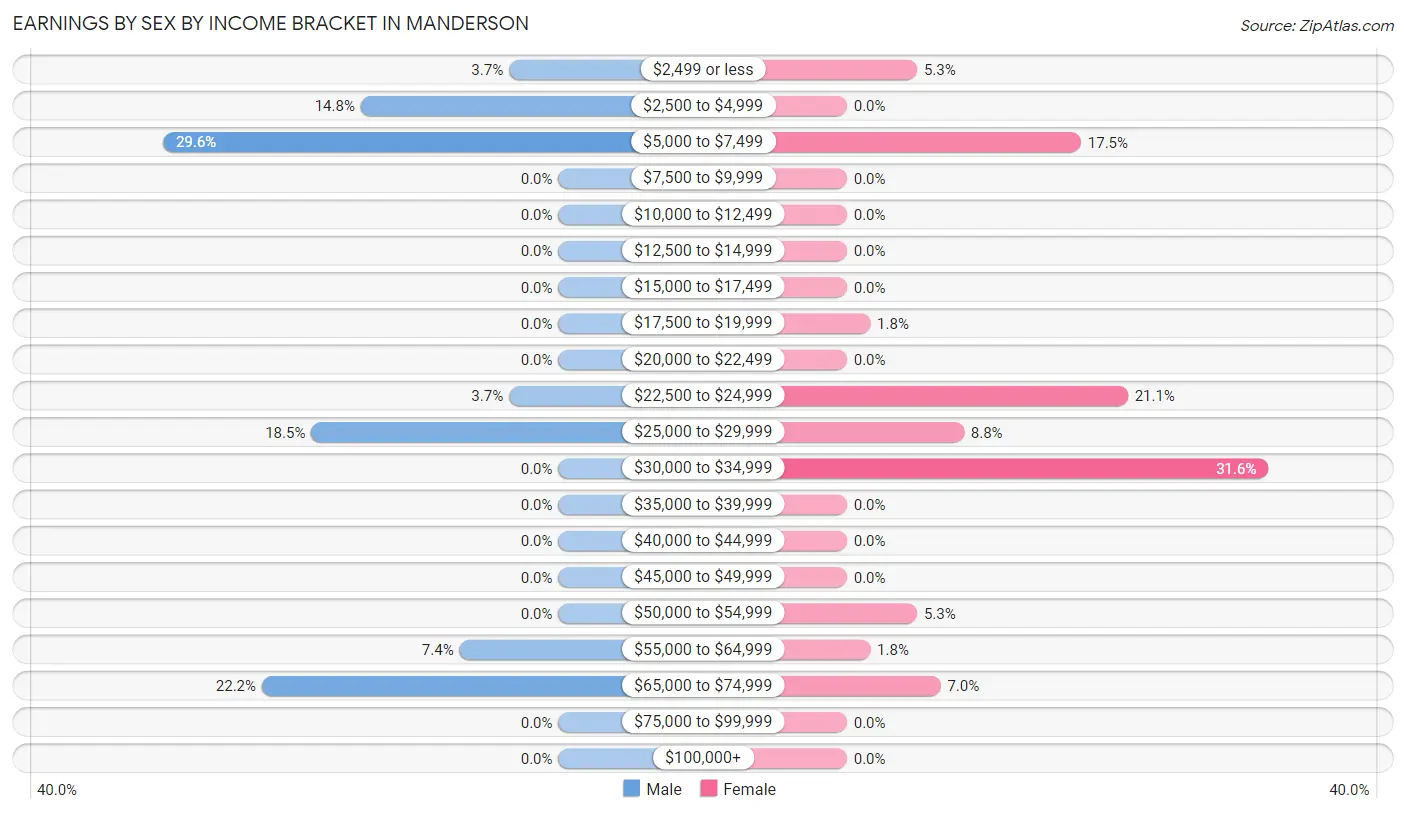
Earnings by Sex by Income Bracket in Manderson
The most common earnings brackets in Manderson are $5,000 to $7,499 for men (8 | 29.6%) and $30,000 to $34,999 for women (18 | 31.6%).
| Income | Male | Female |
| $2,499 or less | 1 (3.7%) | 3 (5.3%) |
| $2,500 to $4,999 | 4 (14.8%) | 0 (0.0%) |
| $5,000 to $7,499 | 8 (29.6%) | 10 (17.5%) |
| $7,500 to $9,999 | 0 (0.0%) | 0 (0.0%) |
| $10,000 to $12,499 | 0 (0.0%) | 0 (0.0%) |
| $12,500 to $14,999 | 0 (0.0%) | 0 (0.0%) |
| $15,000 to $17,499 | 0 (0.0%) | 0 (0.0%) |
| $17,500 to $19,999 | 0 (0.0%) | 1 (1.8%) |
| $20,000 to $22,499 | 0 (0.0%) | 0 (0.0%) |
| $22,500 to $24,999 | 1 (3.7%) | 12 (21.0%) |
| $25,000 to $29,999 | 5 (18.5%) | 5 (8.8%) |
| $30,000 to $34,999 | 0 (0.0%) | 18 (31.6%) |
| $35,000 to $39,999 | 0 (0.0%) | 0 (0.0%) |
| $40,000 to $44,999 | 0 (0.0%) | 0 (0.0%) |
| $45,000 to $49,999 | 0 (0.0%) | 0 (0.0%) |
| $50,000 to $54,999 | 0 (0.0%) | 3 (5.3%) |
| $55,000 to $64,999 | 2 (7.4%) | 1 (1.8%) |
| $65,000 to $74,999 | 6 (22.2%) | 4 (7.0%) |
| $75,000 to $99,999 | 0 (0.0%) | 0 (0.0%) |
| $100,000+ | 0 (0.0%) | 0 (0.0%) |
| Total | 27 (100.0%) | 57 (100.0%) |
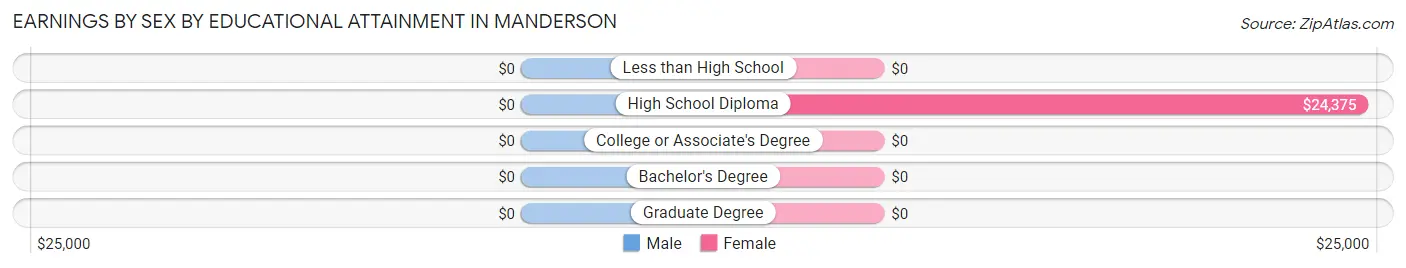
Earnings by Sex by Educational Attainment in Manderson
| Educational Attainment | Male Income | Female Income |
| Less than High School | - | - |
| High School Diploma | - | - |
| College or Associate's Degree | - | - |
| Bachelor's Degree | - | - |
| Graduate Degree | - | - |
| Total | - | - |
Family Income in Manderson
Family Income Brackets in Manderson
According to the Manderson family income data, there are 17 families falling into the $35,000 to $49,999 income range, which is the most common income bracket and makes up 53.1% of all families.
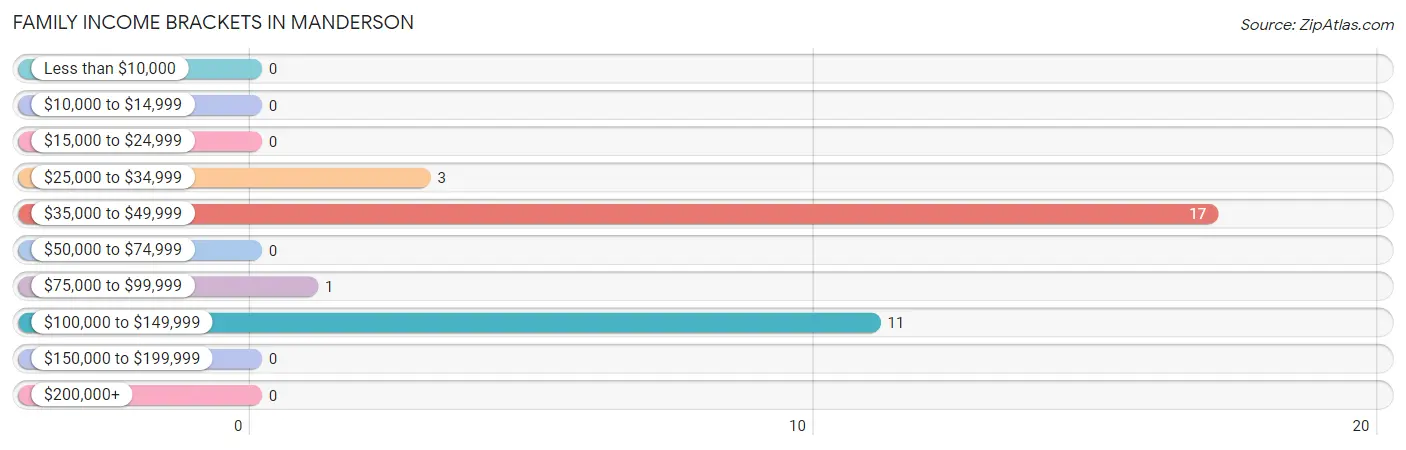
| Income Bracket | # Families | % Families |
| Less than $10,000 | 0 | 0.0% |
| $10,000 to $14,999 | 0 | 0.0% |
| $15,000 to $24,999 | 0 | 0.0% |
| $25,000 to $34,999 | 3 | 9.4% |
| $35,000 to $49,999 | 17 | 53.1% |
| $50,000 to $74,999 | 0 | 0.0% |
| $75,000 to $99,999 | 1 | 3.1% |
| $100,000 to $149,999 | 11 | 34.4% |
| $150,000 to $199,999 | 0 | 0.0% |
| $200,000+ | 0 | 0.0% |
Family Income by Famaliy Size in Manderson
2-person families (18 | 56.2%) account for the highest median family income in Manderson with $48,500 per family, while 2-person families (18 | 56.2%) have the highest median income of $24,250 per family member.
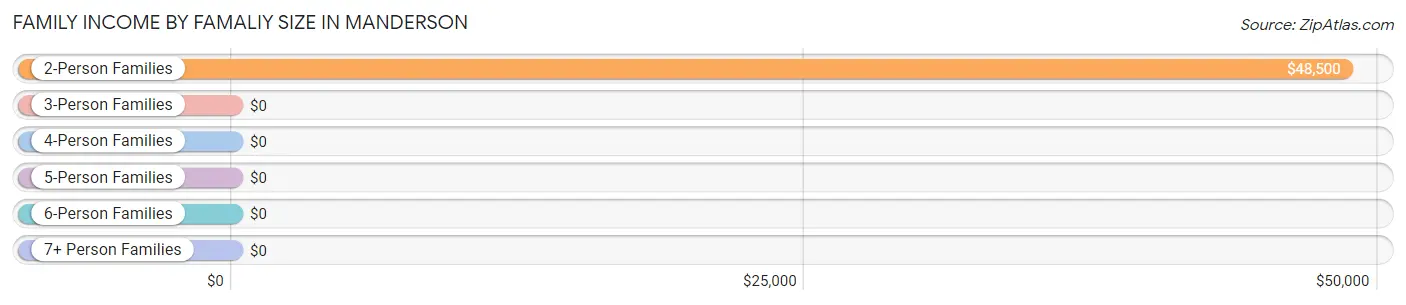
| Income Bracket | # Families | Median Income |
| 2-Person Families | 18 (56.2%) | $48,500 |
| 3-Person Families | 10 (31.2%) | $0 |
| 4-Person Families | 4 (12.5%) | $0 |
| 5-Person Families | 0 (0.0%) | $0 |
| 6-Person Families | 0 (0.0%) | $0 |
| 7+ Person Families | 0 (0.0%) | $0 |
| Total | 32 (100.0%) | $48,000 |
Family Income by Number of Earners in Manderson
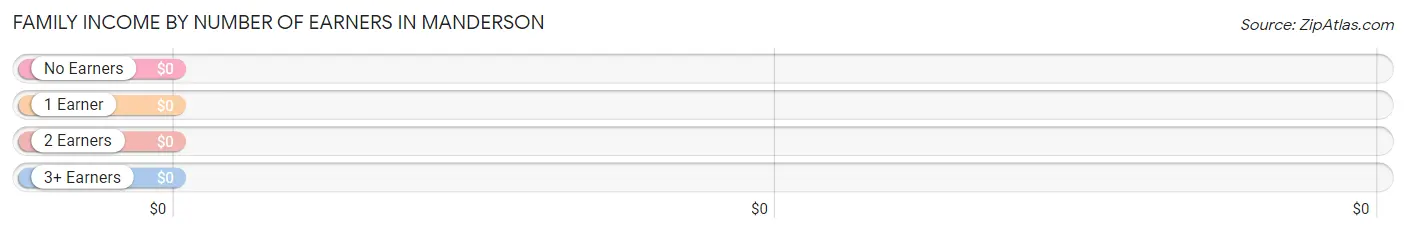
| Number of Earners | # Families | Median Income |
| No Earners | 3 (9.4%) | $0 |
| 1 Earner | 5 (15.6%) | $0 |
| 2 Earners | 18 (56.2%) | $0 |
| 3+ Earners | 6 (18.8%) | $0 |
| Total | 32 (100.0%) | $48,000 |
Household Income in Manderson
Household Income Brackets in Manderson
With 15 households falling in the category, the $25,000 to $34,999 income range is the most frequent in Manderson, accounting for 28.3% of all households.
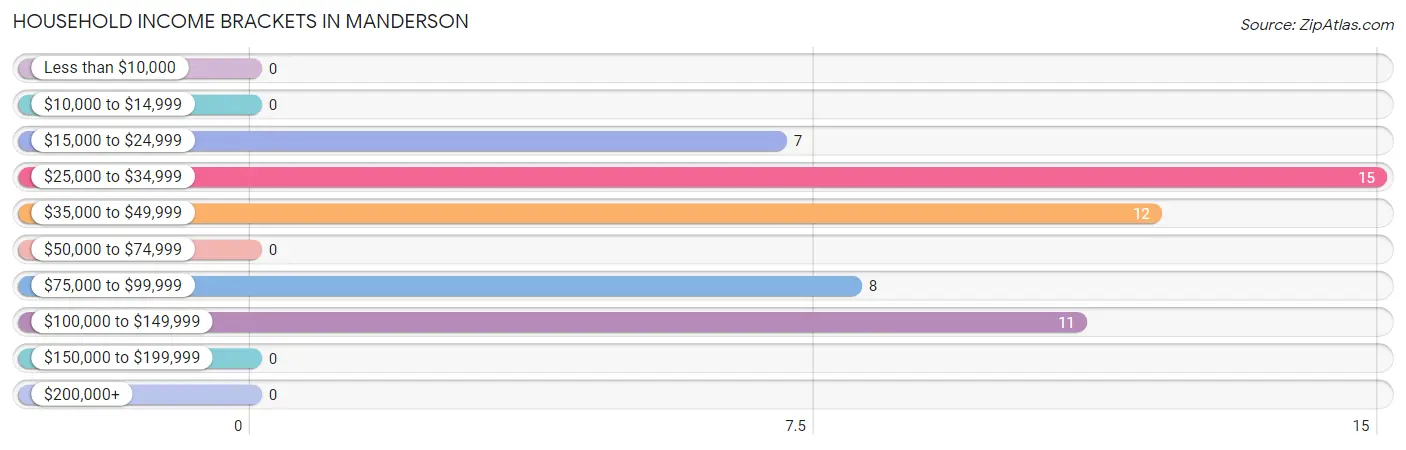
| Income Bracket | # Households | % Households |
| Less than $10,000 | 0 | 0.0% |
| $10,000 to $14,999 | 0 | 0.0% |
| $15,000 to $24,999 | 7 | 13.2% |
| $25,000 to $34,999 | 15 | 28.3% |
| $35,000 to $49,999 | 12 | 22.6% |
| $50,000 to $74,999 | 0 | 0.0% |
| $75,000 to $99,999 | 8 | 15.1% |
| $100,000 to $149,999 | 11 | 20.8% |
| $150,000 to $199,999 | 0 | 0.0% |
| $200,000+ | 0 | 0.0% |
Household Income by Householder Age in Manderson
The median household income in Manderson is $43,438, with the highest median household income of $118,750 found in the 45 to 64 years age bracket for the primary householder. A total of 16 households (30.2%) fall into this category.
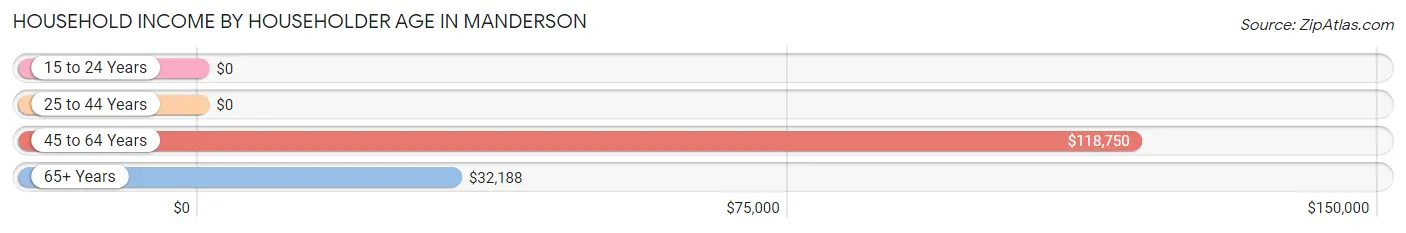
| Income Bracket | # Households | Median Income |
| 15 to 24 Years | 0 (0.0%) | $0 |
| 25 to 44 Years | 8 (15.1%) | $0 |
| 45 to 64 Years | 16 (30.2%) | $118,750 |
| 65+ Years | 29 (54.7%) | $32,188 |
| Total | 53 (100.0%) | $43,438 |
Poverty in Manderson
Income Below Poverty by Sex and Age in Manderson
With 5.7% poverty level for males and 7.3% for females among the residents of Manderson, under 5 year old males and under 5 year old females are the most vulnerable to poverty, with 2 males (100.0%) and 2 females (100.0%) in their respective age groups living below the poverty level.
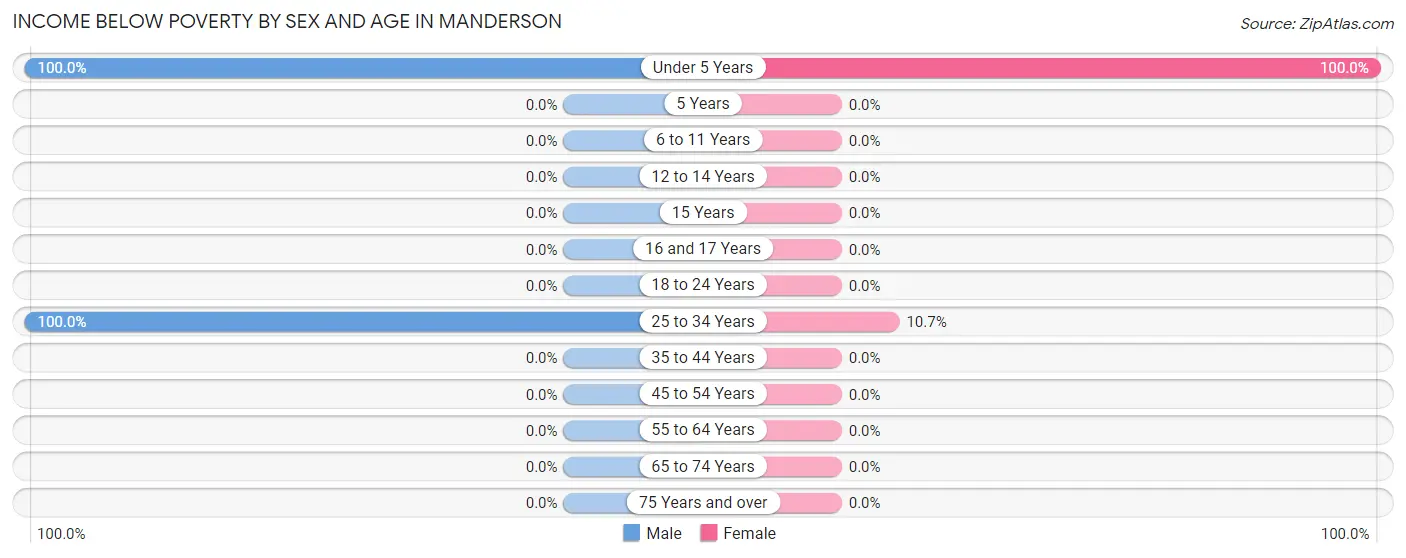
| Age Bracket | Male | Female |
| Under 5 Years | 2 (100.0%) | 2 (100.0%) |
| 5 Years | 0 (0.0%) | 0 (0.0%) |
| 6 to 11 Years | 0 (0.0%) | 0 (0.0%) |
| 12 to 14 Years | 0 (0.0%) | 0 (0.0%) |
| 15 Years | 0 (0.0%) | 0 (0.0%) |
| 16 and 17 Years | 0 (0.0%) | 0 (0.0%) |
| 18 to 24 Years | 0 (0.0%) | 0 (0.0%) |
| 25 to 34 Years | 1 (100.0%) | 3 (10.7%) |
| 35 to 44 Years | 0 (0.0%) | 0 (0.0%) |
| 45 to 54 Years | 0 (0.0%) | 0 (0.0%) |
| 55 to 64 Years | 0 (0.0%) | 0 (0.0%) |
| 65 to 74 Years | 0 (0.0%) | 0 (0.0%) |
| 75 Years and over | 0 (0.0%) | 0 (0.0%) |
| Total | 3 (5.7%) | 5 (7.3%) |
Income Above Poverty by Sex and Age in Manderson
According to the poverty statistics in Manderson, males aged 6 to 11 years and females aged 35 to 44 years are the age groups that are most secure financially, with 100.0% of males and 100.0% of females in these age groups living above the poverty line.
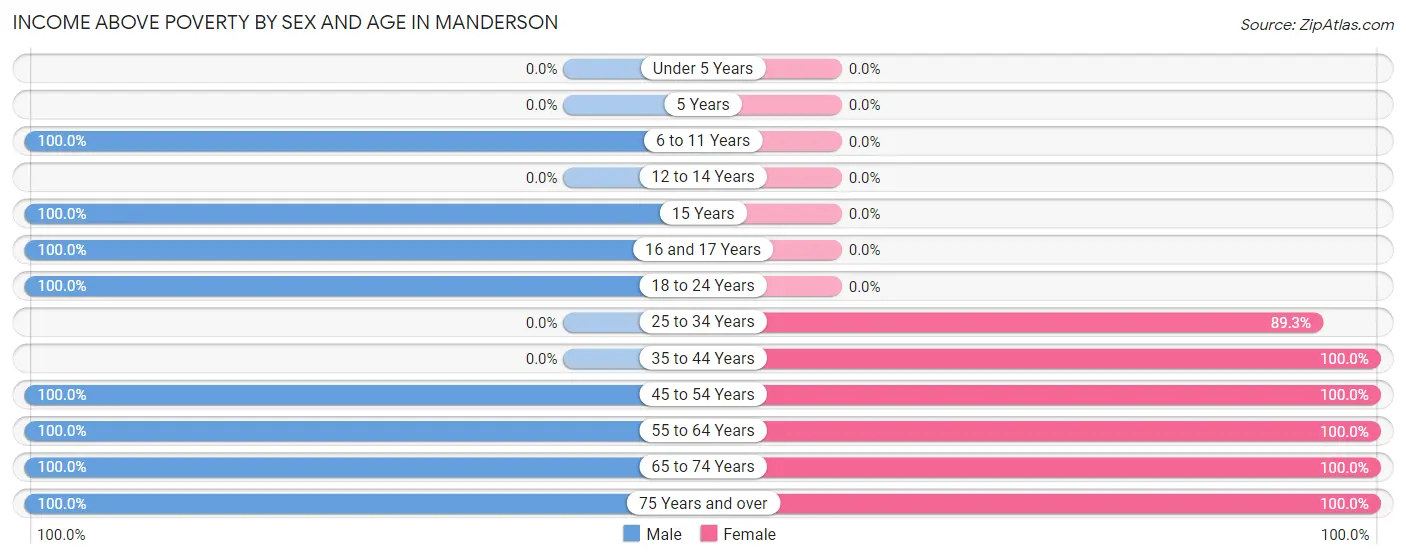
| Age Bracket | Male | Female |
| Under 5 Years | 0 (0.0%) | 0 (0.0%) |
| 5 Years | 0 (0.0%) | 0 (0.0%) |
| 6 to 11 Years | 5 (100.0%) | 0 (0.0%) |
| 12 to 14 Years | 0 (0.0%) | 0 (0.0%) |
| 15 Years | 1 (100.0%) | 0 (0.0%) |
| 16 and 17 Years | 1 (100.0%) | 0 (0.0%) |
| 18 to 24 Years | 8 (100.0%) | 0 (0.0%) |
| 25 to 34 Years | 0 (0.0%) | 25 (89.3%) |
| 35 to 44 Years | 0 (0.0%) | 5 (100.0%) |
| 45 to 54 Years | 6 (100.0%) | 4 (100.0%) |
| 55 to 64 Years | 7 (100.0%) | 8 (100.0%) |
| 65 to 74 Years | 10 (100.0%) | 2 (100.0%) |
| 75 Years and over | 12 (100.0%) | 19 (100.0%) |
| Total | 50 (94.3%) | 63 (92.6%) |
Income Below Poverty Among Married-Couple Families in Manderson
The poverty statistics for married-couple families in Manderson show that 11.1% or 3 of the total 27 families live below the poverty line. Families with 1 or 2 children have the highest poverty rate of 75.0%, comprising of 3 families. On the other hand, families with no children have the lowest poverty rate of 0.0%, which includes 0 families.
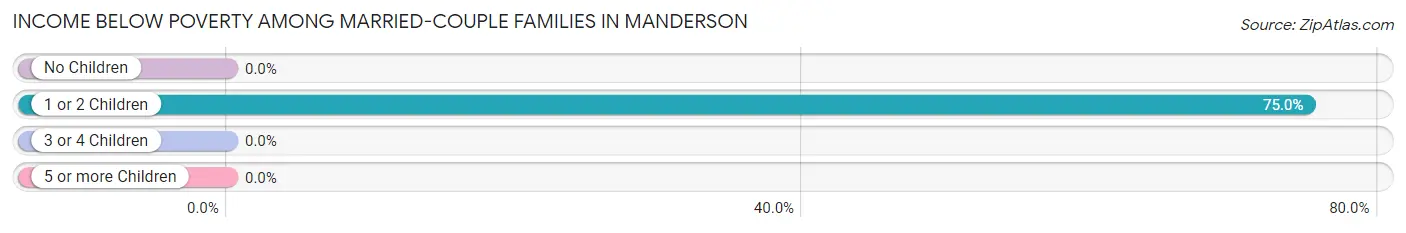
| Children | Above Poverty | Below Poverty |
| No Children | 23 (100.0%) | 0 (0.0%) |
| 1 or 2 Children | 1 (25.0%) | 3 (75.0%) |
| 3 or 4 Children | 0 (0.0%) | 0 (0.0%) |
| 5 or more Children | 0 (0.0%) | 0 (0.0%) |
| Total | 24 (88.9%) | 3 (11.1%) |
Income Below Poverty Among Single-Parent Households in Manderson
| Children | Single Father | Single Mother |
| No Children | 0 (0.0%) | 0 (0.0%) |
| 1 or 2 Children | 0 (0.0%) | 0 (0.0%) |
| 3 or 4 Children | 0 (0.0%) | 0 (0.0%) |
| 5 or more Children | 0 (0.0%) | 0 (0.0%) |
| Total | 0 (0.0%) | 0 (0.0%) |
Income Below Poverty Among Married-Couple vs Single-Parent Households in Manderson
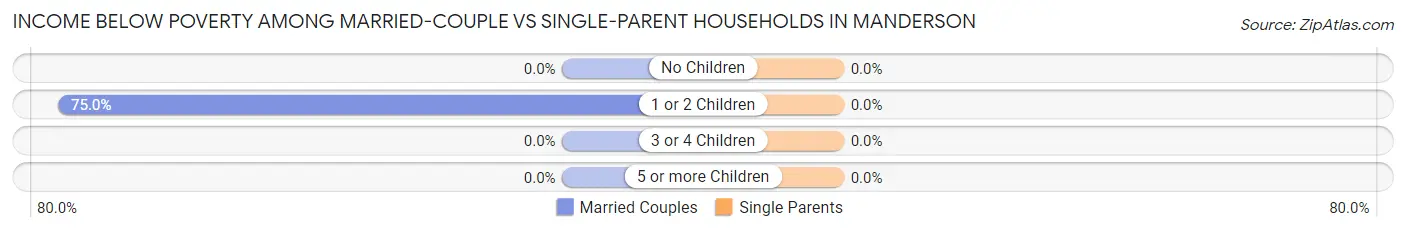
| Children | Married-Couple Families | Single-Parent Households |
| No Children | 0 (0.0%) | 0 (0.0%) |
| 1 or 2 Children | 3 (75.0%) | 0 (0.0%) |
| 3 or 4 Children | 0 (0.0%) | 0 (0.0%) |
| 5 or more Children | 0 (0.0%) | 0 (0.0%) |
| Total | 3 (11.1%) | 0 (0.0%) |
Race in Manderson
The most populous races in Manderson are White / Caucasian (119 | 98.4%), Two or more Races (2 | 1.7%), and Hispanic or Latino (1 | 0.8%).
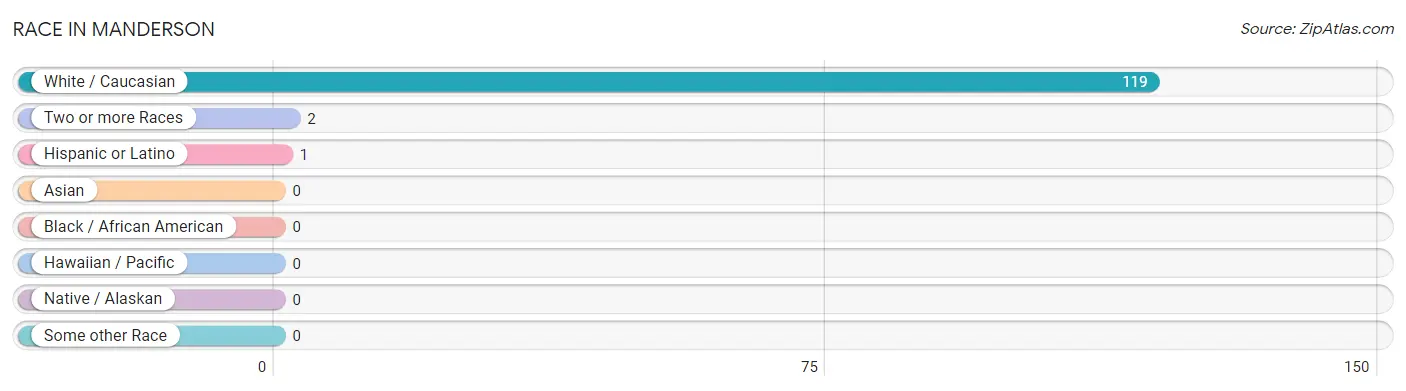
| Race | # Population | % Population |
| Asian | 0 | 0.0% |
| Black / African American | 0 | 0.0% |
| Hawaiian / Pacific | 0 | 0.0% |
| Hispanic or Latino | 1 | 0.8% |
| Native / Alaskan | 0 | 0.0% |
| White / Caucasian | 119 | 98.4% |
| Two or more Races | 2 | 1.7% |
| Some other Race | 0 | 0.0% |
| Total | 121 | 100.0% |
Ancestry in Manderson
The most populous ancestries reported in Manderson are English (35 | 28.9%), Irish (33 | 27.3%), German (29 | 24.0%), European (5 | 4.1%), and Scottish (4 | 3.3%), together accounting for 87.6% of all Manderson residents.
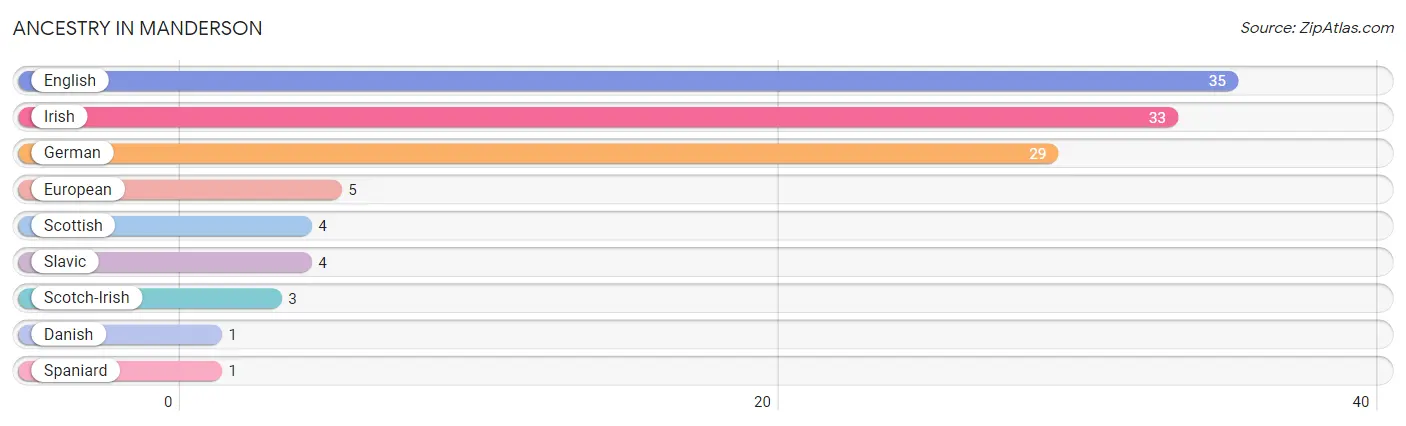
| Ancestry | # Population | % Population |
| Danish | 1 | 0.8% |
| English | 35 | 28.9% |
| European | 5 | 4.1% |
| German | 29 | 24.0% |
| Irish | 33 | 27.3% |
| Scotch-Irish | 3 | 2.5% |
| Scottish | 4 | 3.3% |
| Slavic | 4 | 3.3% |
| Spaniard | 1 | 0.8% | View All 9 Rows |
Immigrants in Manderson

| Immigration Origin | # Population | % Population | View All 0 Rows |
Sex and Age in Manderson
Sex and Age in Manderson
The most populous age groups in Manderson are 65 to 69 Years (10 | 18.9%) for men and 75 to 79 Years (17 | 25.0%) for women.
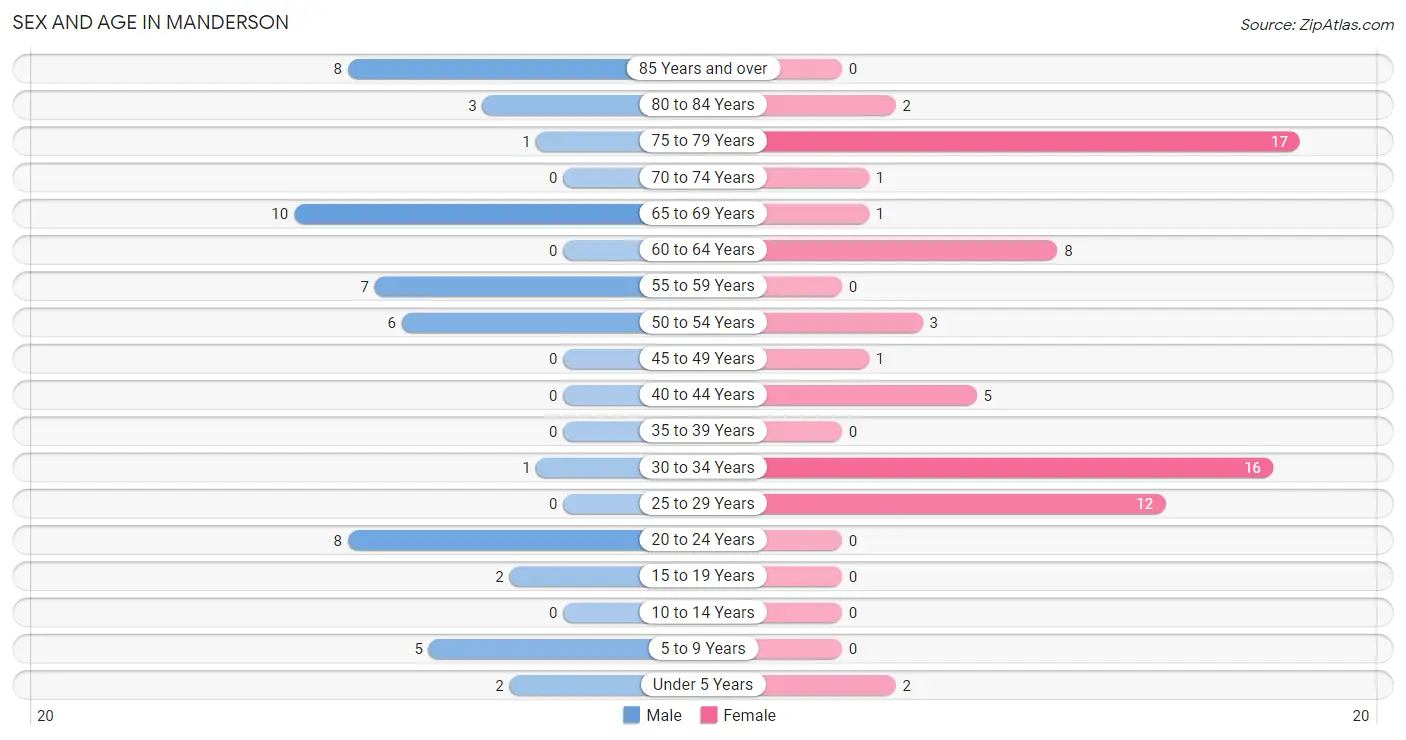
| Age Bracket | Male | Female |
| Under 5 Years | 2 (3.8%) | 2 (2.9%) |
| 5 to 9 Years | 5 (9.4%) | 0 (0.0%) |
| 10 to 14 Years | 0 (0.0%) | 0 (0.0%) |
| 15 to 19 Years | 2 (3.8%) | 0 (0.0%) |
| 20 to 24 Years | 8 (15.1%) | 0 (0.0%) |
| 25 to 29 Years | 0 (0.0%) | 12 (17.6%) |
| 30 to 34 Years | 1 (1.9%) | 16 (23.5%) |
| 35 to 39 Years | 0 (0.0%) | 0 (0.0%) |
| 40 to 44 Years | 0 (0.0%) | 5 (7.3%) |
| 45 to 49 Years | 0 (0.0%) | 1 (1.5%) |
| 50 to 54 Years | 6 (11.3%) | 3 (4.4%) |
| 55 to 59 Years | 7 (13.2%) | 0 (0.0%) |
| 60 to 64 Years | 0 (0.0%) | 8 (11.8%) |
| 65 to 69 Years | 10 (18.9%) | 1 (1.5%) |
| 70 to 74 Years | 0 (0.0%) | 1 (1.5%) |
| 75 to 79 Years | 1 (1.9%) | 17 (25.0%) |
| 80 to 84 Years | 3 (5.7%) | 2 (2.9%) |
| 85 Years and over | 8 (15.1%) | 0 (0.0%) |
| Total | 53 (100.0%) | 68 (100.0%) |
Families and Households in Manderson
Median Family Size in Manderson
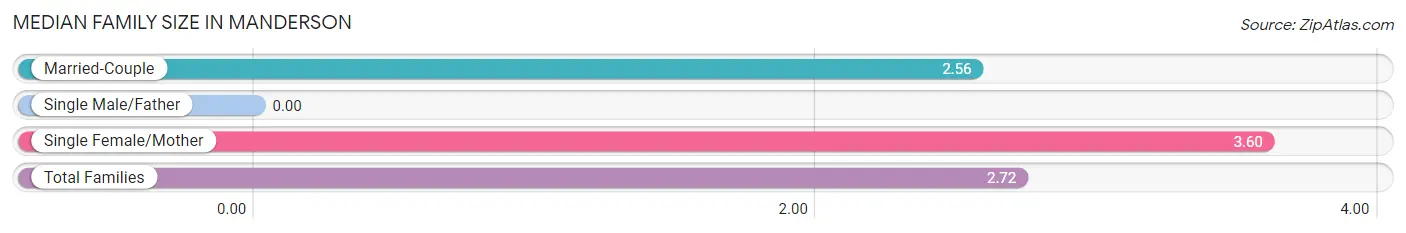
| Family Type | # Families | Family Size |
| Married-Couple | 27 (84.4%) | 2.56 |
| Single Male/Father | 0 (0.0%) | - |
| Single Female/Mother | 5 (15.6%) | 3.60 |
| Total Families | 32 (100.0%) | 2.72 |
Median Household Size in Manderson
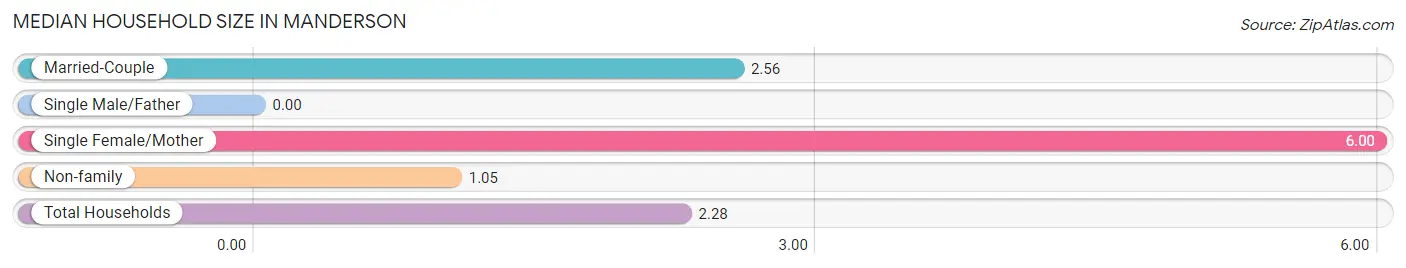
| Household Type | # Households | Household Size |
| Married-Couple | 27 (50.9%) | 2.56 |
| Single Male/Father | 0 (0.0%) | - |
| Single Female/Mother | 5 (9.4%) | 6.00 |
| Non-family | 21 (39.6%) | 1.05 |
| Total Households | 53 (100.0%) | 2.28 |
Household Size by Marriage Status in Manderson
Out of a total of 53 households in Manderson, 32 (60.4%) are family households, while 21 (39.6%) are nonfamily households. The most numerous type of family households are 2-person households, comprising 18, and the most common type of nonfamily households are 1-person households, comprising 20.
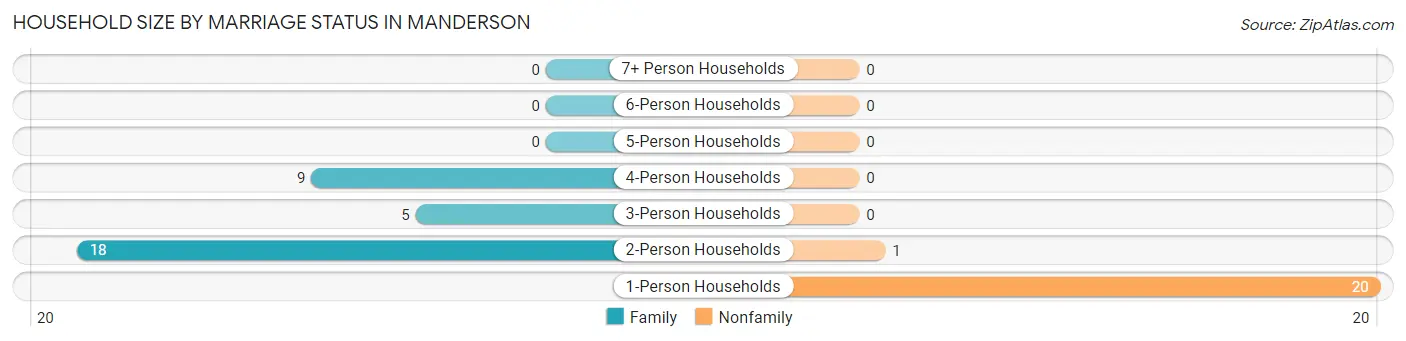
| Household Size | Family Households | Nonfamily Households |
| 1-Person Households | - | 20 (37.7%) |
| 2-Person Households | 18 (34.0%) | 1 (1.9%) |
| 3-Person Households | 5 (9.4%) | 0 (0.0%) |
| 4-Person Households | 9 (17.0%) | 0 (0.0%) |
| 5-Person Households | 0 (0.0%) | 0 (0.0%) |
| 6-Person Households | 0 (0.0%) | 0 (0.0%) |
| 7+ Person Households | 0 (0.0%) | 0 (0.0%) |
| Total | 32 (60.4%) | 21 (39.6%) |
Female Fertility in Manderson
Fertility by Age in Manderson
Average fertility rate in Manderson is 88.0 births per 1,000 women. Women in the age bracket of 20 to 34 years have the highest fertility rate with 107.0 births per 1,000 women. Women in the age bracket of 20 to 34 years acount for 100.0% of all women with births.
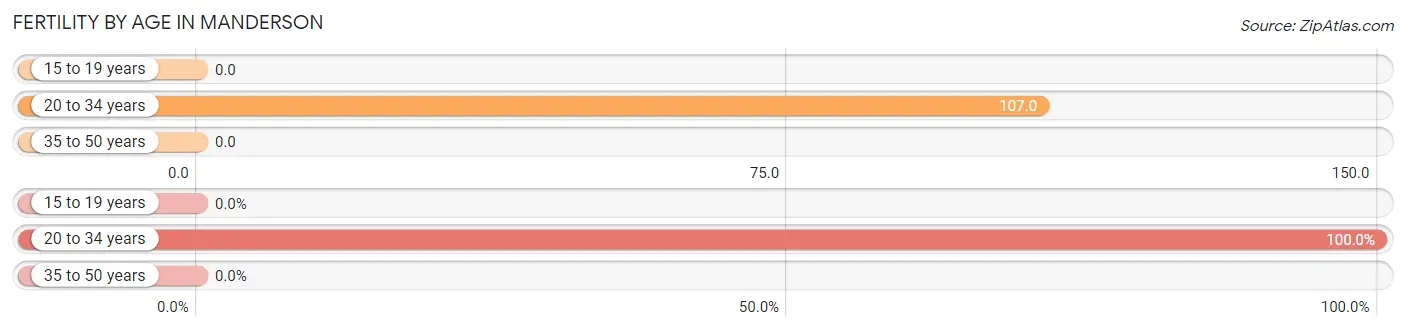
| Age Bracket | Women with Births | Births / 1,000 Women |
| 15 to 19 years | 0 (0.0%) | 0.0 |
| 20 to 34 years | 3 (100.0%) | 107.0 |
| 35 to 50 years | 0 (0.0%) | 0.0 |
| Total | 3 (100.0%) | 88.0 |
Fertility by Age by Marriage Status in Manderson
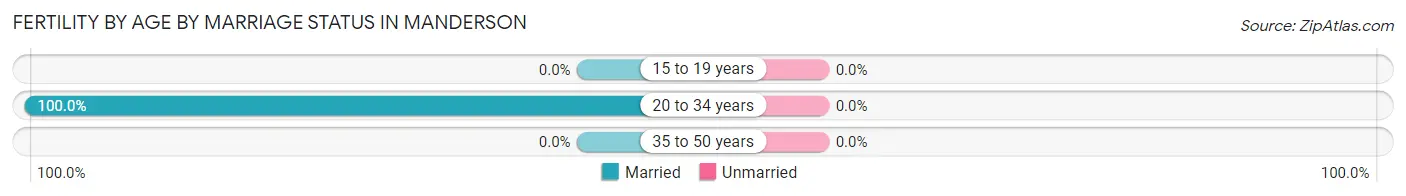
| Age Bracket | Married | Unmarried |
| 15 to 19 years | 0 (0.0%) | 0 (0.0%) |
| 20 to 34 years | 3 (100.0%) | 0 (0.0%) |
| 35 to 50 years | 0 (0.0%) | 0 (0.0%) |
| Total | 3 (100.0%) | 0 (0.0%) |
Fertility by Education in Manderson
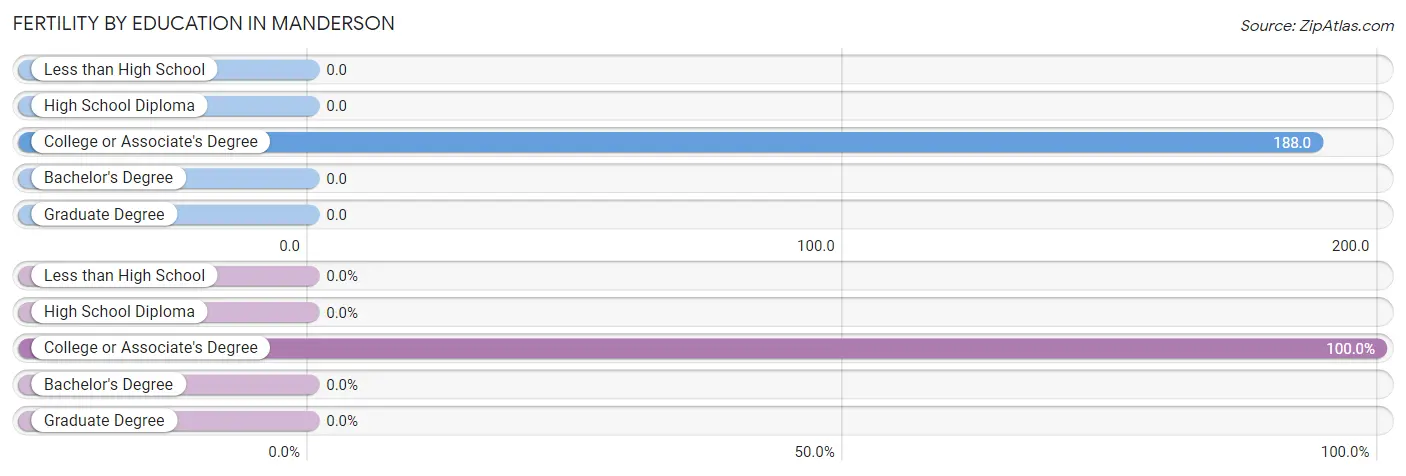
| Educational Attainment | Women with Births | Births / 1,000 Women |
| Less than High School | 0 (0.0%) | 0.0 |
| High School Diploma | 0 (0.0%) | 0.0 |
| College or Associate's Degree | 3 (100.0%) | 188.0 |
| Bachelor's Degree | 0 (0.0%) | 0.0 |
| Graduate Degree | 0 (0.0%) | 0.0 |
| Total | 3 (100.0%) | 88.0 |
Fertility by Education by Marriage Status in Manderson
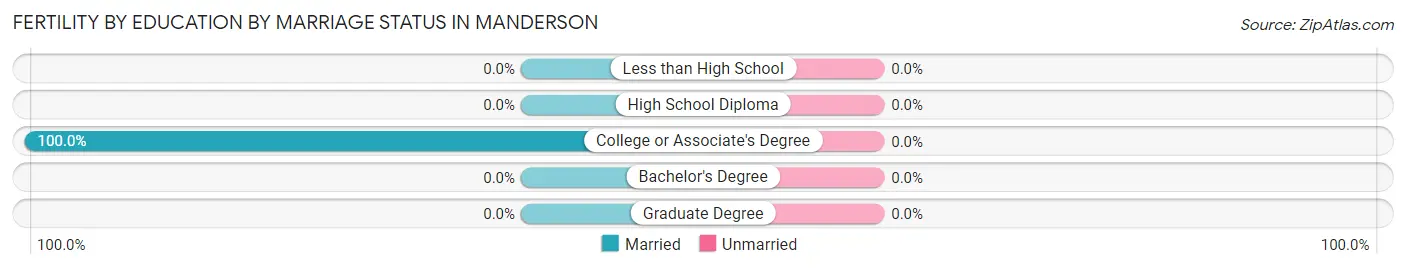
| Educational Attainment | Married | Unmarried |
| Less than High School | 0 (0.0%) | 0 (0.0%) |
| High School Diploma | 0 (0.0%) | 0 (0.0%) |
| College or Associate's Degree | 3 (100.0%) | 0 (0.0%) |
| Bachelor's Degree | 0 (0.0%) | 0 (0.0%) |
| Graduate Degree | 0 (0.0%) | 0 (0.0%) |
| Total | 3 (100.0%) | 0 (0.0%) |
Employment Characteristics in Manderson
Employment by Class of Employer in Manderson
Among the 83 employed individuals in Manderson, private company employees (41 | 49.4%), federal government employees (18 | 21.7%), and not-for-profit organizations (10 | 12.0%) make up the most common classes of employment.
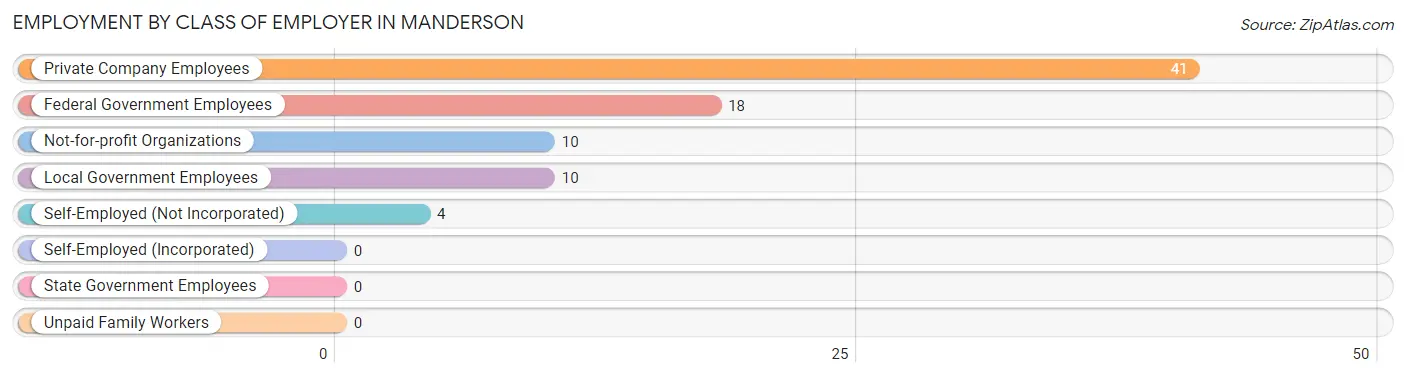
| Employer Class | # Employees | % Employees |
| Private Company Employees | 41 | 49.4% |
| Self-Employed (Incorporated) | 0 | 0.0% |
| Self-Employed (Not Incorporated) | 4 | 4.8% |
| Not-for-profit Organizations | 10 | 12.0% |
| Local Government Employees | 10 | 12.0% |
| State Government Employees | 0 | 0.0% |
| Federal Government Employees | 18 | 21.7% |
| Unpaid Family Workers | 0 | 0.0% |
| Total | 83 | 100.0% |
Employment Status by Age in Manderson
According to the labor force statistics for Manderson, out of the total population over 16 years of age (111), 75.7% or 84 individuals are in the labor force, with 1.2% or 1 of them unemployed. The age group with the highest labor force participation rate is 16 to 19 years, with 100.0% or 1 individuals in the labor force. Within the labor force, the 30 to 34 years age range has the highest percentage of unemployed individuals, with 5.9% or 1 of them being unemployed.
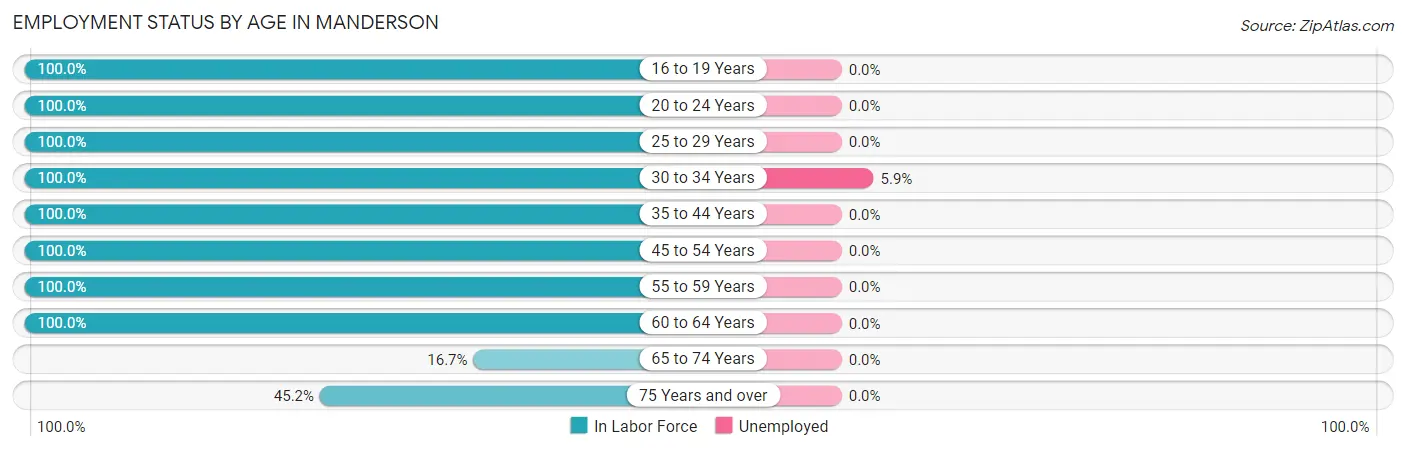
| Age Bracket | In Labor Force | Unemployed |
| 16 to 19 Years | 1 (100.0%) | 0 (0.0%) |
| 20 to 24 Years | 8 (100.0%) | 0 (0.0%) |
| 25 to 29 Years | 12 (100.0%) | 0 (0.0%) |
| 30 to 34 Years | 17 (100.0%) | 1 (5.9%) |
| 35 to 44 Years | 5 (100.0%) | 0 (0.0%) |
| 45 to 54 Years | 10 (100.0%) | 0 (0.0%) |
| 55 to 59 Years | 7 (100.0%) | 0 (0.0%) |
| 60 to 64 Years | 8 (100.0%) | 0 (0.0%) |
| 65 to 74 Years | 2 (16.7%) | 0 (0.0%) |
| 75 Years and over | 14 (45.2%) | 0 (0.0%) |
| Total | 84 (75.7%) | 1 (1.2%) |
Employment Status by Educational Attainment in Manderson
According to labor force statistics for Manderson, 100.0% of individuals (59) out of the total population between 25 and 64 years of age (59) are in the labor force, with 1.7% or 1 of them being unemployed. The group with the highest labor force participation rate are those with the educational attainment of less than high school, with 100.0% or 3 individuals in the labor force. Within the labor force, individuals with high school diploma education have the highest percentage of unemployment, with 4.0% or 1 of them being unemployed.
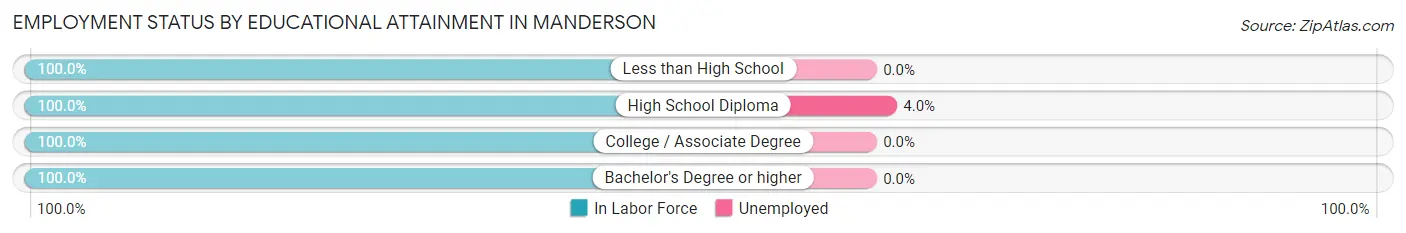
| Educational Attainment | In Labor Force | Unemployed |
| Less than High School | 3 (100.0%) | 0 (0.0%) |
| High School Diploma | 25 (100.0%) | 1 (4.0%) |
| College / Associate Degree | 23 (100.0%) | 0 (0.0%) |
| Bachelor's Degree or higher | 8 (100.0%) | 0 (0.0%) |
| Total | 59 (100.0%) | 1 (1.7%) |
Employment Occupations by Sex in Manderson
Management, Business, Science and Arts Occupations
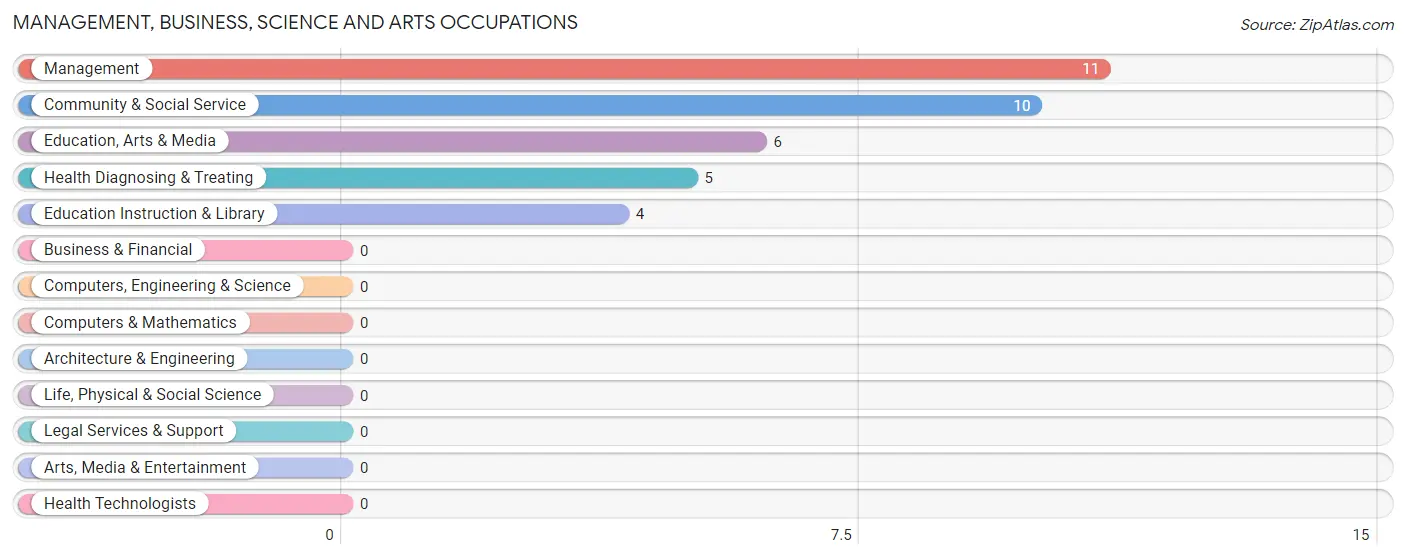
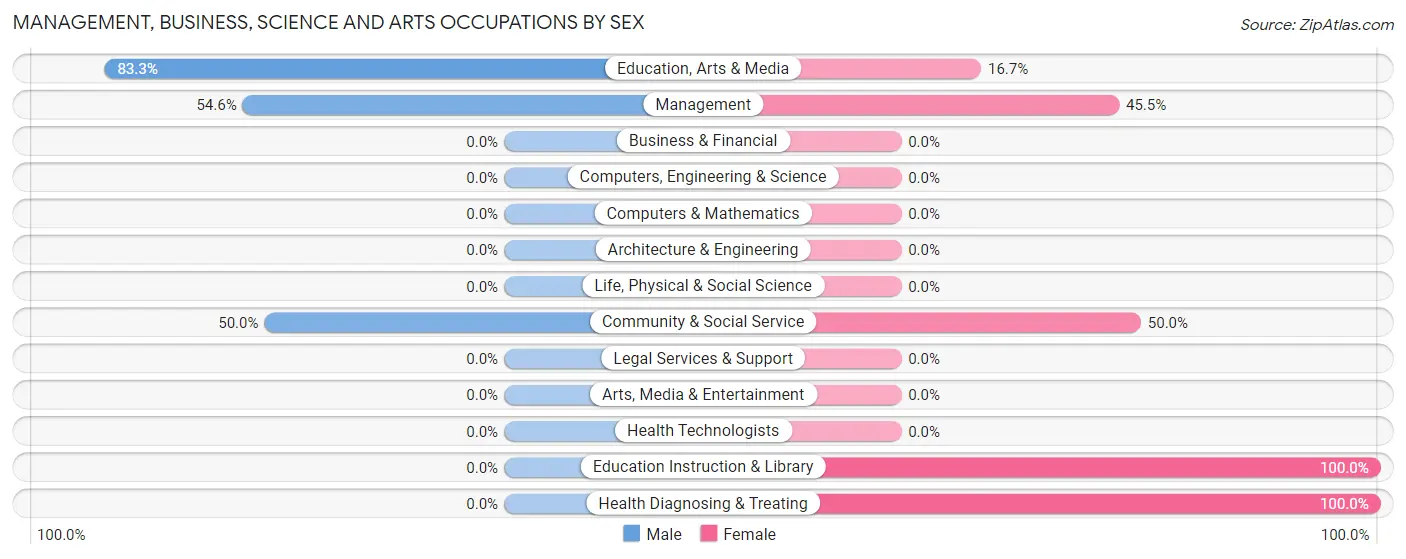
The most common Management, Business, Science and Arts occupations in Manderson are Management (11 | 13.3%), Community & Social Service (10 | 12.0%), Education, Arts & Media (6 | 7.2%), Health Diagnosing & Treating (5 | 6.0%), and Education Instruction & Library (4 | 4.8%).
Management, Business, Science and Arts Occupations by Sex
Within the Management, Business, Science and Arts occupations in Manderson, the most male-oriented occupations are Education, Arts & Media (83.3%), Management (54.5%), and Community & Social Service (50.0%), while the most female-oriented occupations are Education Instruction & Library (100.0%), Health Diagnosing & Treating (100.0%), and Community & Social Service (50.0%).
| Occupation | Male | Female |
| Management | 6 (54.5%) | 5 (45.5%) |
| Business & Financial | 0 (0.0%) | 0 (0.0%) |
| Computers, Engineering & Science | 0 (0.0%) | 0 (0.0%) |
| Computers & Mathematics | 0 (0.0%) | 0 (0.0%) |
| Architecture & Engineering | 0 (0.0%) | 0 (0.0%) |
| Life, Physical & Social Science | 0 (0.0%) | 0 (0.0%) |
| Community & Social Service | 5 (50.0%) | 5 (50.0%) |
| Education, Arts & Media | 5 (83.3%) | 1 (16.7%) |
| Legal Services & Support | 0 (0.0%) | 0 (0.0%) |
| Education Instruction & Library | 0 (0.0%) | 4 (100.0%) |
| Arts, Media & Entertainment | 0 (0.0%) | 0 (0.0%) |
| Health Diagnosing & Treating | 0 (0.0%) | 5 (100.0%) |
| Health Technologists | 0 (0.0%) | 0 (0.0%) |
| Total (Category) | 11 (42.3%) | 15 (57.7%) |
| Total (Overall) | 26 (31.3%) | 57 (68.7%) |
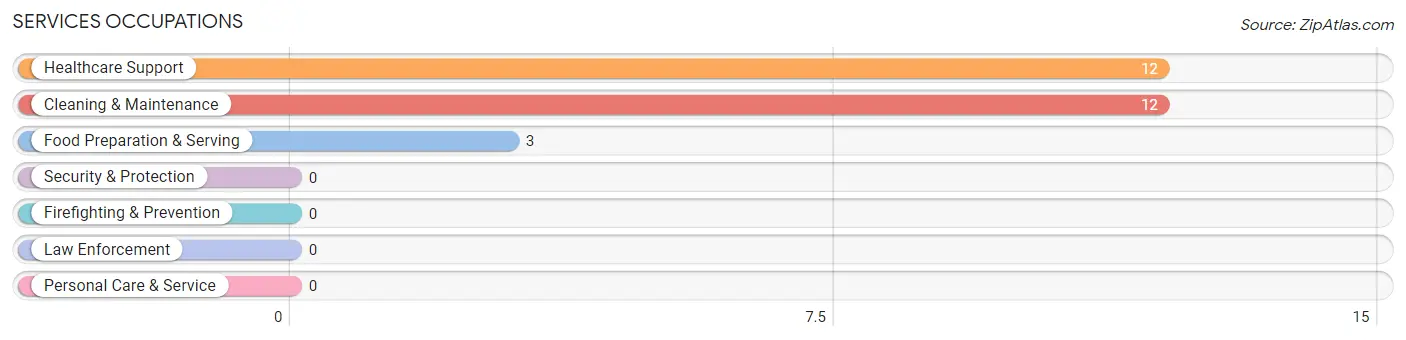
Services Occupations
The most common Services occupations in Manderson are Healthcare Support (12 | 14.5%), Cleaning & Maintenance (12 | 14.5%), and Food Preparation & Serving (3 | 3.6%).
Services Occupations by Sex
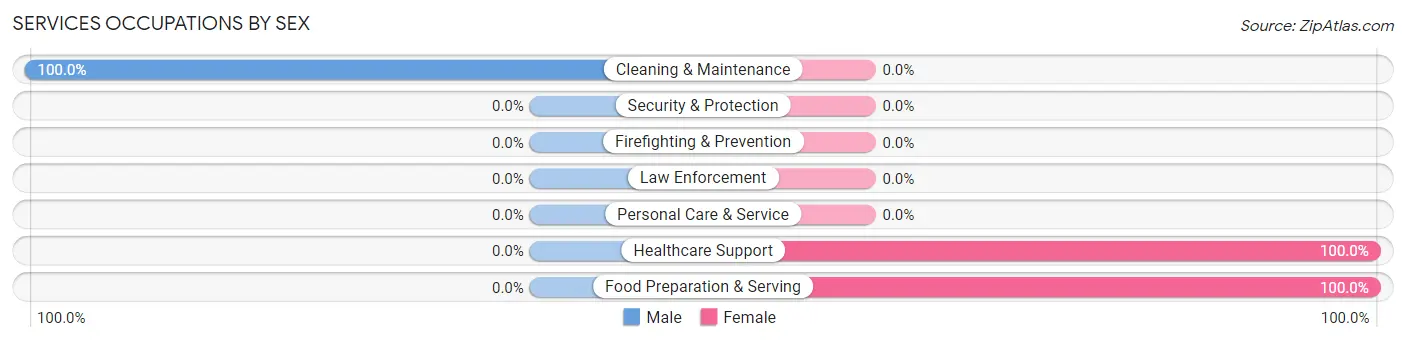
| Occupation | Male | Female |
| Healthcare Support | 0 (0.0%) | 12 (100.0%) |
| Security & Protection | 0 (0.0%) | 0 (0.0%) |
| Firefighting & Prevention | 0 (0.0%) | 0 (0.0%) |
| Law Enforcement | 0 (0.0%) | 0 (0.0%) |
| Food Preparation & Serving | 0 (0.0%) | 3 (100.0%) |
| Cleaning & Maintenance | 12 (100.0%) | 0 (0.0%) |
| Personal Care & Service | 0 (0.0%) | 0 (0.0%) |
| Total (Category) | 12 (44.4%) | 15 (55.6%) |
| Total (Overall) | 26 (31.3%) | 57 (68.7%) |
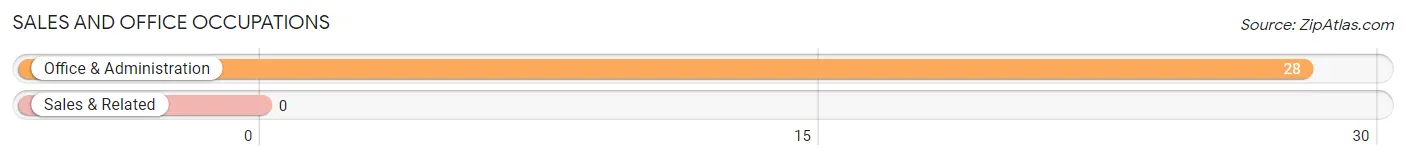
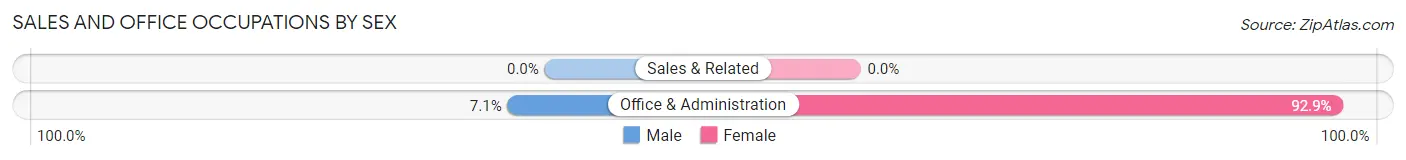
Sales and Office Occupations
The most common Sales and Office occupations in Manderson are , and Office & Administration (28 | 33.7%).
Sales and Office Occupations by Sex
| Occupation | Male | Female |
| Sales & Related | 0 (0.0%) | 0 (0.0%) |
| Office & Administration | 2 (7.1%) | 26 (92.9%) |
| Total (Category) | 2 (7.1%) | 26 (92.9%) |
| Total (Overall) | 26 (31.3%) | 57 (68.7%) |
Natural Resources, Construction and Maintenance Occupations
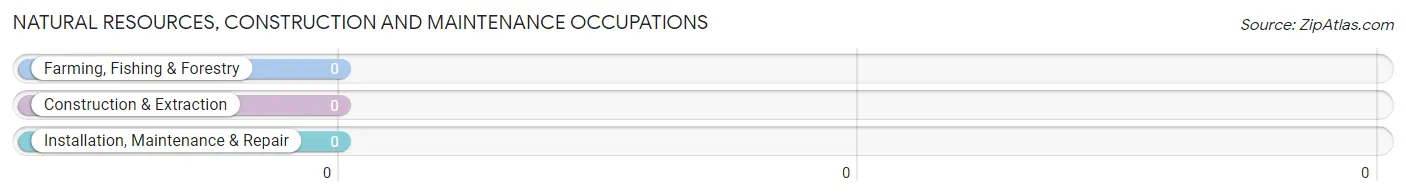
Natural Resources, Construction and Maintenance Occupations by Sex
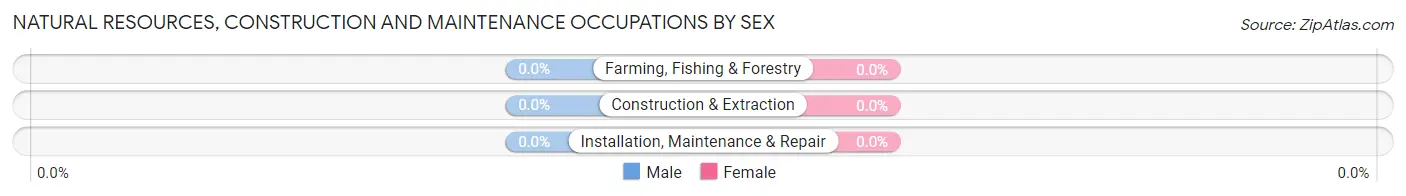
| Occupation | Male | Female |
| Farming, Fishing & Forestry | 0 (0.0%) | 0 (0.0%) |
| Construction & Extraction | 0 (0.0%) | 0 (0.0%) |
| Installation, Maintenance & Repair | 0 (0.0%) | 0 (0.0%) |
| Total (Category) | 0 (0.0%) | 0 (0.0%) |
| Total (Overall) | 26 (31.3%) | 57 (68.7%) |
Production, Transportation and Moving Occupations
The most common Production, Transportation and Moving occupations in Manderson are , and Material Moving (2 | 2.4%).
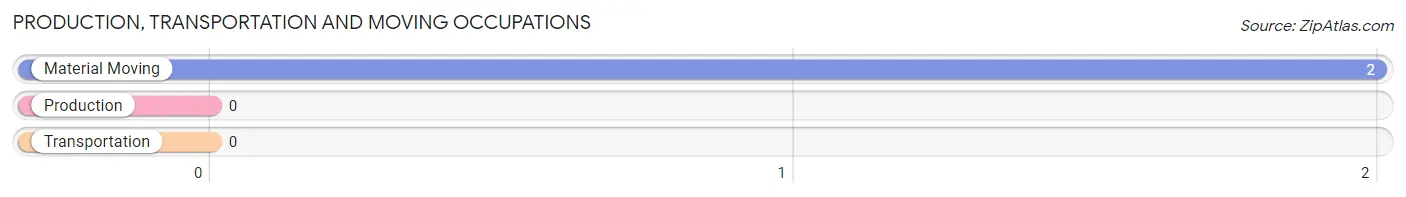
Production, Transportation and Moving Occupations by Sex
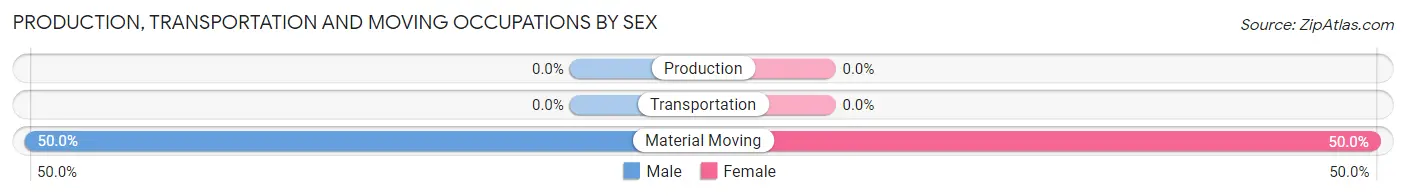
| Occupation | Male | Female |
| Production | 0 (0.0%) | 0 (0.0%) |
| Transportation | 0 (0.0%) | 0 (0.0%) |
| Material Moving | 1 (50.0%) | 1 (50.0%) |
| Total (Category) | 1 (50.0%) | 1 (50.0%) |
| Total (Overall) | 26 (31.3%) | 57 (68.7%) |
Employment Industries by Sex in Manderson
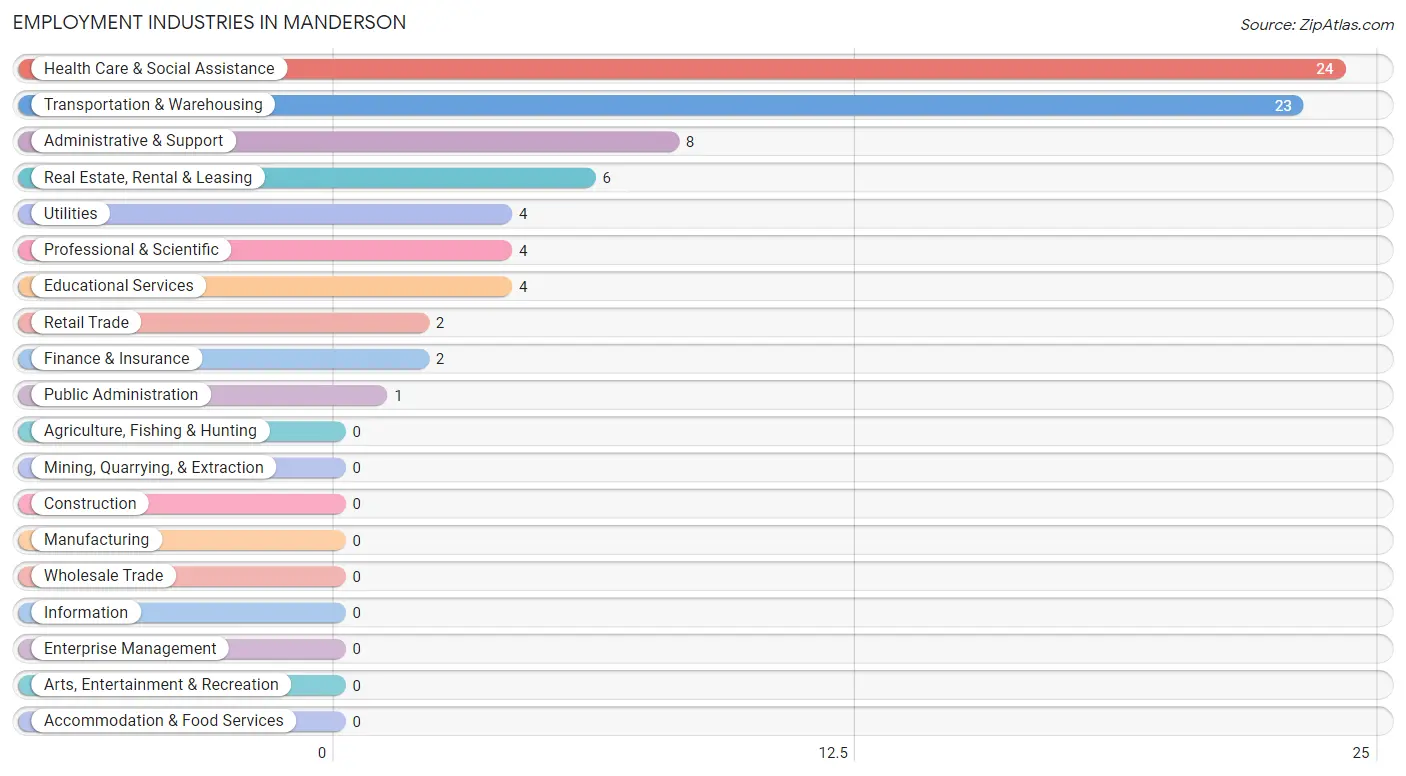
Employment Industries in Manderson
The major employment industries in Manderson include Health Care & Social Assistance (24 | 28.9%), Transportation & Warehousing (23 | 27.7%), Administrative & Support (8 | 9.6%), Real Estate, Rental & Leasing (6 | 7.2%), and Utilities (4 | 4.8%).
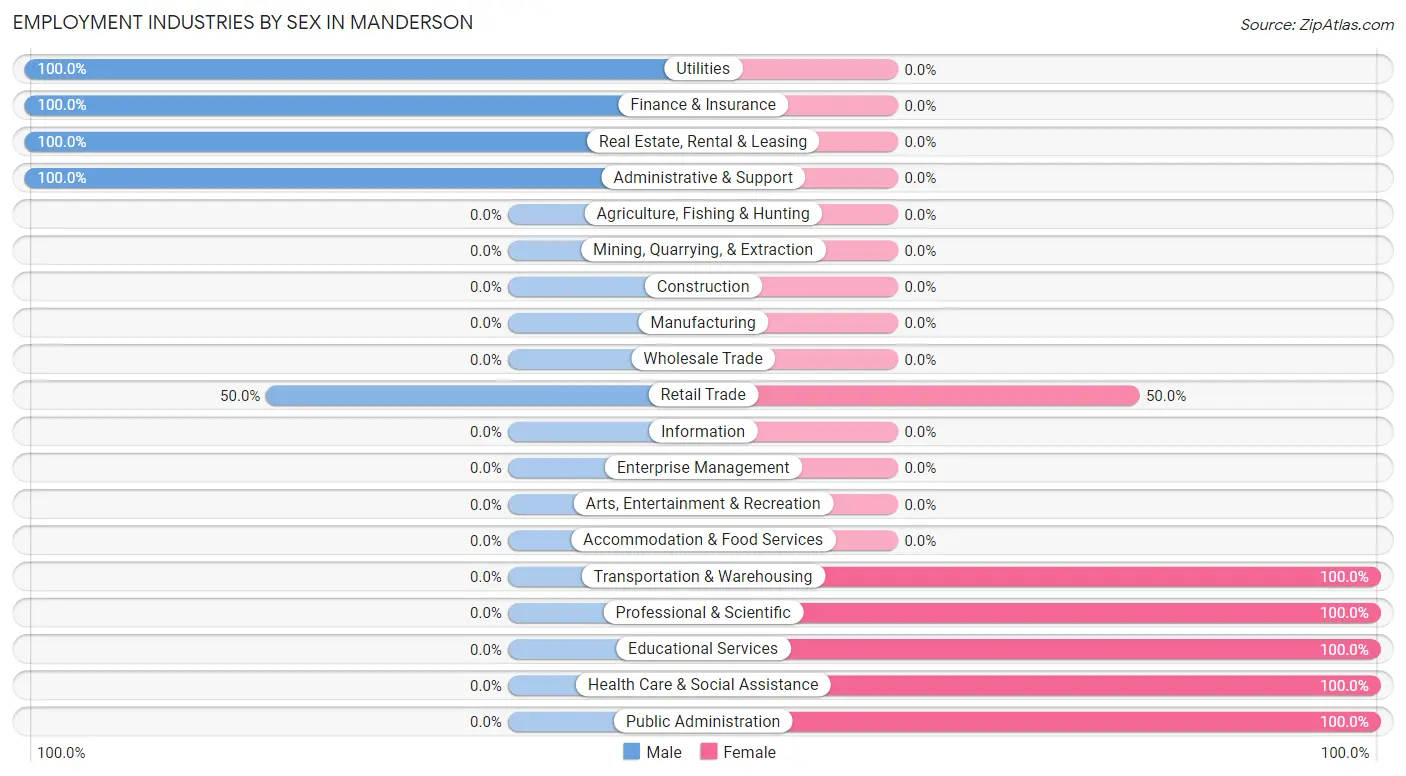
Employment Industries by Sex in Manderson
The Manderson industries that see more men than women are Utilities (100.0%), Finance & Insurance (100.0%), and Real Estate, Rental & Leasing (100.0%), whereas the industries that tend to have a higher number of women are Transportation & Warehousing (100.0%), Professional & Scientific (100.0%), and Educational Services (100.0%).
| Industry | Male | Female |
| Agriculture, Fishing & Hunting | 0 (0.0%) | 0 (0.0%) |
| Mining, Quarrying, & Extraction | 0 (0.0%) | 0 (0.0%) |
| Construction | 0 (0.0%) | 0 (0.0%) |
| Manufacturing | 0 (0.0%) | 0 (0.0%) |
| Wholesale Trade | 0 (0.0%) | 0 (0.0%) |
| Retail Trade | 1 (50.0%) | 1 (50.0%) |
| Transportation & Warehousing | 0 (0.0%) | 23 (100.0%) |
| Utilities | 4 (100.0%) | 0 (0.0%) |
| Information | 0 (0.0%) | 0 (0.0%) |
| Finance & Insurance | 2 (100.0%) | 0 (0.0%) |
| Real Estate, Rental & Leasing | 6 (100.0%) | 0 (0.0%) |
| Professional & Scientific | 0 (0.0%) | 4 (100.0%) |
| Enterprise Management | 0 (0.0%) | 0 (0.0%) |
| Administrative & Support | 8 (100.0%) | 0 (0.0%) |
| Educational Services | 0 (0.0%) | 4 (100.0%) |
| Health Care & Social Assistance | 0 (0.0%) | 24 (100.0%) |
| Arts, Entertainment & Recreation | 0 (0.0%) | 0 (0.0%) |
| Accommodation & Food Services | 0 (0.0%) | 0 (0.0%) |
| Public Administration | 0 (0.0%) | 1 (100.0%) |
| Total | 26 (31.3%) | 57 (68.7%) |
Education in Manderson
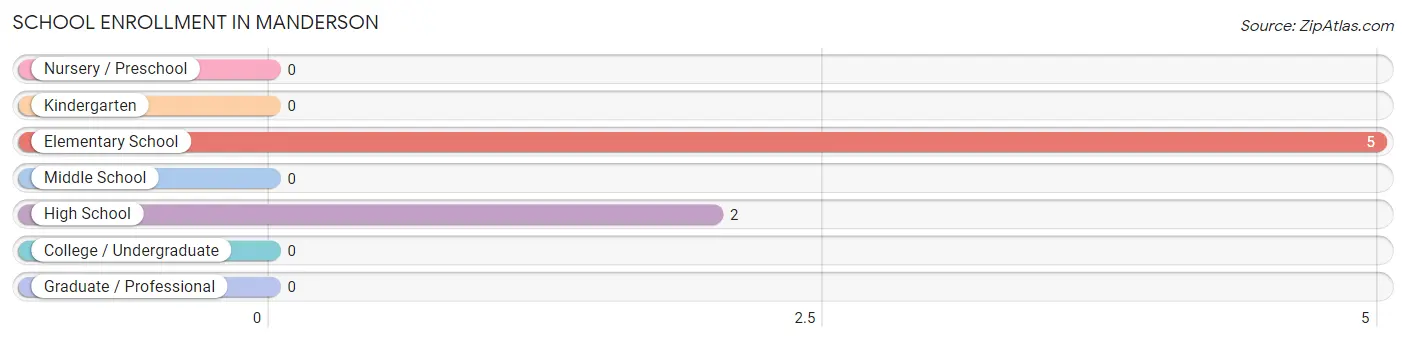
School Enrollment in Manderson
The most common levels of schooling among the 7 students in Manderson are elementary school (5 | 71.4%), and high school (2 | 28.6%).
| School Level | # Students | % Students |
| Nursery / Preschool | 0 | 0.0% |
| Kindergarten | 0 | 0.0% |
| Elementary School | 5 | 71.4% |
| Middle School | 0 | 0.0% |
| High School | 2 | 28.6% |
| College / Undergraduate | 0 | 0.0% |
| Graduate / Professional | 0 | 0.0% |
| Total | 7 | 100.0% |
School Enrollment by Age by Funding Source in Manderson
Out of a total of 7 students who are enrolled in schools in Manderson, 2 (28.6%) attend a private institution, while the remaining 5 (71.4%) are enrolled in public schools. The age group of 15 to 17 year olds has the highest likelihood of being enrolled in private schools, with 2 (100.0% in the age bracket) enrolled. Conversely, the age group of 5 to 9 year old has the lowest likelihood of being enrolled in a private school, with 5 (100.0% in the age bracket) attending a public institution.
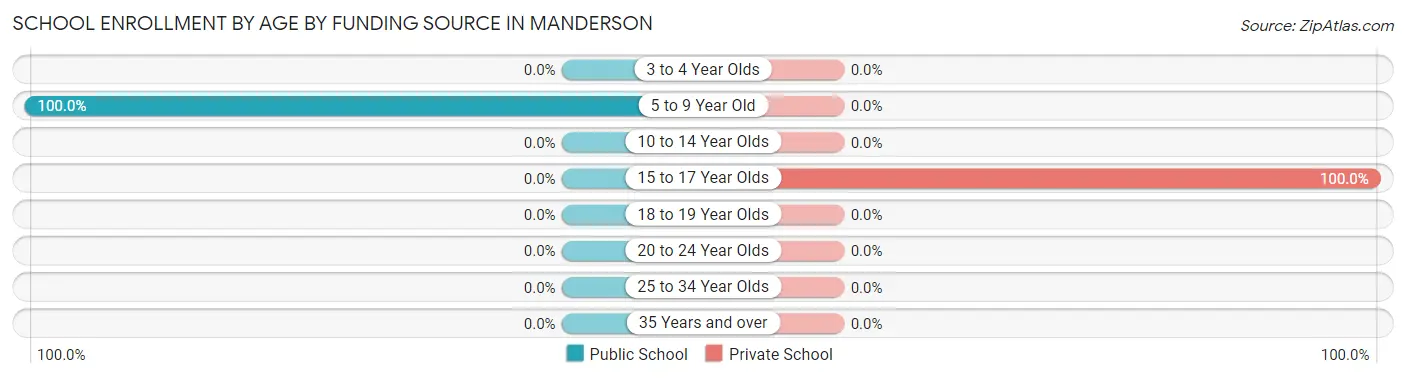
| Age Bracket | Public School | Private School |
| 3 to 4 Year Olds | 0 (0.0%) | 0 (0.0%) |
| 5 to 9 Year Old | 5 (100.0%) | 0 (0.0%) |
| 10 to 14 Year Olds | 0 (0.0%) | 0 (0.0%) |
| 15 to 17 Year Olds | 0 (0.0%) | 2 (100.0%) |
| 18 to 19 Year Olds | 0 (0.0%) | 0 (0.0%) |
| 20 to 24 Year Olds | 0 (0.0%) | 0 (0.0%) |
| 25 to 34 Year Olds | 0 (0.0%) | 0 (0.0%) |
| 35 Years and over | 0 (0.0%) | 0 (0.0%) |
| Total | 5 (71.4%) | 2 (28.6%) |
Educational Attainment by Field of Study in Manderson
Science & technology (5 | 38.5%), education (4 | 30.8%), and communications (4 | 30.8%) are the most common fields of study among 13 individuals in Manderson who have obtained a bachelor's degree or higher.
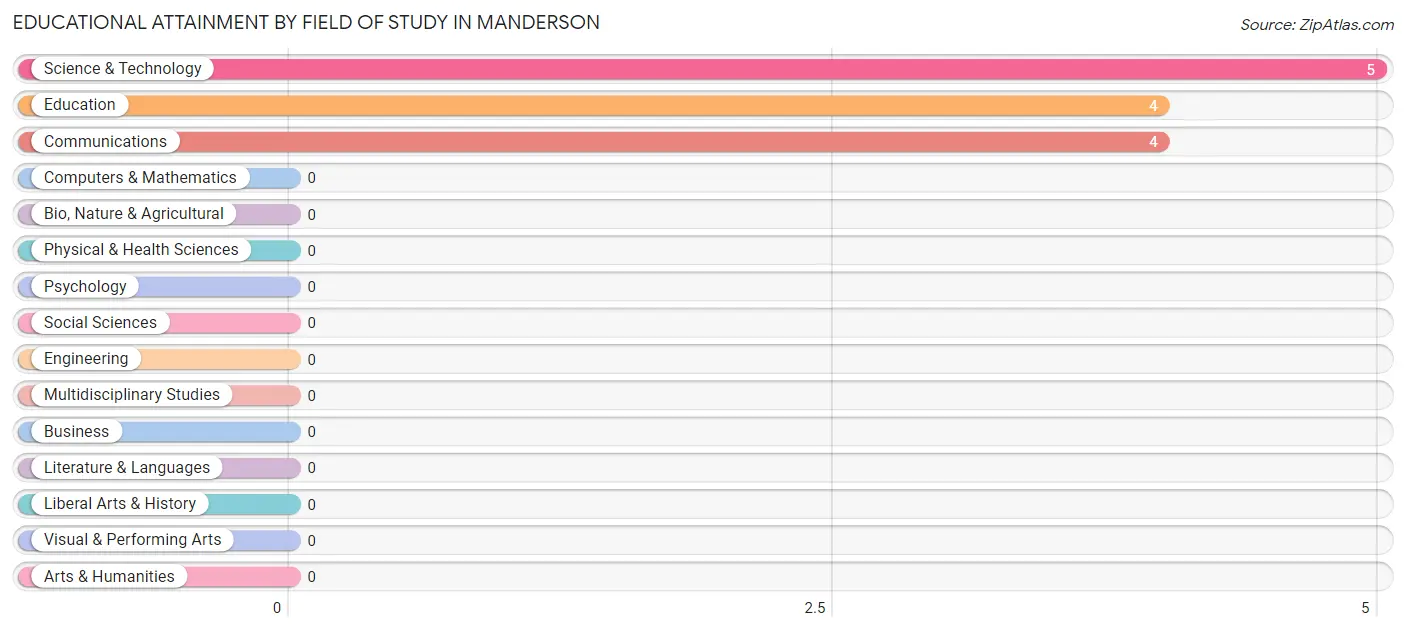
| Field of Study | # Graduates | % Graduates |
| Computers & Mathematics | 0 | 0.0% |
| Bio, Nature & Agricultural | 0 | 0.0% |
| Physical & Health Sciences | 0 | 0.0% |
| Psychology | 0 | 0.0% |
| Social Sciences | 0 | 0.0% |
| Engineering | 0 | 0.0% |
| Multidisciplinary Studies | 0 | 0.0% |
| Science & Technology | 5 | 38.5% |
| Business | 0 | 0.0% |
| Education | 4 | 30.8% |
| Literature & Languages | 0 | 0.0% |
| Liberal Arts & History | 0 | 0.0% |
| Visual & Performing Arts | 0 | 0.0% |
| Communications | 4 | 30.8% |
| Arts & Humanities | 0 | 0.0% |
| Total | 13 | 100.0% |
Transportation & Commute in Manderson
Vehicle Availability by Sex in Manderson
The most prevalent vehicle ownership categories in Manderson are males with 3 vehicles (11, accounting for 42.3%) and females with 3 vehicles (18, making up 19.3%).
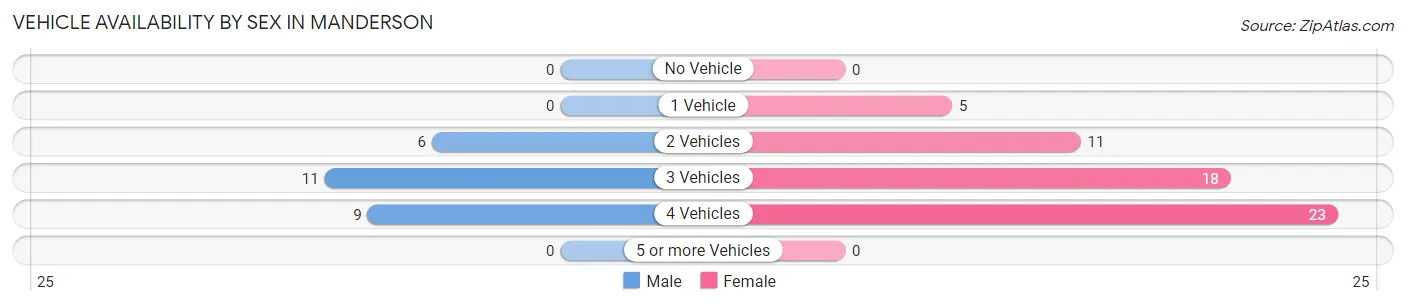
| Vehicles Available | Male | Female |
| No Vehicle | 0 (0.0%) | 0 (0.0%) |
| 1 Vehicle | 0 (0.0%) | 5 (8.8%) |
| 2 Vehicles | 6 (23.1%) | 11 (19.3%) |
| 3 Vehicles | 11 (42.3%) | 18 (31.6%) |
| 4 Vehicles | 9 (34.6%) | 23 (40.4%) |
| 5 or more Vehicles | 0 (0.0%) | 0 (0.0%) |
| Total | 26 (100.0%) | 57 (100.0%) |
Commute Time in Manderson
The most frequently occuring commute durations in Manderson are 20 to 24 minutes (30 commuters, 36.1%), 5 to 9 minutes (19 commuters, 22.9%), and less than 5 minutes (14 commuters, 16.9%).
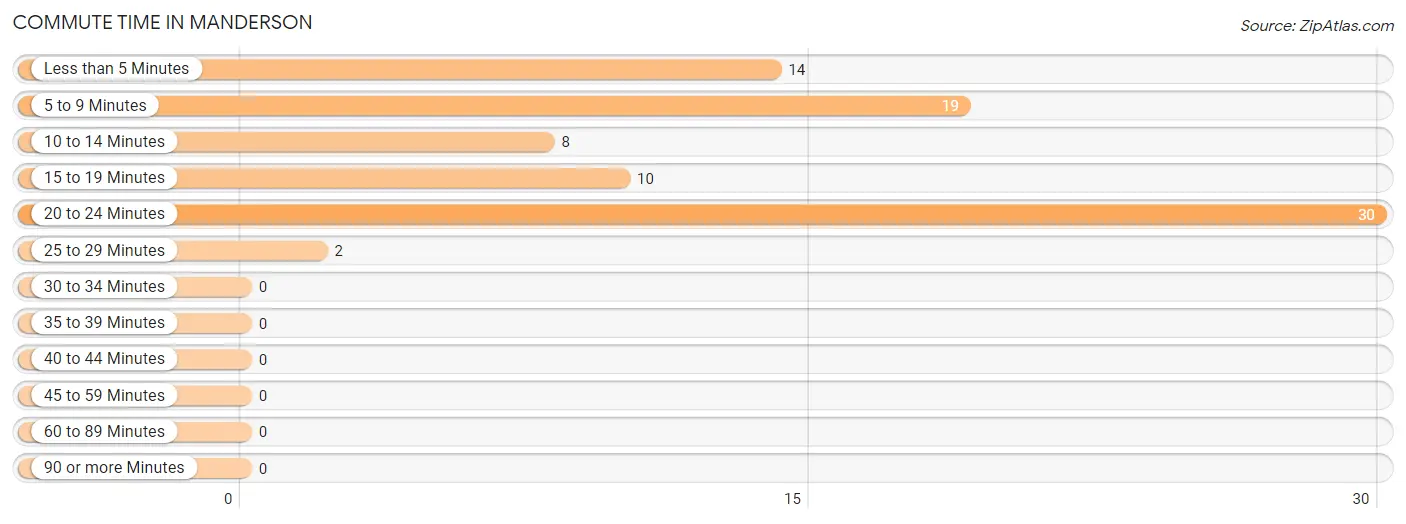
| Commute Time | # Commuters | % Commuters |
| Less than 5 Minutes | 14 | 16.9% |
| 5 to 9 Minutes | 19 | 22.9% |
| 10 to 14 Minutes | 8 | 9.6% |
| 15 to 19 Minutes | 10 | 12.0% |
| 20 to 24 Minutes | 30 | 36.1% |
| 25 to 29 Minutes | 2 | 2.4% |
| 30 to 34 Minutes | 0 | 0.0% |
| 35 to 39 Minutes | 0 | 0.0% |
| 40 to 44 Minutes | 0 | 0.0% |
| 45 to 59 Minutes | 0 | 0.0% |
| 60 to 89 Minutes | 0 | 0.0% |
| 90 or more Minutes | 0 | 0.0% |
Commute Time by Sex in Manderson
The most common commute times in Manderson are less than 5 minutes (9 commuters, 34.6%) for males and 20 to 24 minutes (21 commuters, 36.8%) for females.
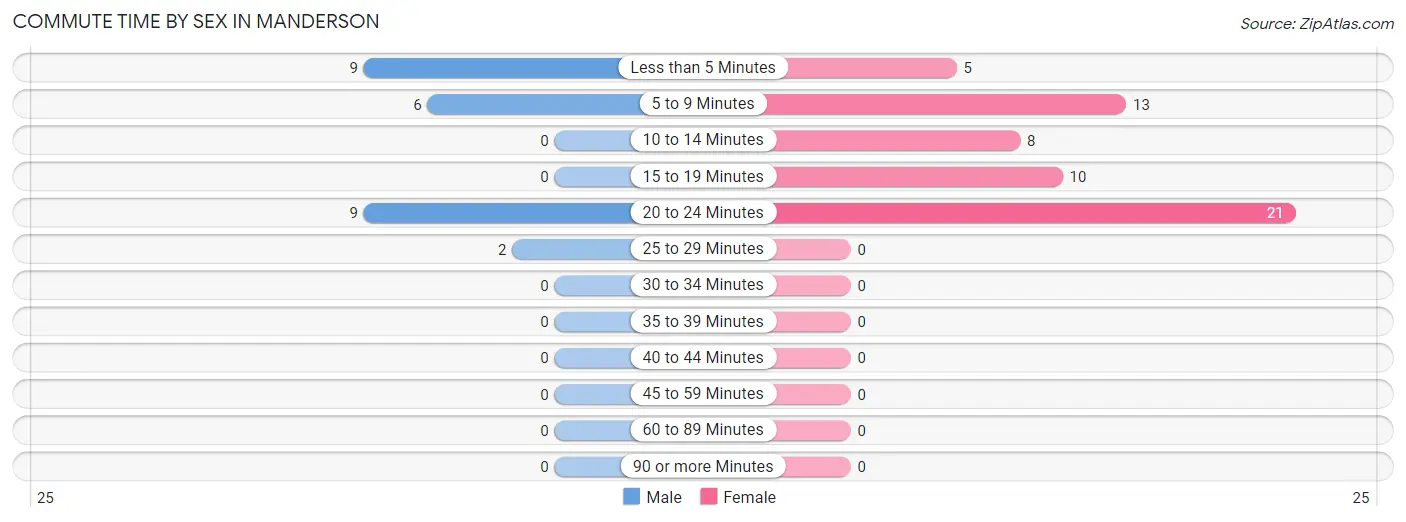
| Commute Time | Male | Female |
| Less than 5 Minutes | 9 (34.6%) | 5 (8.8%) |
| 5 to 9 Minutes | 6 (23.1%) | 13 (22.8%) |
| 10 to 14 Minutes | 0 (0.0%) | 8 (14.0%) |
| 15 to 19 Minutes | 0 (0.0%) | 10 (17.5%) |
| 20 to 24 Minutes | 9 (34.6%) | 21 (36.8%) |
| 25 to 29 Minutes | 2 (7.7%) | 0 (0.0%) |
| 30 to 34 Minutes | 0 (0.0%) | 0 (0.0%) |
| 35 to 39 Minutes | 0 (0.0%) | 0 (0.0%) |
| 40 to 44 Minutes | 0 (0.0%) | 0 (0.0%) |
| 45 to 59 Minutes | 0 (0.0%) | 0 (0.0%) |
| 60 to 89 Minutes | 0 (0.0%) | 0 (0.0%) |
| 90 or more Minutes | 0 (0.0%) | 0 (0.0%) |
Time of Departure to Work by Sex in Manderson
The most frequent times of departure to work in Manderson are 8:00 AM to 8:29 AM (18, 69.2%) for males and 8:00 AM to 8:29 AM (16, 28.1%) for females.
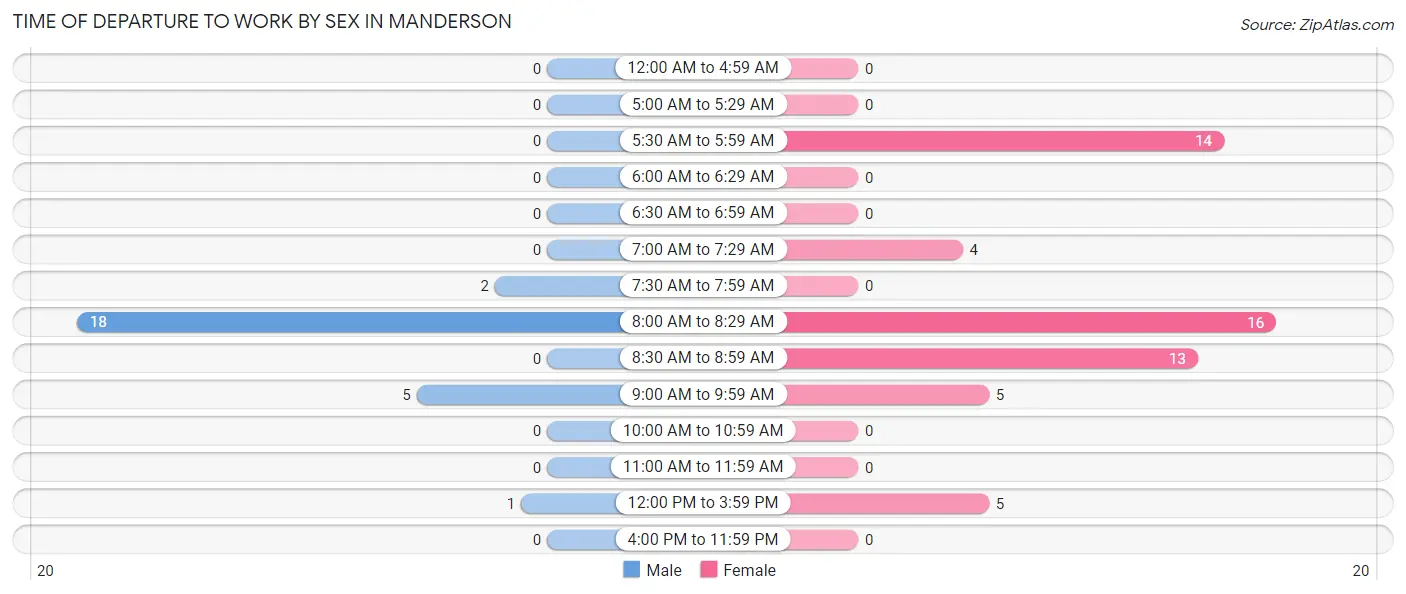
| Time of Departure | Male | Female |
| 12:00 AM to 4:59 AM | 0 (0.0%) | 0 (0.0%) |
| 5:00 AM to 5:29 AM | 0 (0.0%) | 0 (0.0%) |
| 5:30 AM to 5:59 AM | 0 (0.0%) | 14 (24.6%) |
| 6:00 AM to 6:29 AM | 0 (0.0%) | 0 (0.0%) |
| 6:30 AM to 6:59 AM | 0 (0.0%) | 0 (0.0%) |
| 7:00 AM to 7:29 AM | 0 (0.0%) | 4 (7.0%) |
| 7:30 AM to 7:59 AM | 2 (7.7%) | 0 (0.0%) |
| 8:00 AM to 8:29 AM | 18 (69.2%) | 16 (28.1%) |
| 8:30 AM to 8:59 AM | 0 (0.0%) | 13 (22.8%) |
| 9:00 AM to 9:59 AM | 5 (19.2%) | 5 (8.8%) |
| 10:00 AM to 10:59 AM | 0 (0.0%) | 0 (0.0%) |
| 11:00 AM to 11:59 AM | 0 (0.0%) | 0 (0.0%) |
| 12:00 PM to 3:59 PM | 1 (3.8%) | 5 (8.8%) |
| 4:00 PM to 11:59 PM | 0 (0.0%) | 0 (0.0%) |
| Total | 26 (100.0%) | 57 (100.0%) |
Housing Occupancy in Manderson
Occupancy by Ownership in Manderson
Of the total 53 dwellings in Manderson, owner-occupied units account for 47 (88.7%), while renter-occupied units make up 6 (11.3%).
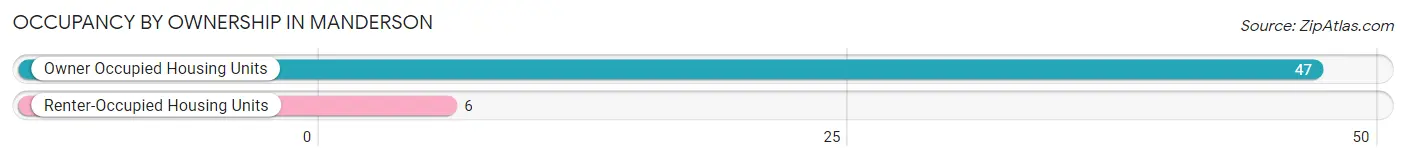
| Occupancy | # Housing Units | % Housing Units |
| Owner Occupied Housing Units | 47 | 88.7% |
| Renter-Occupied Housing Units | 6 | 11.3% |
| Total Occupied Housing Units | 53 | 100.0% |
Occupancy by Household Size in Manderson

| Household Size | # Housing Units | % Housing Units |
| 1-Person Household | 20 | 37.7% |
| 2-Person Household | 19 | 35.8% |
| 3-Person Household | 5 | 9.4% |
| 4+ Person Household | 9 | 17.0% |
| Total Housing Units | 53 | 100.0% |
Occupancy by Ownership by Household Size in Manderson
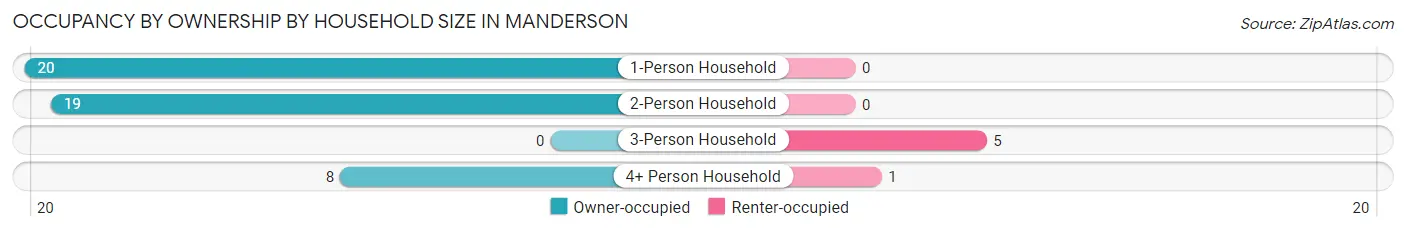
| Household Size | Owner-occupied | Renter-occupied |
| 1-Person Household | 20 (100.0%) | 0 (0.0%) |
| 2-Person Household | 19 (100.0%) | 0 (0.0%) |
| 3-Person Household | 0 (0.0%) | 5 (100.0%) |
| 4+ Person Household | 8 (88.9%) | 1 (11.1%) |
| Total Housing Units | 47 (88.7%) | 6 (11.3%) |
Occupancy by Educational Attainment in Manderson
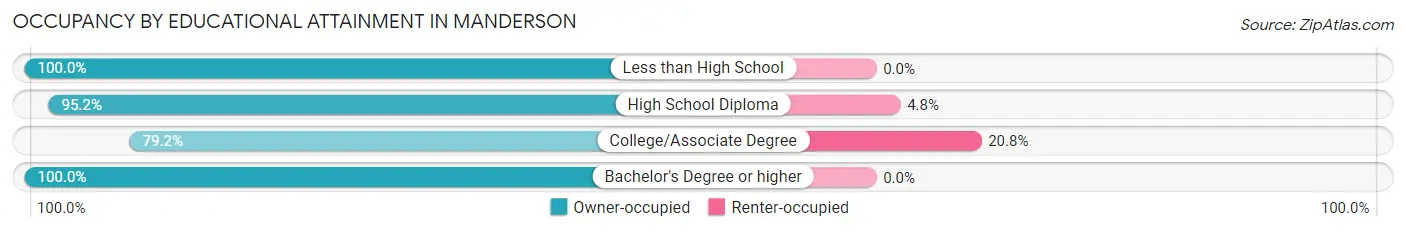
| Household Size | Owner-occupied | Renter-occupied |
| Less than High School | 4 (100.0%) | 0 (0.0%) |
| High School Diploma | 20 (95.2%) | 1 (4.8%) |
| College/Associate Degree | 19 (79.2%) | 5 (20.8%) |
| Bachelor's Degree or higher | 4 (100.0%) | 0 (0.0%) |
Occupancy by Age of Householder in Manderson
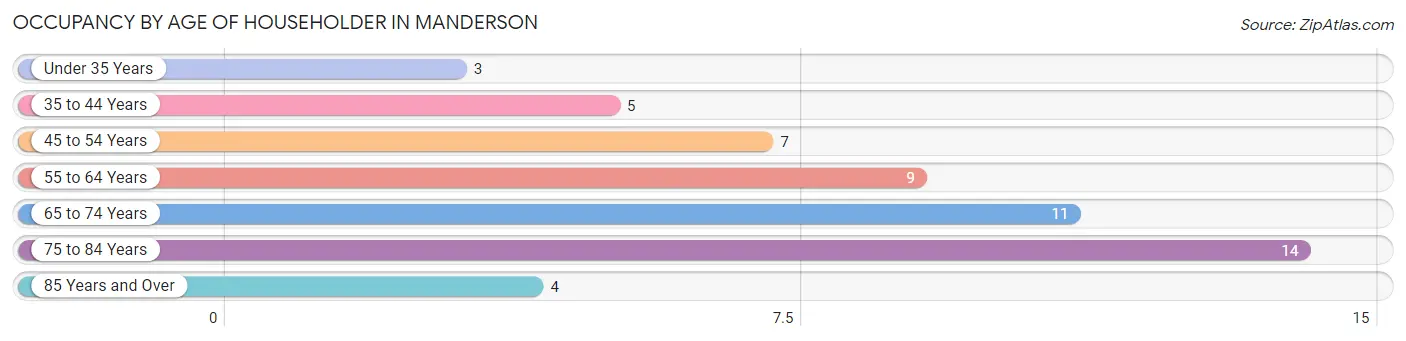
| Age Bracket | # Households | % Households |
| Under 35 Years | 3 | 5.7% |
| 35 to 44 Years | 5 | 9.4% |
| 45 to 54 Years | 7 | 13.2% |
| 55 to 64 Years | 9 | 17.0% |
| 65 to 74 Years | 11 | 20.7% |
| 75 to 84 Years | 14 | 26.4% |
| 85 Years and Over | 4 | 7.5% |
| Total | 53 | 100.0% |
Housing Finances in Manderson
Median Income by Occupancy in Manderson
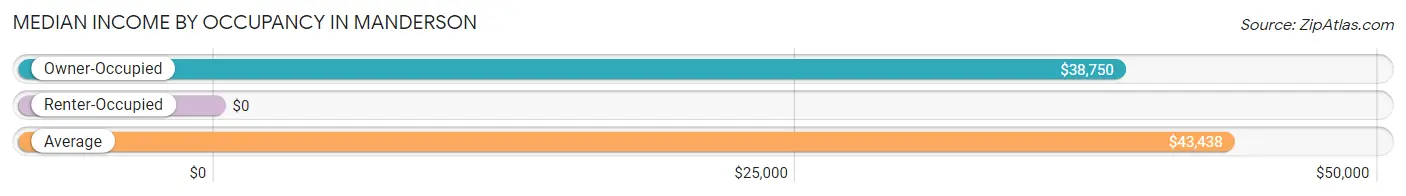
| Occupancy Type | # Households | Median Income |
| Owner-Occupied | 47 (88.7%) | $38,750 |
| Renter-Occupied | 6 (11.3%) | $0 |
| Average | 53 (100.0%) | $43,438 |
Occupancy by Householder Income Bracket in Manderson
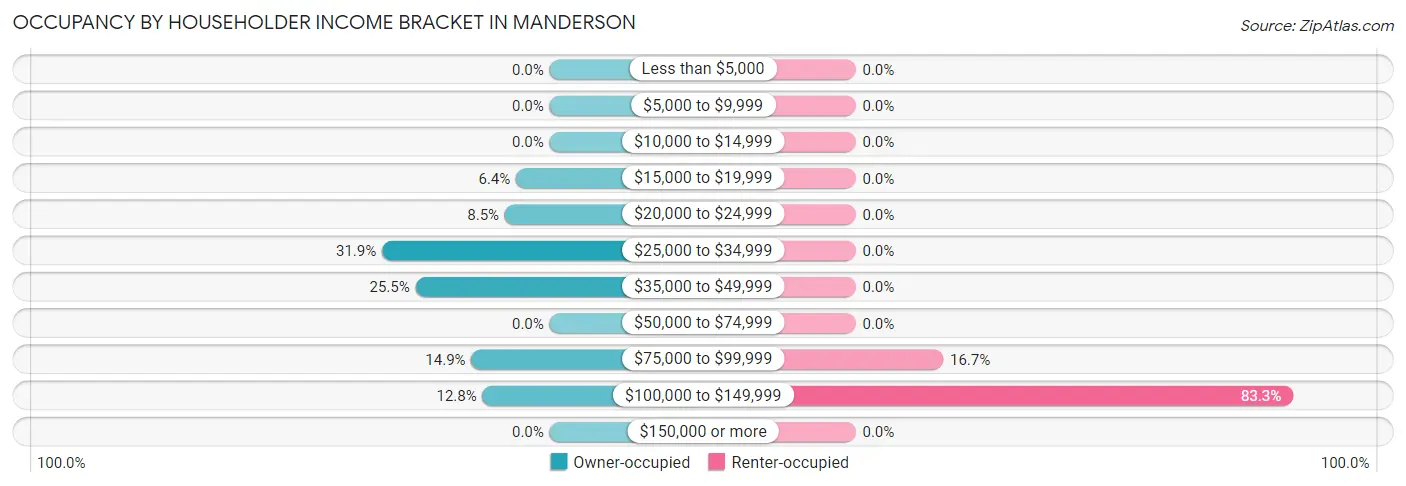
| Income Bracket | Owner-occupied | Renter-occupied |
| Less than $5,000 | 0 (0.0%) | 0 (0.0%) |
| $5,000 to $9,999 | 0 (0.0%) | 0 (0.0%) |
| $10,000 to $14,999 | 0 (0.0%) | 0 (0.0%) |
| $15,000 to $19,999 | 3 (6.4%) | 0 (0.0%) |
| $20,000 to $24,999 | 4 (8.5%) | 0 (0.0%) |
| $25,000 to $34,999 | 15 (31.9%) | 0 (0.0%) |
| $35,000 to $49,999 | 12 (25.5%) | 0 (0.0%) |
| $50,000 to $74,999 | 0 (0.0%) | 0 (0.0%) |
| $75,000 to $99,999 | 7 (14.9%) | 1 (16.7%) |
| $100,000 to $149,999 | 6 (12.8%) | 5 (83.3%) |
| $150,000 or more | 0 (0.0%) | 0 (0.0%) |
| Total | 47 (100.0%) | 6 (100.0%) |
Monthly Housing Cost Tiers in Manderson
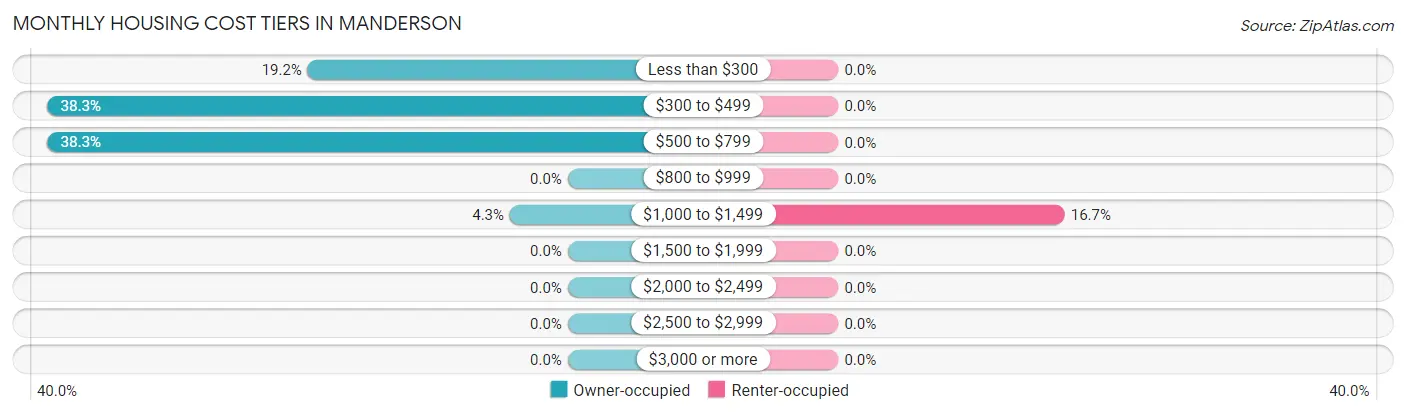
| Monthly Cost | Owner-occupied | Renter-occupied |
| Less than $300 | 9 (19.2%) | 0 (0.0%) |
| $300 to $499 | 18 (38.3%) | 0 (0.0%) |
| $500 to $799 | 18 (38.3%) | 0 (0.0%) |
| $800 to $999 | 0 (0.0%) | 0 (0.0%) |
| $1,000 to $1,499 | 2 (4.3%) | 1 (16.7%) |
| $1,500 to $1,999 | 0 (0.0%) | 0 (0.0%) |
| $2,000 to $2,499 | 0 (0.0%) | 0 (0.0%) |
| $2,500 to $2,999 | 0 (0.0%) | 0 (0.0%) |
| $3,000 or more | 0 (0.0%) | 0 (0.0%) |
| Total | 47 (100.0%) | 6 (100.0%) |
Physical Housing Characteristics in Manderson
Housing Structures in Manderson
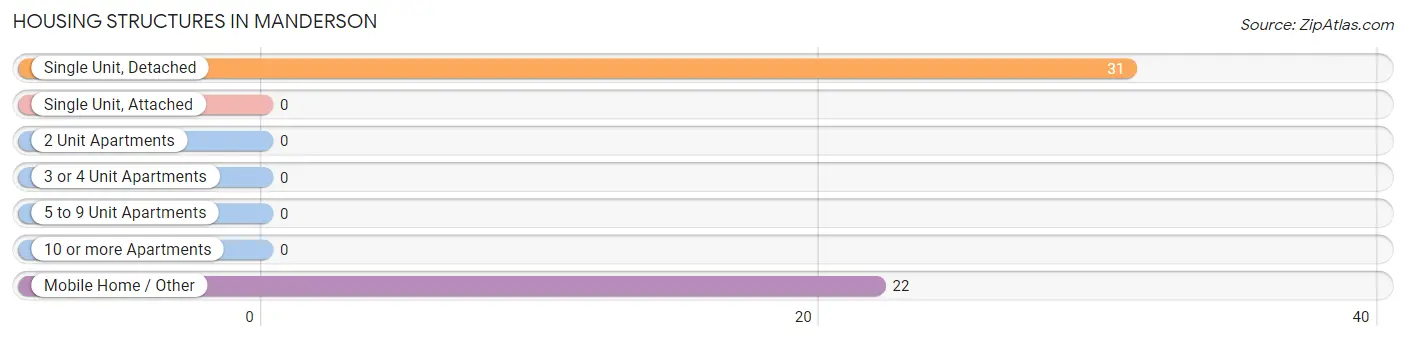
| Structure Type | # Housing Units | % Housing Units |
| Single Unit, Detached | 31 | 58.5% |
| Single Unit, Attached | 0 | 0.0% |
| 2 Unit Apartments | 0 | 0.0% |
| 3 or 4 Unit Apartments | 0 | 0.0% |
| 5 to 9 Unit Apartments | 0 | 0.0% |
| 10 or more Apartments | 0 | 0.0% |
| Mobile Home / Other | 22 | 41.5% |
| Total | 53 | 100.0% |
Housing Structures by Occupancy in Manderson
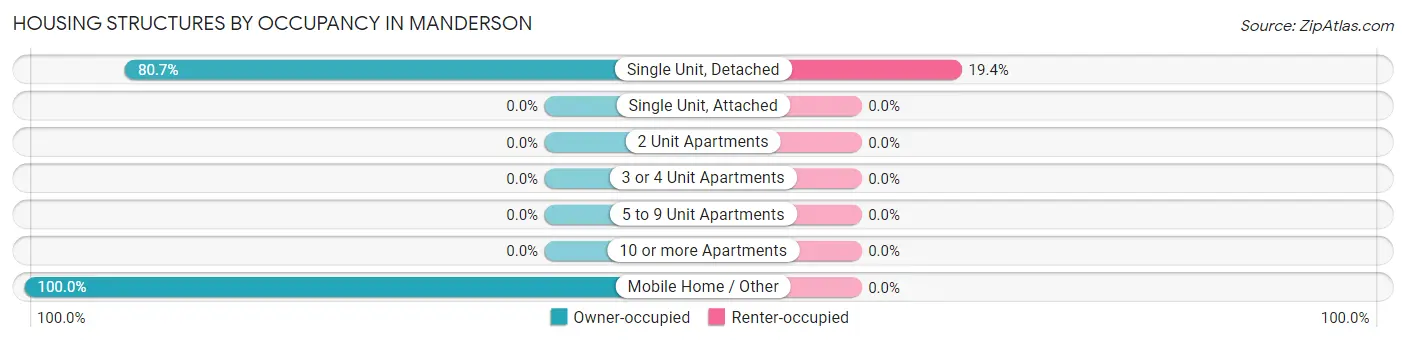
| Structure Type | Owner-occupied | Renter-occupied |
| Single Unit, Detached | 25 (80.6%) | 6 (19.4%) |
| Single Unit, Attached | 0 (0.0%) | 0 (0.0%) |
| 2 Unit Apartments | 0 (0.0%) | 0 (0.0%) |
| 3 or 4 Unit Apartments | 0 (0.0%) | 0 (0.0%) |
| 5 to 9 Unit Apartments | 0 (0.0%) | 0 (0.0%) |
| 10 or more Apartments | 0 (0.0%) | 0 (0.0%) |
| Mobile Home / Other | 22 (100.0%) | 0 (0.0%) |
| Total | 47 (88.7%) | 6 (11.3%) |
Housing Structures by Number of Rooms in Manderson
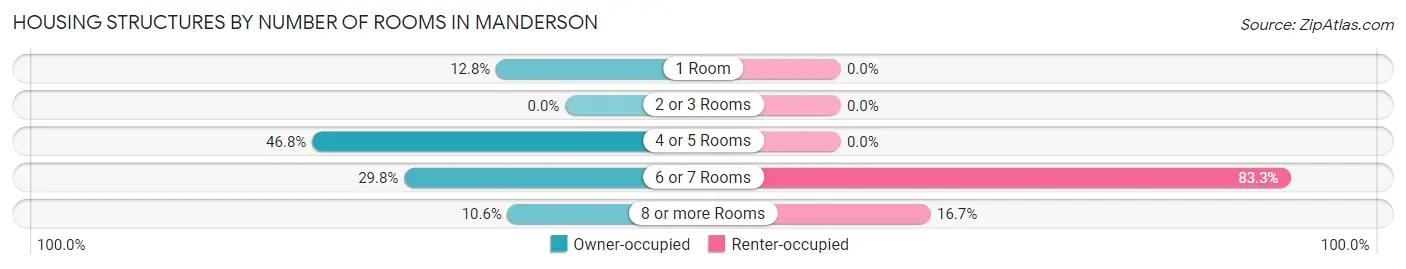
| Number of Rooms | Owner-occupied | Renter-occupied |
| 1 Room | 6 (12.8%) | 0 (0.0%) |
| 2 or 3 Rooms | 0 (0.0%) | 0 (0.0%) |
| 4 or 5 Rooms | 22 (46.8%) | 0 (0.0%) |
| 6 or 7 Rooms | 14 (29.8%) | 5 (83.3%) |
| 8 or more Rooms | 5 (10.6%) | 1 (16.7%) |
| Total | 47 (100.0%) | 6 (100.0%) |
Housing Structure by Heating Type in Manderson
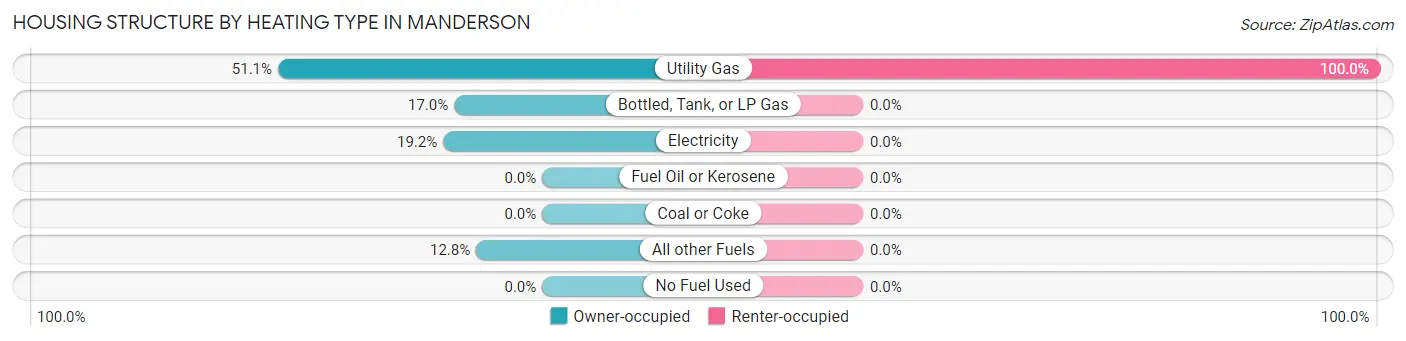
| Heating Type | Owner-occupied | Renter-occupied |
| Utility Gas | 24 (51.1%) | 6 (100.0%) |
| Bottled, Tank, or LP Gas | 8 (17.0%) | 0 (0.0%) |
| Electricity | 9 (19.2%) | 0 (0.0%) |
| Fuel Oil or Kerosene | 0 (0.0%) | 0 (0.0%) |
| Coal or Coke | 0 (0.0%) | 0 (0.0%) |
| All other Fuels | 6 (12.8%) | 0 (0.0%) |
| No Fuel Used | 0 (0.0%) | 0 (0.0%) |
| Total | 47 (100.0%) | 6 (100.0%) |
Household Vehicle Usage in Manderson
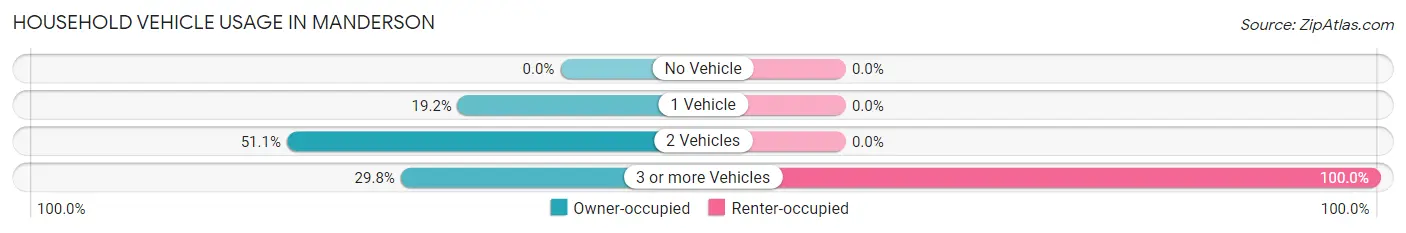
| Vehicles per Household | Owner-occupied | Renter-occupied |
| No Vehicle | 0 (0.0%) | 0 (0.0%) |
| 1 Vehicle | 9 (19.2%) | 0 (0.0%) |
| 2 Vehicles | 24 (51.1%) | 0 (0.0%) |
| 3 or more Vehicles | 14 (29.8%) | 6 (100.0%) |
| Total | 47 (100.0%) | 6 (100.0%) |
Real Estate & Mortgages in Manderson
Real Estate and Mortgage Overview in Manderson
| Characteristic | Without Mortgage | With Mortgage |
| Housing Units | 32 | 15 |
| Median Property Value | - | - |
| Median Household Income | $30,625 | $0 |
| Monthly Housing Costs | $335 | $0 |
| Real Estate Taxes | $300 | $6 |
Property Value by Mortgage Status in Manderson
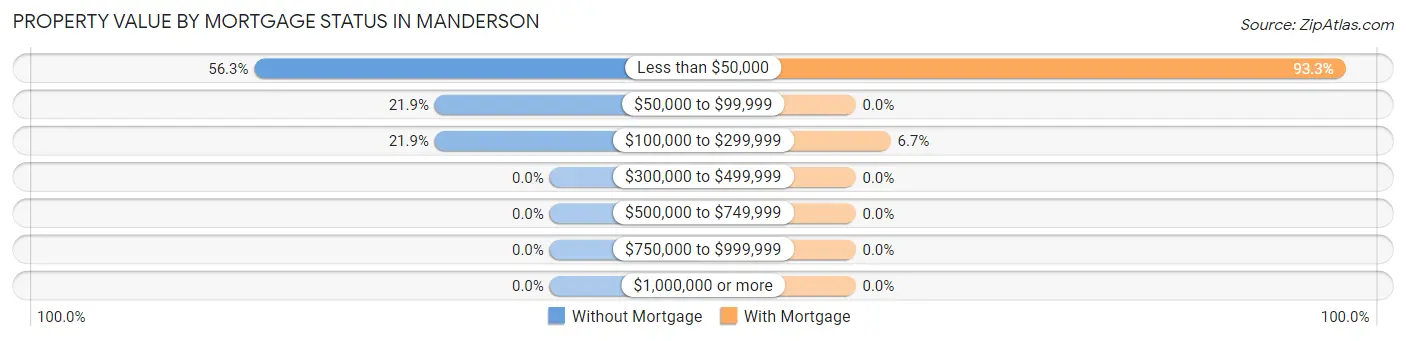
| Property Value | Without Mortgage | With Mortgage |
| Less than $50,000 | 18 (56.2%) | 14 (93.3%) |
| $50,000 to $99,999 | 7 (21.9%) | 0 (0.0%) |
| $100,000 to $299,999 | 7 (21.9%) | 1 (6.7%) |
| $300,000 to $499,999 | 0 (0.0%) | 0 (0.0%) |
| $500,000 to $749,999 | 0 (0.0%) | 0 (0.0%) |
| $750,000 to $999,999 | 0 (0.0%) | 0 (0.0%) |
| $1,000,000 or more | 0 (0.0%) | 0 (0.0%) |
| Total | 32 (100.0%) | 15 (100.0%) |
Household Income by Mortgage Status in Manderson
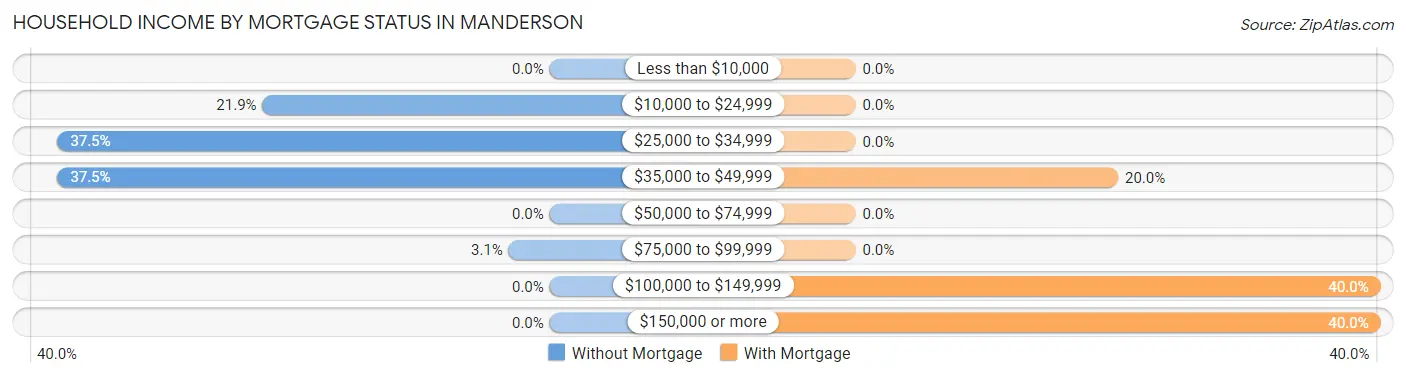
| Household Income | Without Mortgage | With Mortgage |
| Less than $10,000 | 0 (0.0%) | 0 (0.0%) |
| $10,000 to $24,999 | 7 (21.9%) | 0 (0.0%) |
| $25,000 to $34,999 | 12 (37.5%) | 0 (0.0%) |
| $35,000 to $49,999 | 12 (37.5%) | 3 (20.0%) |
| $50,000 to $74,999 | 0 (0.0%) | 0 (0.0%) |
| $75,000 to $99,999 | 1 (3.1%) | 0 (0.0%) |
| $100,000 to $149,999 | 0 (0.0%) | 6 (40.0%) |
| $150,000 or more | 0 (0.0%) | 6 (40.0%) |
| Total | 32 (100.0%) | 15 (100.0%) |
Property Value to Household Income Ratio in Manderson
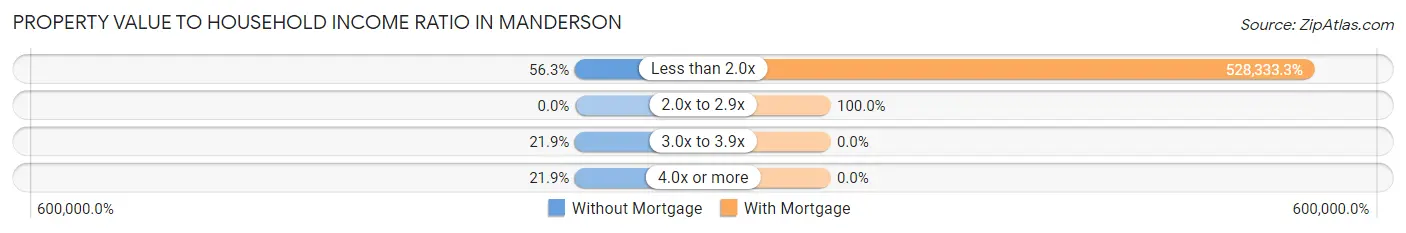
| Value-to-Income Ratio | Without Mortgage | With Mortgage |
| Less than 2.0x | 18 (56.2%) | 79,250 (528,333.3%) |
| 2.0x to 2.9x | 0 (0.0%) | 15 (100.0%) |
| 3.0x to 3.9x | 7 (21.9%) | 0 (0.0%) |
| 4.0x or more | 7 (21.9%) | 0 (0.0%) |
| Total | 32 (100.0%) | 15 (100.0%) |
Real Estate Taxes by Mortgage Status in Manderson
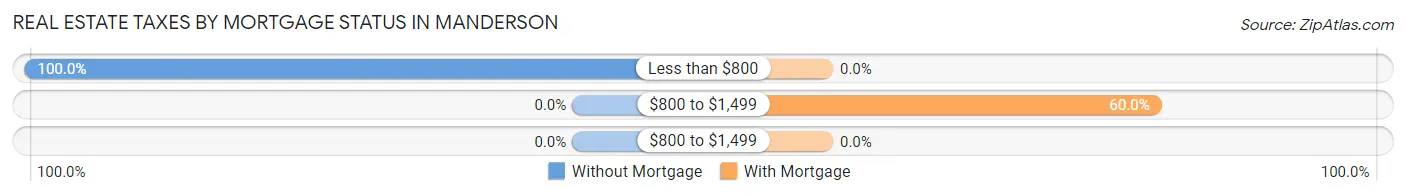
| Property Taxes | Without Mortgage | With Mortgage |
| Less than $800 | 32 (100.0%) | 0 (0.0%) |
| $800 to $1,499 | 0 (0.0%) | 9 (60.0%) |
| $800 to $1,499 | 0 (0.0%) | 0 (0.0%) |
| Total | 32 (100.0%) | 15 (100.0%) |
Health & Disability in Manderson
Health Insurance Coverage by Age in Manderson
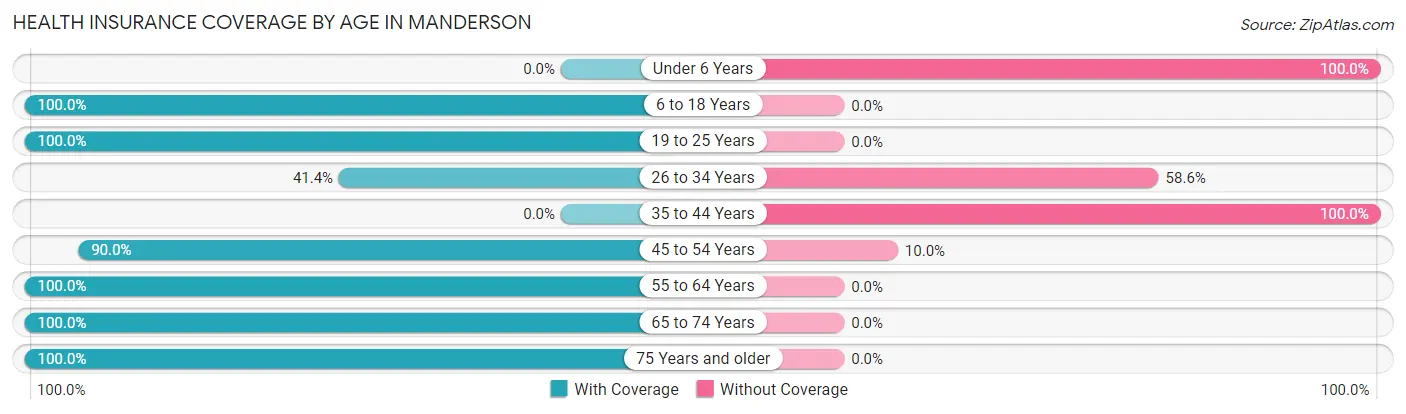
| Age Bracket | With Coverage | Without Coverage |
| Under 6 Years | 0 (0.0%) | 4 (100.0%) |
| 6 to 18 Years | 7 (100.0%) | 0 (0.0%) |
| 19 to 25 Years | 8 (100.0%) | 0 (0.0%) |
| 26 to 34 Years | 12 (41.4%) | 17 (58.6%) |
| 35 to 44 Years | 0 (0.0%) | 5 (100.0%) |
| 45 to 54 Years | 9 (90.0%) | 1 (10.0%) |
| 55 to 64 Years | 15 (100.0%) | 0 (0.0%) |
| 65 to 74 Years | 12 (100.0%) | 0 (0.0%) |
| 75 Years and older | 31 (100.0%) | 0 (0.0%) |
| Total | 94 (77.7%) | 27 (22.3%) |
Health Insurance Coverage by Citizenship Status in Manderson
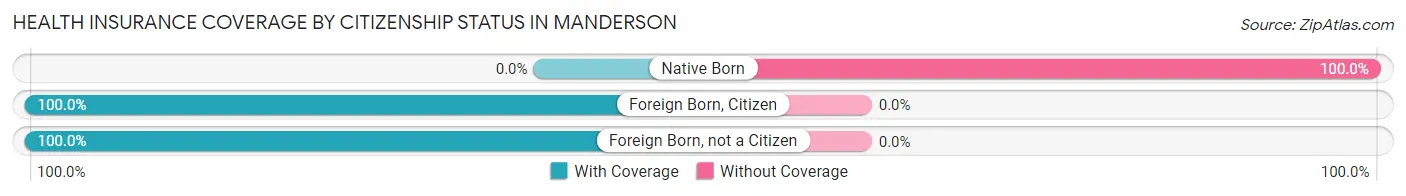
| Citizenship Status | With Coverage | Without Coverage |
| Native Born | 0 (0.0%) | 4 (100.0%) |
| Foreign Born, Citizen | 7 (100.0%) | 0 (0.0%) |
| Foreign Born, not a Citizen | 8 (100.0%) | 0 (0.0%) |
Health Insurance Coverage by Household Income in Manderson
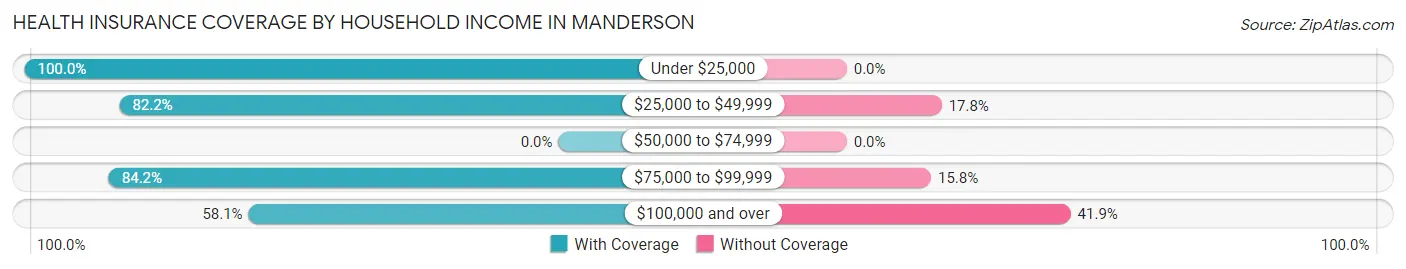
| Household Income | With Coverage | Without Coverage |
| Under $25,000 | 7 (100.0%) | 0 (0.0%) |
| $25,000 to $49,999 | 37 (82.2%) | 8 (17.8%) |
| $50,000 to $74,999 | 0 (0.0%) | 0 (0.0%) |
| $75,000 to $99,999 | 32 (84.2%) | 6 (15.8%) |
| $100,000 and over | 18 (58.1%) | 13 (41.9%) |
Public vs Private Health Insurance Coverage by Age in Manderson
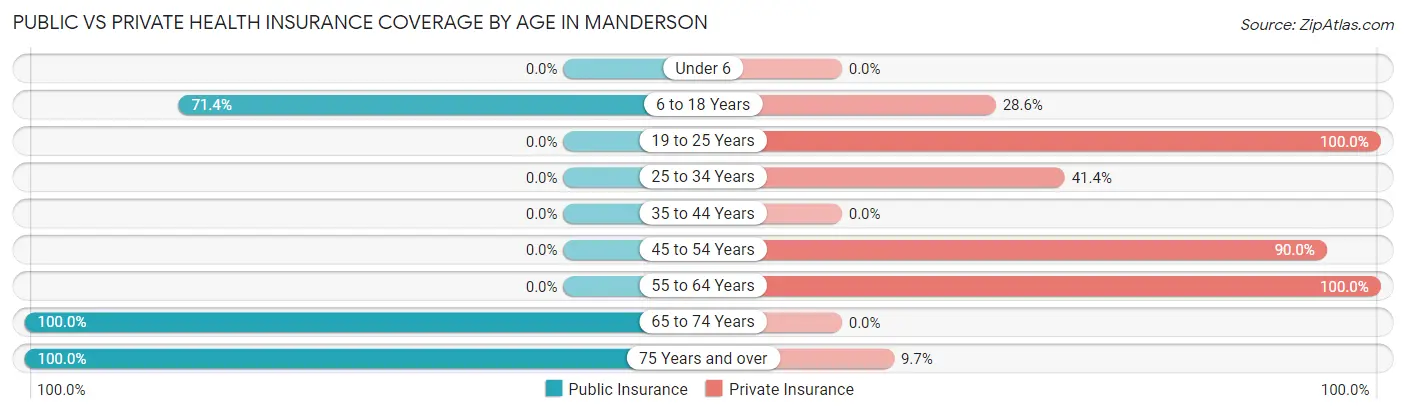
| Age Bracket | Public Insurance | Private Insurance |
| Under 6 | 0 (0.0%) | 0 (0.0%) |
| 6 to 18 Years | 5 (71.4%) | 2 (28.6%) |
| 19 to 25 Years | 0 (0.0%) | 8 (100.0%) |
| 25 to 34 Years | 0 (0.0%) | 12 (41.4%) |
| 35 to 44 Years | 0 (0.0%) | 0 (0.0%) |
| 45 to 54 Years | 0 (0.0%) | 9 (90.0%) |
| 55 to 64 Years | 0 (0.0%) | 15 (100.0%) |
| 65 to 74 Years | 12 (100.0%) | 0 (0.0%) |
| 75 Years and over | 31 (100.0%) | 3 (9.7%) |
| Total | 48 (39.7%) | 49 (40.5%) |
Disability Status by Sex by Age in Manderson
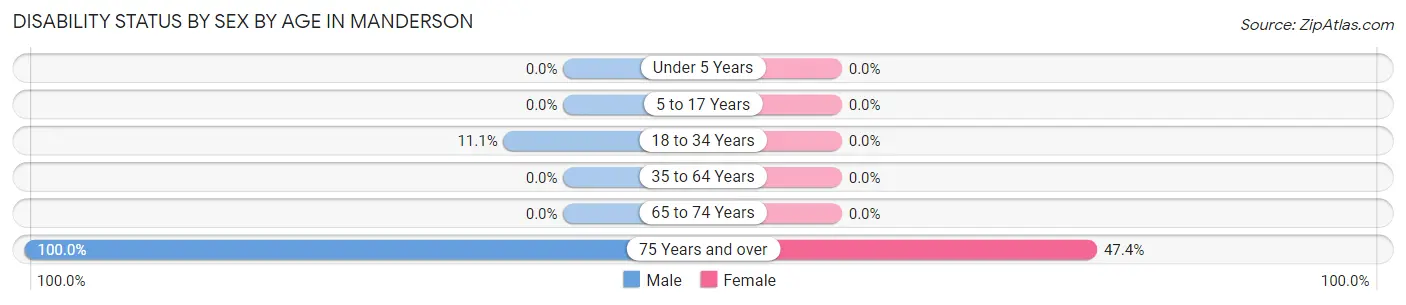
| Age Bracket | Male | Female |
| Under 5 Years | 0 (0.0%) | 0 (0.0%) |
| 5 to 17 Years | 0 (0.0%) | 0 (0.0%) |
| 18 to 34 Years | 1 (11.1%) | 0 (0.0%) |
| 35 to 64 Years | 0 (0.0%) | 0 (0.0%) |
| 65 to 74 Years | 0 (0.0%) | 0 (0.0%) |
| 75 Years and over | 12 (100.0%) | 9 (47.4%) |
Disability Class by Sex by Age in Manderson
Disability Class: Hearing Difficulty
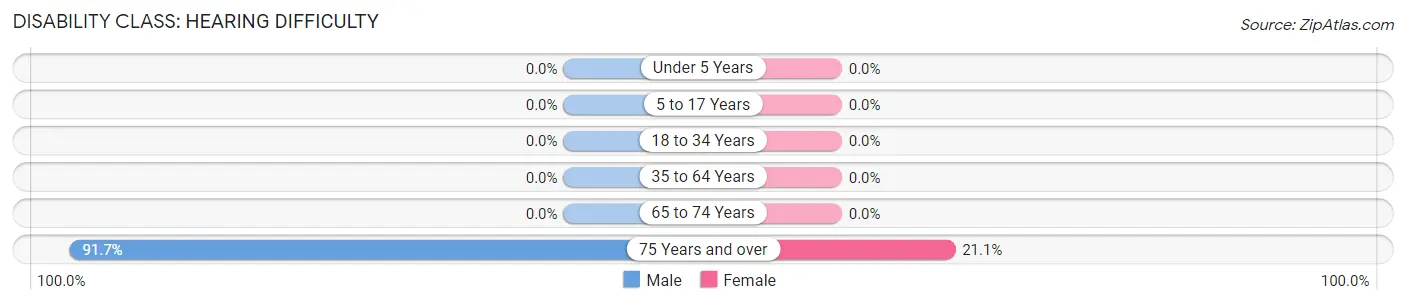
| Age Bracket | Male | Female |
| Under 5 Years | 0 (0.0%) | 0 (0.0%) |
| 5 to 17 Years | 0 (0.0%) | 0 (0.0%) |
| 18 to 34 Years | 0 (0.0%) | 0 (0.0%) |
| 35 to 64 Years | 0 (0.0%) | 0 (0.0%) |
| 65 to 74 Years | 0 (0.0%) | 0 (0.0%) |
| 75 Years and over | 11 (91.7%) | 4 (21.0%) |
Disability Class: Vision Difficulty
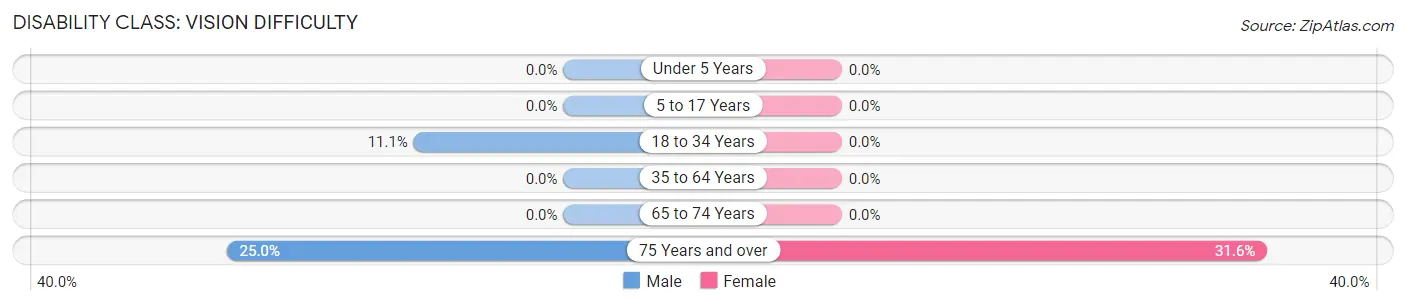
| Age Bracket | Male | Female |
| Under 5 Years | 0 (0.0%) | 0 (0.0%) |
| 5 to 17 Years | 0 (0.0%) | 0 (0.0%) |
| 18 to 34 Years | 1 (11.1%) | 0 (0.0%) |
| 35 to 64 Years | 0 (0.0%) | 0 (0.0%) |
| 65 to 74 Years | 0 (0.0%) | 0 (0.0%) |
| 75 Years and over | 3 (25.0%) | 6 (31.6%) |
Disability Class: Cognitive Difficulty
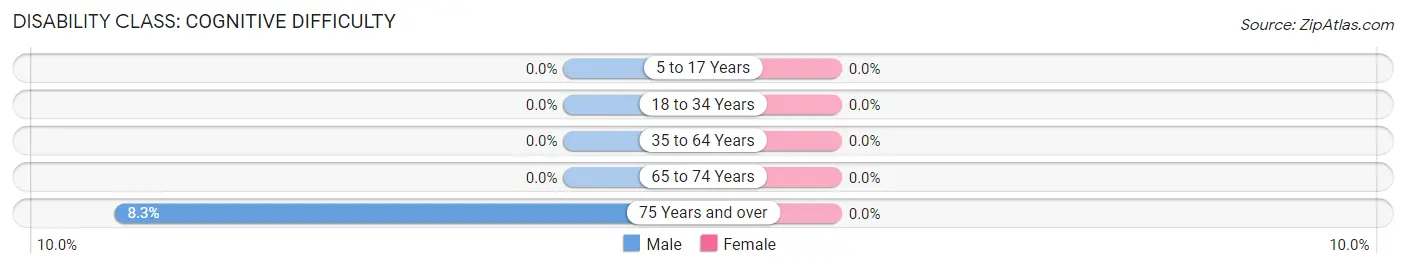
| Age Bracket | Male | Female |
| 5 to 17 Years | 0 (0.0%) | 0 (0.0%) |
| 18 to 34 Years | 0 (0.0%) | 0 (0.0%) |
| 35 to 64 Years | 0 (0.0%) | 0 (0.0%) |
| 65 to 74 Years | 0 (0.0%) | 0 (0.0%) |
| 75 Years and over | 1 (8.3%) | 0 (0.0%) |
Disability Class: Ambulatory Difficulty
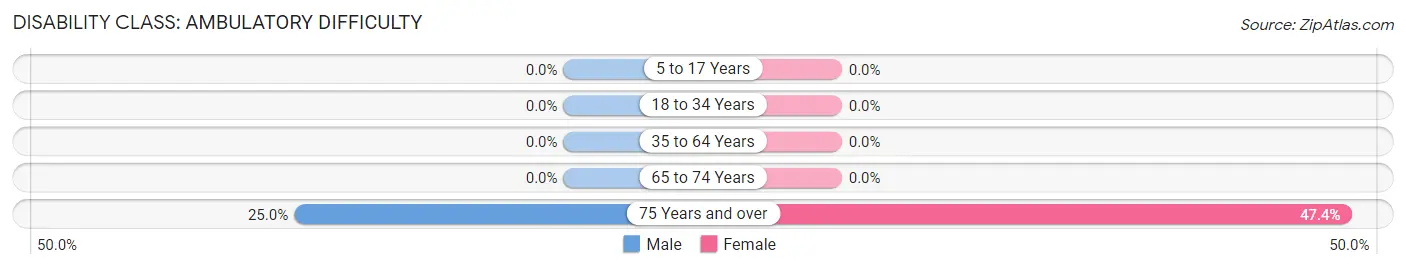
| Age Bracket | Male | Female |
| 5 to 17 Years | 0 (0.0%) | 0 (0.0%) |
| 18 to 34 Years | 0 (0.0%) | 0 (0.0%) |
| 35 to 64 Years | 0 (0.0%) | 0 (0.0%) |
| 65 to 74 Years | 0 (0.0%) | 0 (0.0%) |
| 75 Years and over | 3 (25.0%) | 9 (47.4%) |
Disability Class: Self-Care Difficulty
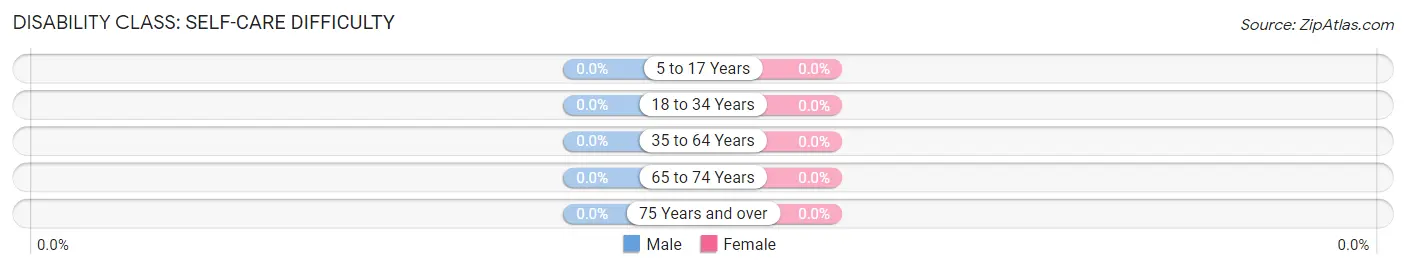
| Age Bracket | Male | Female |
| 5 to 17 Years | 0 (0.0%) | 0 (0.0%) |
| 18 to 34 Years | 0 (0.0%) | 0 (0.0%) |
| 35 to 64 Years | 0 (0.0%) | 0 (0.0%) |
| 65 to 74 Years | 0 (0.0%) | 0 (0.0%) |
| 75 Years and over | 0 (0.0%) | 0 (0.0%) |
Technology Access in Manderson
Computing Device Access in Manderson
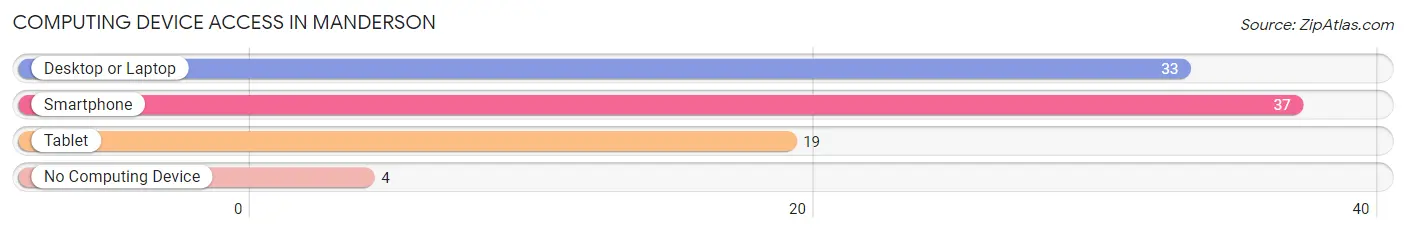
| Device Type | # Households | % Households |
| Desktop or Laptop | 33 | 62.3% |
| Smartphone | 37 | 69.8% |
| Tablet | 19 | 35.8% |
| No Computing Device | 4 | 7.5% |
| Total | 53 | 100.0% |
Internet Access in Manderson
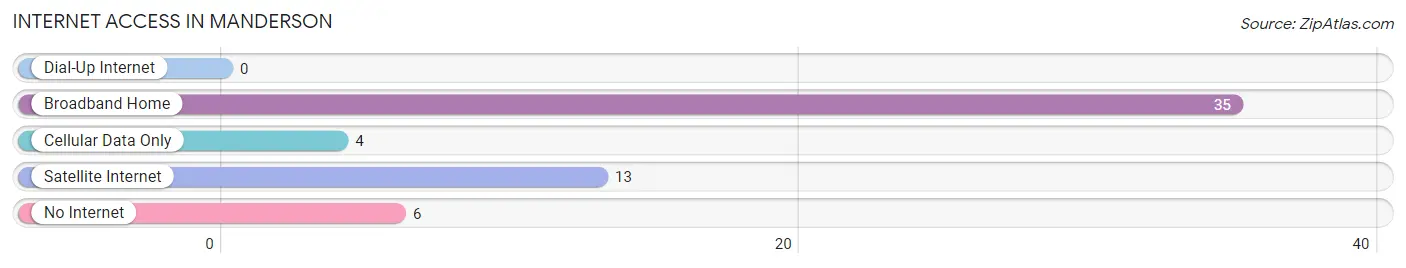
| Internet Type | # Households | % Households |
| Dial-Up Internet | 0 | 0.0% |
| Broadband Home | 35 | 66.0% |
| Cellular Data Only | 4 | 7.5% |
| Satellite Internet | 13 | 24.5% |
| No Internet | 6 | 11.3% |
| Total | 53 | 100.0% |
Manderson Summary
Manderson is a small town located in Big Horn County, Wyoming. It is situated on the banks of the Little Big Horn River, approximately 20 miles south of Sheridan. The town was founded in 1882 and was named after the nearby Manderson Creek. The population of Manderson was estimated to be around 200 people in 2020.
History
The area around Manderson was first inhabited by the Crow Indians, who used the area for hunting and fishing. The first white settlers arrived in the area in the late 1800s, and the town of Manderson was officially founded in 1882. The town was named after the nearby Manderson Creek, which was named after a local rancher, William Manderson.
The town quickly grew and by the early 1900s, it had become a bustling community with a population of over 500 people. The town was home to several businesses, including a hotel, a general store, a blacksmith, and a saloon.
In the early 1900s, the town was also home to a large number of sheep and cattle ranches. The town was also home to a large number of coal mines, which provided employment for many of the town’s residents.
In the late 1900s, the town began to decline as the coal mines closed and the population began to dwindle. By the 2000s, the population had dropped to around 200 people.
Geography
Manderson is located in Big Horn County, Wyoming, approximately 20 miles south of Sheridan. The town is situated on the banks of the Little Big Horn River. The town is surrounded by rolling hills and grasslands, and is located at an elevation of 4,400 feet.
The climate in Manderson is semi-arid, with hot summers and cold winters. The average annual temperature is around 50 degrees Fahrenheit, and the average annual precipitation is around 12 inches.
Economy
The economy of Manderson is largely based on agriculture and ranching. The town is home to several large ranches, which raise cattle and sheep. The town is also home to a number of small businesses, including a general store, a hotel, and a saloon.
The town is also home to a number of coal mines, which provide employment for many of the town’s residents.
Demographics
The population of Manderson was estimated to be around 200 people in 2020. The town is predominantly white, with a small Hispanic population. The median household income in Manderson is around $35,000, and the median home value is around $100,000.
Common Questions
What is Per Capita Income in Manderson?
Per Capita income in Manderson is $28,082.
What is the Median Family Income in Manderson?
Median Family Income in Manderson is $48,000.
What is the Median Household income in Manderson?
Median Household Income in Manderson is $43,438.
What is Inequality or Gini Index in Manderson?
Inequality or Gini Index in Manderson is 0.36.
What is the Total Population of Manderson?
Total Population of Manderson is 121.
What is the Total Male Population of Manderson?
Total Male Population of Manderson is 53.
What is the Total Female Population of Manderson?
Total Female Population of Manderson is 68.
What is the Ratio of Males per 100 Females in Manderson?
There are 77.94 Males per 100 Females in Manderson.
What is the Ratio of Females per 100 Males in Manderson?
There are 128.30 Females per 100 Males in Manderson.
What is the Median Population Age in Manderson?
Median Population Age in Manderson is 51.7 Years.
What is the Average Family Size in Manderson
Average Family Size in Manderson is 2.7 People.
What is the Average Household Size in Manderson
Average Household Size in Manderson is 2.3 People.
How Large is the Labor Force in Manderson?
There are 84 People in the Labor Forcein in Manderson.
What is the Percentage of People in the Labor Force in Manderson?
75.7% of People are in the Labor Force in Manderson.
What is the Unemployment Rate in Manderson?
Unemployment Rate in Manderson is 1.2%.