Alpine Northwest, WY Map & Demographics
Alpine Northwest Map
Alpine Northwest Overview
$17,788
PER CAPITA INCOME
0.23
INEQUALITY / GINI INDEX
289
TOTAL POPULATION
95
MALE POPULATION
194
FEMALE POPULATION
48.97
MALES / 100 FEMALES
204.21
FEMALES / 100 MALES
16.0
MEDIAN AGE
6.9
AVG FAMILY SIZE
3.2
AVG HOUSEHOLD SIZE
87
LABOR FORCE [ PEOPLE ]
61.3%
PERCENT IN LABOR FORCE
Income in Alpine Northwest
Income Overview in Alpine Northwest
| Characteristic | Number | Measure |
| Per Capita Income | 289 | $17,788 |
| Median Family Income | 34 | $0 |
| Mean Family Income | 34 | $0 |
| Median Household Income | 89 | $0 |
| Mean Household Income | 89 | $0 |
| Income Deficit | 34 | $0 |
| Wage / Income Gap (%) | 289 | 0.00% |
| Wage / Income Gap ($) | 289 | 100.00¢ per $1 |
| Gini / Inequality Index | 289 | 0.23 |
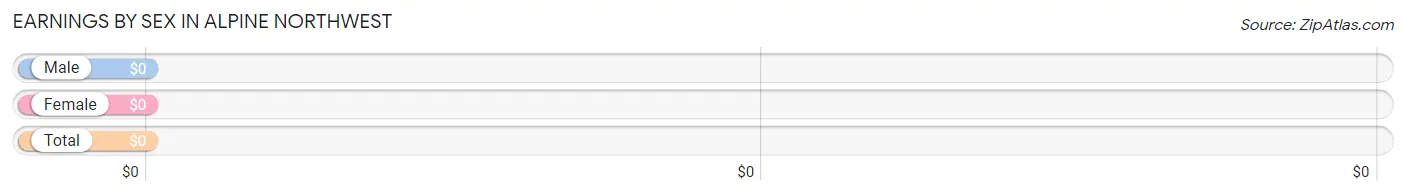
Earnings by Sex in Alpine Northwest
| Sex | Number | Average Earnings |
| Male | 34 (39.1%) | $0 |
| Female | 53 (60.9%) | $0 |
| Total | 87 (100.0%) | $0 |
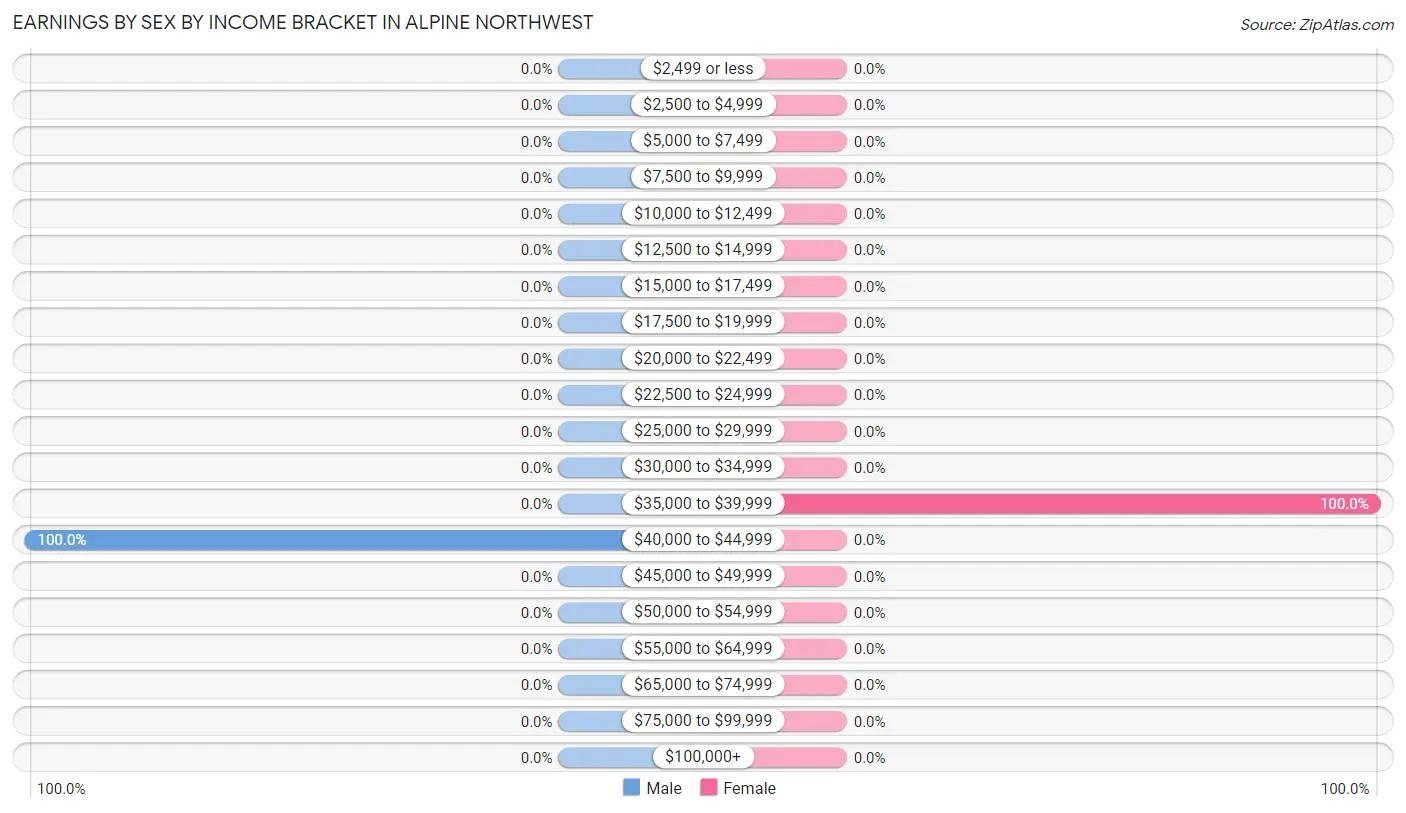
Earnings by Sex by Income Bracket in Alpine Northwest
The most common earnings brackets in Alpine Northwest are $40,000 to $44,999 for men (34 | 100.0%) and $35,000 to $39,999 for women (53 | 100.0%).
| Income | Male | Female |
| $2,499 or less | 0 (0.0%) | 0 (0.0%) |
| $2,500 to $4,999 | 0 (0.0%) | 0 (0.0%) |
| $5,000 to $7,499 | 0 (0.0%) | 0 (0.0%) |
| $7,500 to $9,999 | 0 (0.0%) | 0 (0.0%) |
| $10,000 to $12,499 | 0 (0.0%) | 0 (0.0%) |
| $12,500 to $14,999 | 0 (0.0%) | 0 (0.0%) |
| $15,000 to $17,499 | 0 (0.0%) | 0 (0.0%) |
| $17,500 to $19,999 | 0 (0.0%) | 0 (0.0%) |
| $20,000 to $22,499 | 0 (0.0%) | 0 (0.0%) |
| $22,500 to $24,999 | 0 (0.0%) | 0 (0.0%) |
| $25,000 to $29,999 | 0 (0.0%) | 0 (0.0%) |
| $30,000 to $34,999 | 0 (0.0%) | 0 (0.0%) |
| $35,000 to $39,999 | 0 (0.0%) | 53 (100.0%) |
| $40,000 to $44,999 | 34 (100.0%) | 0 (0.0%) |
| $45,000 to $49,999 | 0 (0.0%) | 0 (0.0%) |
| $50,000 to $54,999 | 0 (0.0%) | 0 (0.0%) |
| $55,000 to $64,999 | 0 (0.0%) | 0 (0.0%) |
| $65,000 to $74,999 | 0 (0.0%) | 0 (0.0%) |
| $75,000 to $99,999 | 0 (0.0%) | 0 (0.0%) |
| $100,000+ | 0 (0.0%) | 0 (0.0%) |
| Total | 34 (100.0%) | 53 (100.0%) |
Earnings by Sex by Educational Attainment in Alpine Northwest
| Educational Attainment | Male Income | Female Income |
| Less than High School | - | - |
| High School Diploma | - | - |
| College or Associate's Degree | - | - |
| Bachelor's Degree | - | - |
| Graduate Degree | - | - |
| Total | - | - |
Family Income in Alpine Northwest
Family Income Brackets in Alpine Northwest
According to the Alpine Northwest family income data, there are 34 families falling into the $75,000 to $99,999 income range, which is the most common income bracket and makes up 100.0% of all families.
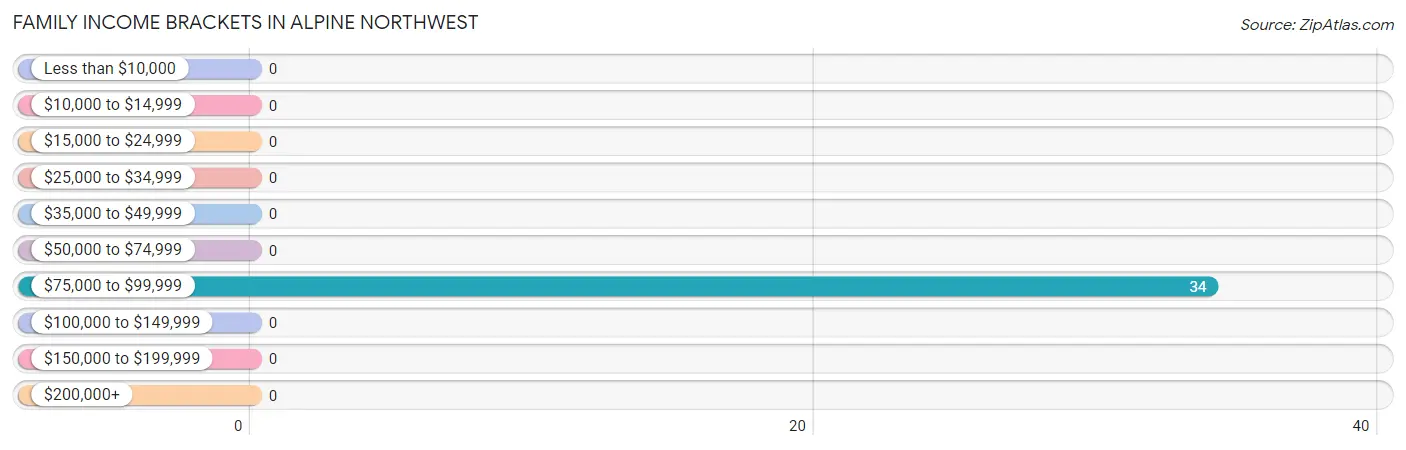
| Income Bracket | # Families | % Families |
| Less than $10,000 | 0 | 0.0% |
| $10,000 to $14,999 | 0 | 0.0% |
| $15,000 to $24,999 | 0 | 0.0% |
| $25,000 to $34,999 | 0 | 0.0% |
| $35,000 to $49,999 | 0 | 0.0% |
| $50,000 to $74,999 | 0 | 0.0% |
| $75,000 to $99,999 | 34 | 100.0% |
| $100,000 to $149,999 | 0 | 0.0% |
| $150,000 to $199,999 | 0 | 0.0% |
| $200,000+ | 0 | 0.0% |
Family Income by Famaliy Size in Alpine Northwest
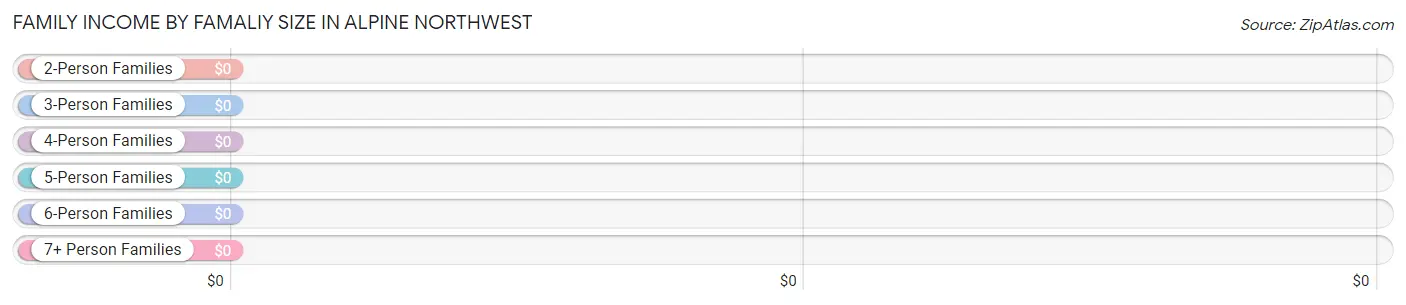
| Income Bracket | # Families | Median Income |
| 2-Person Families | 0 (0.0%) | $0 |
| 3-Person Families | 0 (0.0%) | $0 |
| 4-Person Families | 0 (0.0%) | $0 |
| 5-Person Families | 34 (100.0%) | $0 |
| 6-Person Families | 0 (0.0%) | $0 |
| 7+ Person Families | 0 (0.0%) | $0 |
| Total | 34 (100.0%) | $0 |
Family Income by Number of Earners in Alpine Northwest
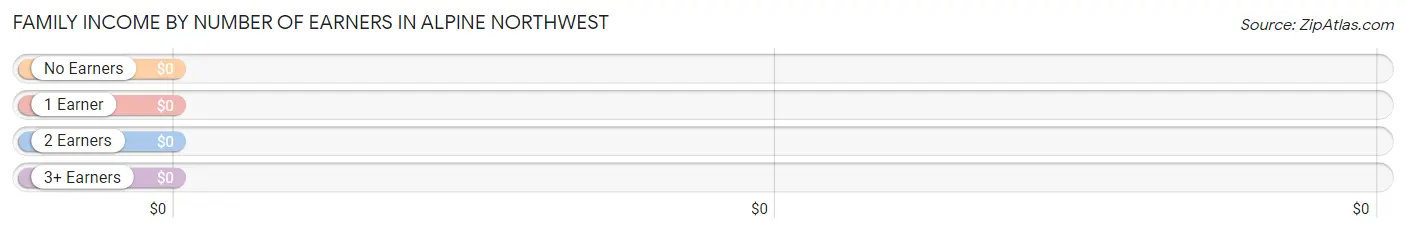
| Number of Earners | # Families | Median Income |
| No Earners | 0 (0.0%) | $0 |
| 1 Earner | 0 (0.0%) | $0 |
| 2 Earners | 34 (100.0%) | $0 |
| 3+ Earners | 0 (0.0%) | $0 |
| Total | 34 (100.0%) | $0 |
Household Income in Alpine Northwest
Household Income Brackets in Alpine Northwest
With 55 households falling in the category, the $25,000 to $34,999 income range is the most frequent in Alpine Northwest, accounting for 61.8% of all households.
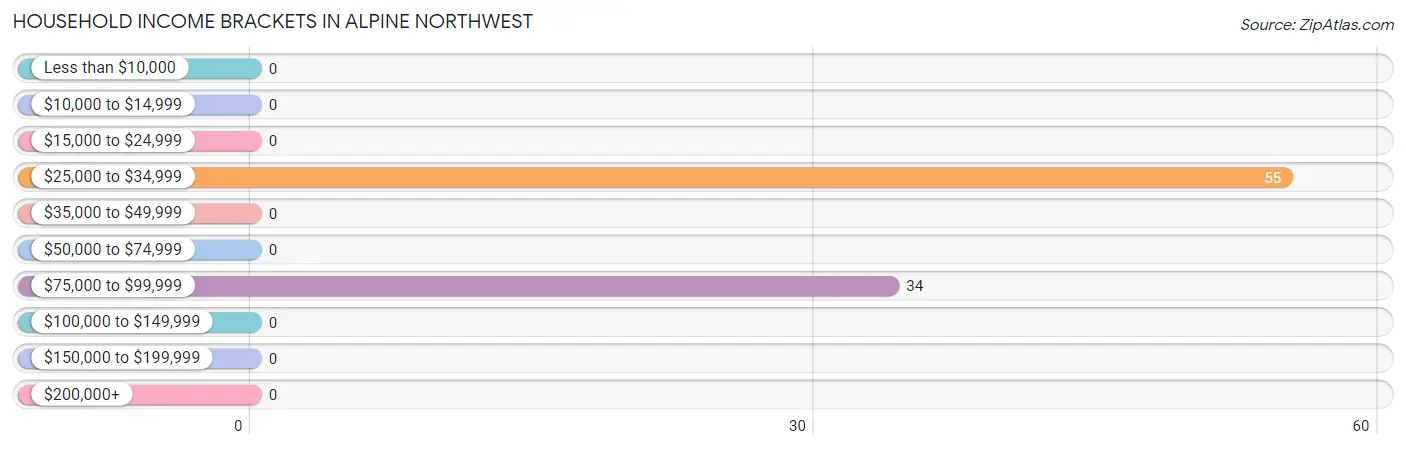
| Income Bracket | # Households | % Households |
| Less than $10,000 | 0 | 0.0% |
| $10,000 to $14,999 | 0 | 0.0% |
| $15,000 to $24,999 | 0 | 0.0% |
| $25,000 to $34,999 | 55 | 61.8% |
| $35,000 to $49,999 | 0 | 0.0% |
| $50,000 to $74,999 | 0 | 0.0% |
| $75,000 to $99,999 | 34 | 38.2% |
| $100,000 to $149,999 | 0 | 0.0% |
| $150,000 to $199,999 | 0 | 0.0% |
| $200,000+ | 0 | 0.0% |
Household Income by Householder Age in Alpine Northwest
| Income Bracket | # Households | Median Income |
| 15 to 24 Years | 0 (0.0%) | $0 |
| 25 to 44 Years | 34 (38.2%) | $0 |
| 45 to 64 Years | 0 (0.0%) | $0 |
| 65+ Years | 55 (61.8%) | $0 |
| Total | 89 (100.0%) | $0 |
Poverty in Alpine Northwest
Income Below Poverty by Sex and Age in Alpine Northwest
| Age Bracket | Male | Female |
| Under 5 Years | 0 (0.0%) | 0 (0.0%) |
| 5 Years | 0 (0.0%) | 0 (0.0%) |
| 6 to 11 Years | 0 (0.0%) | 0 (0.0%) |
| 12 to 14 Years | 0 (0.0%) | 0 (0.0%) |
| 15 Years | 0 (0.0%) | 0 (0.0%) |
| 16 and 17 Years | 0 (0.0%) | 0 (0.0%) |
| 18 to 24 Years | 0 (0.0%) | 0 (0.0%) |
| 25 to 34 Years | 0 (0.0%) | 0 (0.0%) |
| 35 to 44 Years | 0 (0.0%) | 0 (0.0%) |
| 45 to 54 Years | 0 (0.0%) | 0 (0.0%) |
| 55 to 64 Years | 0 (0.0%) | 0 (0.0%) |
| 65 to 74 Years | 0 (0.0%) | 0 (0.0%) |
| 75 Years and over | 0 (0.0%) | 0 (0.0%) |
| Total | 0 (0.0%) | 0 (0.0%) |
Income Above Poverty by Sex and Age in Alpine Northwest
According to the poverty statistics in Alpine Northwest, males aged 12 to 14 years and females aged under 5 years are the age groups that are most secure financially, with 100.0% of males and 100.0% of females in these age groups living above the poverty line.
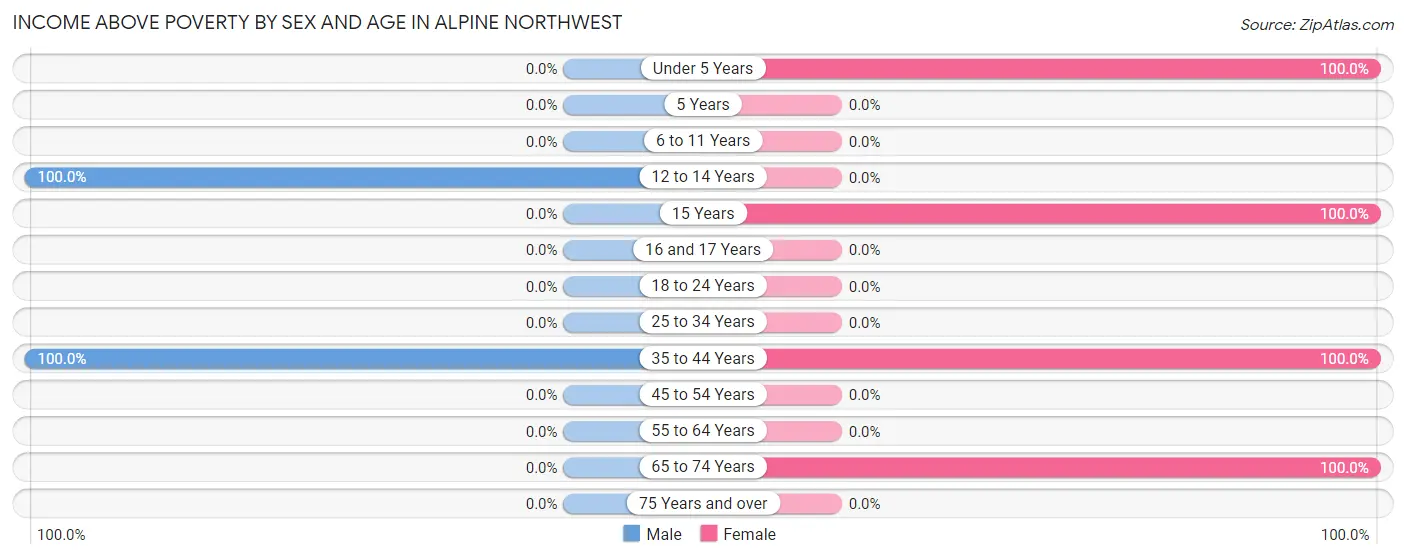
| Age Bracket | Male | Female |
| Under 5 Years | 0 (0.0%) | 25 (100.0%) |
| 5 Years | 0 (0.0%) | 0 (0.0%) |
| 6 to 11 Years | 0 (0.0%) | 0 (0.0%) |
| 12 to 14 Years | 61 (100.0%) | 0 (0.0%) |
| 15 Years | 0 (0.0%) | 61 (100.0%) |
| 16 and 17 Years | 0 (0.0%) | 0 (0.0%) |
| 18 to 24 Years | 0 (0.0%) | 0 (0.0%) |
| 25 to 34 Years | 0 (0.0%) | 0 (0.0%) |
| 35 to 44 Years | 34 (100.0%) | 53 (100.0%) |
| 45 to 54 Years | 0 (0.0%) | 0 (0.0%) |
| 55 to 64 Years | 0 (0.0%) | 0 (0.0%) |
| 65 to 74 Years | 0 (0.0%) | 55 (100.0%) |
| 75 Years and over | 0 (0.0%) | 0 (0.0%) |
| Total | 95 (100.0%) | 194 (100.0%) |
Income Below Poverty Among Married-Couple Families in Alpine Northwest
| Children | Above Poverty | Below Poverty |
| No Children | 0 (0.0%) | 0 (0.0%) |
| 1 or 2 Children | 0 (0.0%) | 0 (0.0%) |
| 3 or 4 Children | 34 (100.0%) | 0 (0.0%) |
| 5 or more Children | 0 (0.0%) | 0 (0.0%) |
| Total | 34 (100.0%) | 0 (0.0%) |
Income Below Poverty Among Single-Parent Households in Alpine Northwest
| Children | Single Father | Single Mother |
| No Children | 0 (0.0%) | 0 (0.0%) |
| 1 or 2 Children | 0 (0.0%) | 0 (0.0%) |
| 3 or 4 Children | 0 (0.0%) | 0 (0.0%) |
| 5 or more Children | 0 (0.0%) | 0 (0.0%) |
| Total | 0 (0.0%) | 0 (0.0%) |
Income Below Poverty Among Married-Couple vs Single-Parent Households in Alpine Northwest
| Children | Married-Couple Families | Single-Parent Households |
| No Children | 0 (0.0%) | 0 (0.0%) |
| 1 or 2 Children | 0 (0.0%) | 0 (0.0%) |
| 3 or 4 Children | 0 (0.0%) | 0 (0.0%) |
| 5 or more Children | 0 (0.0%) | 0 (0.0%) |
| Total | 0 (0.0%) | 0 (0.0%) |
Race in Alpine Northwest
The most populous races in Alpine Northwest are White / Caucasian (289 | 100.0%), and Hispanic or Latino (234 | 81.0%).
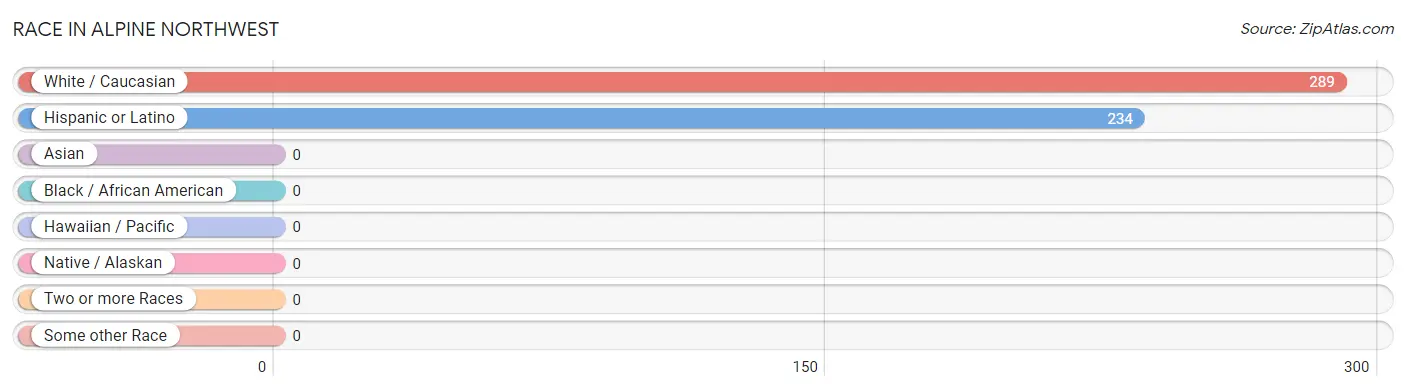
| Race | # Population | % Population |
| Asian | 0 | 0.0% |
| Black / African American | 0 | 0.0% |
| Hawaiian / Pacific | 0 | 0.0% |
| Hispanic or Latino | 234 | 81.0% |
| Native / Alaskan | 0 | 0.0% |
| White / Caucasian | 289 | 100.0% |
| Two or more Races | 0 | 0.0% |
| Some other Race | 0 | 0.0% |
| Total | 289 | 100.0% |
Ancestry in Alpine Northwest
The most populous ancestries reported in Alpine Northwest are Mexican (234 | 81.0%), Danish (55 | 19.0%), and English (55 | 19.0%), together accounting for 119.0% of all Alpine Northwest residents.
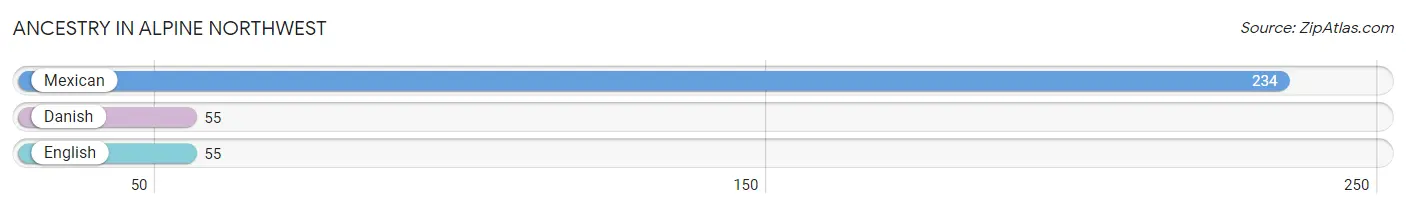
| Ancestry | # Population | % Population |
| Danish | 55 | 19.0% |
| English | 55 | 19.0% |
| Mexican | 234 | 81.0% | View All 3 Rows |
Immigrants in Alpine Northwest
The most numerous immigrant groups reported in Alpine Northwest came from Central America (209 | 72.3%), Latin America (209 | 72.3%), and Mexico (209 | 72.3%), together accounting for 217.0% of all Alpine Northwest residents.
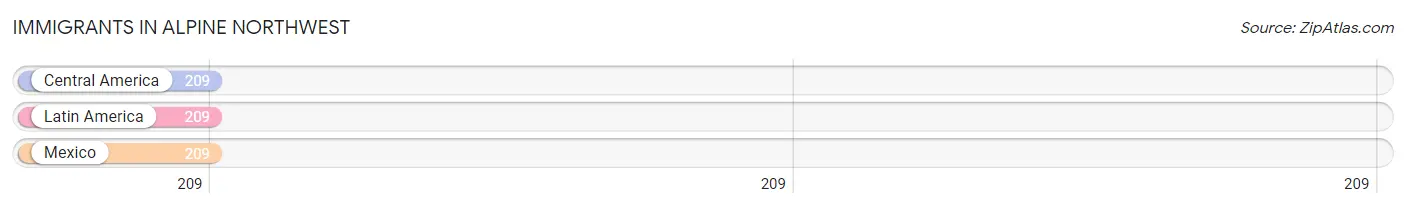
| Immigration Origin | # Population | % Population |
| Central America | 209 | 72.3% |
| Latin America | 209 | 72.3% |
| Mexico | 209 | 72.3% | View All 3 Rows |
Sex and Age in Alpine Northwest
Sex and Age in Alpine Northwest
The most populous age groups in Alpine Northwest are 10 to 14 Years (61 | 64.2%) for men and 15 to 19 Years (61 | 31.4%) for women.
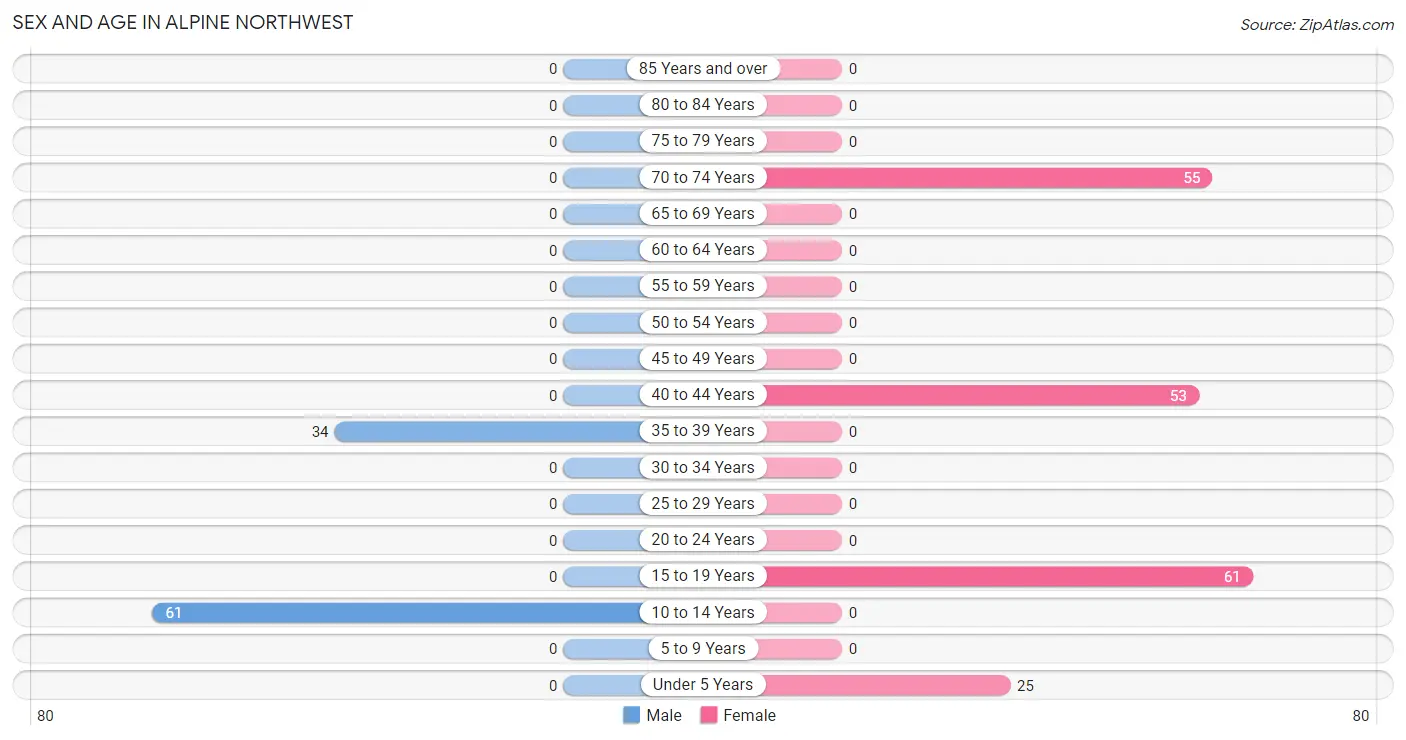
| Age Bracket | Male | Female |
| Under 5 Years | 0 (0.0%) | 25 (12.9%) |
| 5 to 9 Years | 0 (0.0%) | 0 (0.0%) |
| 10 to 14 Years | 61 (64.2%) | 0 (0.0%) |
| 15 to 19 Years | 0 (0.0%) | 61 (31.4%) |
| 20 to 24 Years | 0 (0.0%) | 0 (0.0%) |
| 25 to 29 Years | 0 (0.0%) | 0 (0.0%) |
| 30 to 34 Years | 0 (0.0%) | 0 (0.0%) |
| 35 to 39 Years | 34 (35.8%) | 0 (0.0%) |
| 40 to 44 Years | 0 (0.0%) | 53 (27.3%) |
| 45 to 49 Years | 0 (0.0%) | 0 (0.0%) |
| 50 to 54 Years | 0 (0.0%) | 0 (0.0%) |
| 55 to 59 Years | 0 (0.0%) | 0 (0.0%) |
| 60 to 64 Years | 0 (0.0%) | 0 (0.0%) |
| 65 to 69 Years | 0 (0.0%) | 0 (0.0%) |
| 70 to 74 Years | 0 (0.0%) | 55 (28.3%) |
| 75 to 79 Years | 0 (0.0%) | 0 (0.0%) |
| 80 to 84 Years | 0 (0.0%) | 0 (0.0%) |
| 85 Years and over | 0 (0.0%) | 0 (0.0%) |
| Total | 95 (100.0%) | 194 (100.0%) |
Families and Households in Alpine Northwest
Median Family Size in Alpine Northwest
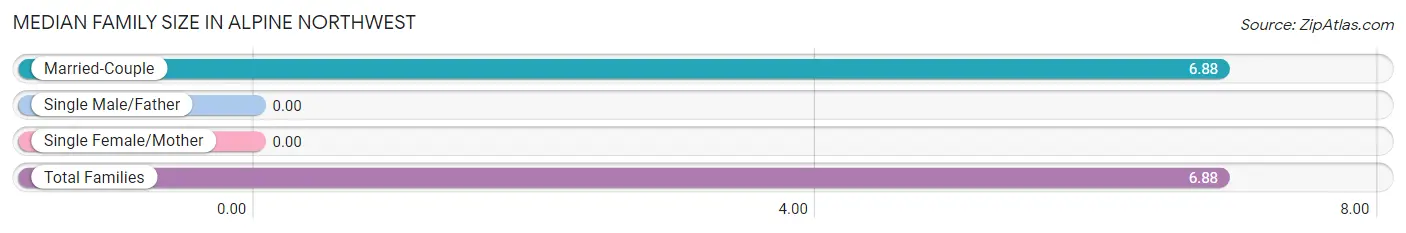
| Family Type | # Families | Family Size |
| Married-Couple | 34 (100.0%) | 6.88 |
| Single Male/Father | 0 (0.0%) | - |
| Single Female/Mother | 0 (0.0%) | - |
| Total Families | 34 (100.0%) | 6.88 |
Median Household Size in Alpine Northwest
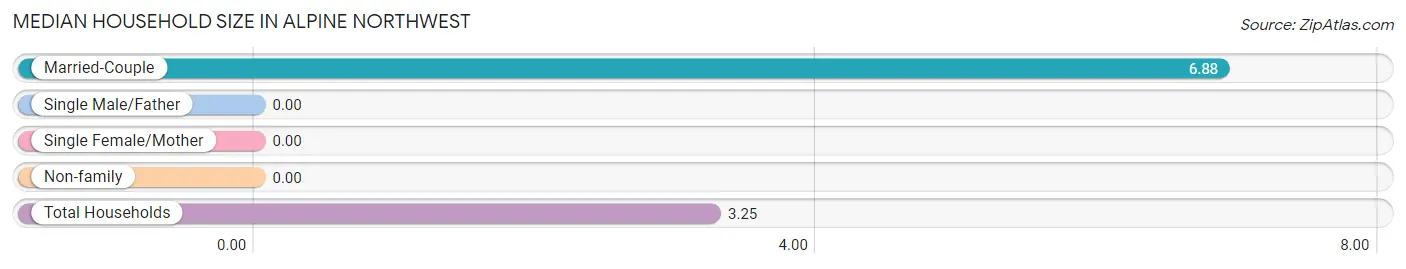
| Household Type | # Households | Household Size |
| Married-Couple | 34 (38.2%) | 6.88 |
| Single Male/Father | 0 (0.0%) | - |
| Single Female/Mother | 0 (0.0%) | - |
| Non-family | 55 (61.8%) | - |
| Total Households | 89 (100.0%) | 3.25 |
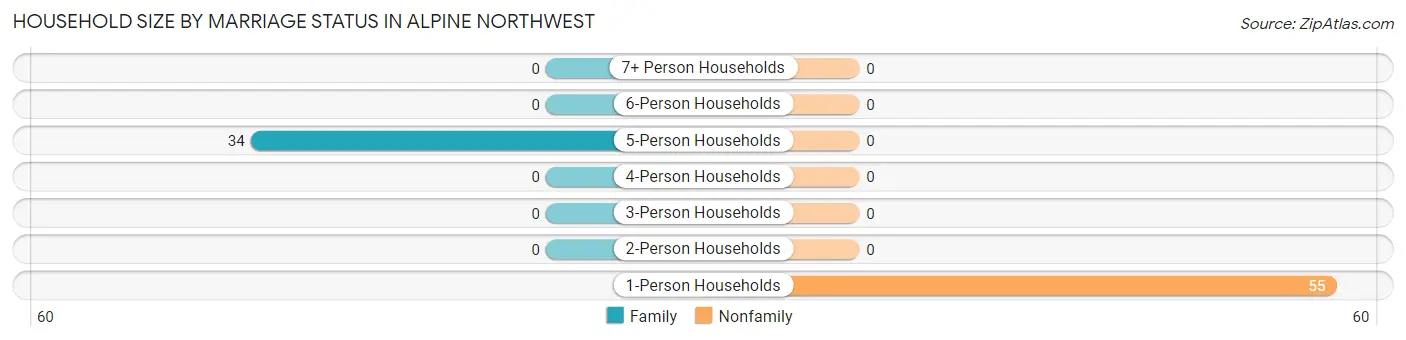
Household Size by Marriage Status in Alpine Northwest
Out of a total of 89 households in Alpine Northwest, 34 (38.2%) are family households, while 55 (61.8%) are nonfamily households. The most numerous type of family households are 5-person households, comprising 34, and the most common type of nonfamily households are 1-person households, comprising 55.
| Household Size | Family Households | Nonfamily Households |
| 1-Person Households | - | 55 (61.8%) |
| 2-Person Households | 0 (0.0%) | 0 (0.0%) |
| 3-Person Households | 0 (0.0%) | 0 (0.0%) |
| 4-Person Households | 0 (0.0%) | 0 (0.0%) |
| 5-Person Households | 34 (38.2%) | 0 (0.0%) |
| 6-Person Households | 0 (0.0%) | 0 (0.0%) |
| 7+ Person Households | 0 (0.0%) | 0 (0.0%) |
| Total | 34 (38.2%) | 55 (61.8%) |
Female Fertility in Alpine Northwest
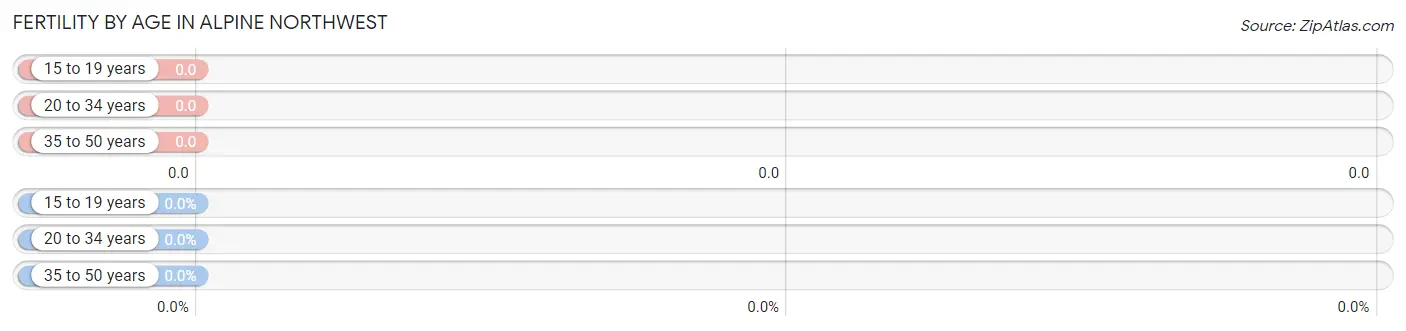
Fertility by Age in Alpine Northwest
| Age Bracket | Women with Births | Births / 1,000 Women |
| 15 to 19 years | 0 (0.0%) | 0.0 |
| 20 to 34 years | 0 (0.0%) | 0.0 |
| 35 to 50 years | 0 (0.0%) | 0.0 |
| Total | 0 (0.0%) | 0.0 |
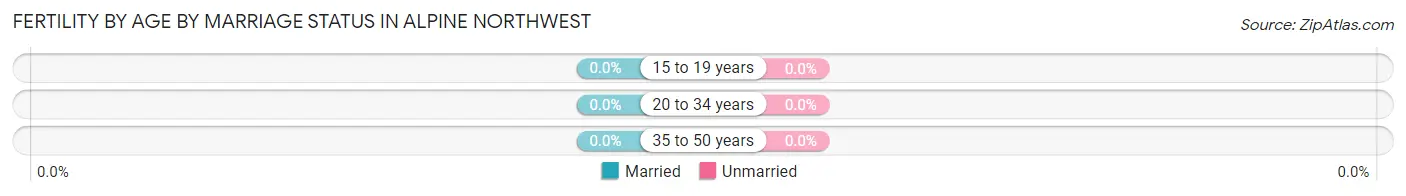
Fertility by Age by Marriage Status in Alpine Northwest
| Age Bracket | Married | Unmarried |
| 15 to 19 years | 0 (0.0%) | 0 (0.0%) |
| 20 to 34 years | 0 (0.0%) | 0 (0.0%) |
| 35 to 50 years | 0 (0.0%) | 0 (0.0%) |
| Total | 0 (0.0%) | 0 (0.0%) |
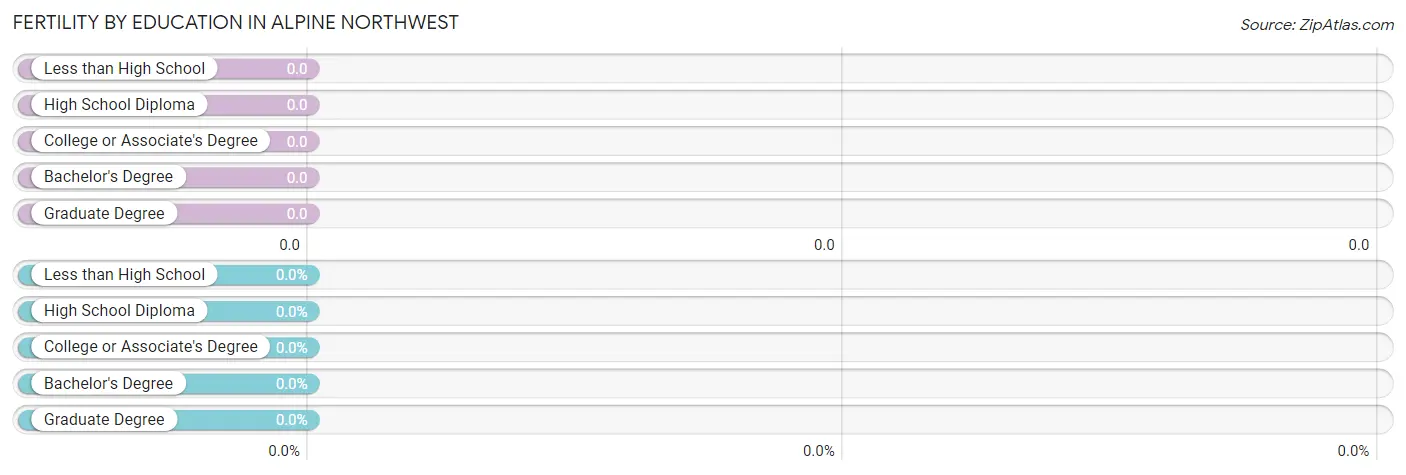
Fertility by Education in Alpine Northwest
| Educational Attainment | Women with Births | Births / 1,000 Women |
| Less than High School | 0 (0.0%) | 0.0 |
| High School Diploma | 0 (0.0%) | 0.0 |
| College or Associate's Degree | 0 (0.0%) | 0.0 |
| Bachelor's Degree | 0 (0.0%) | 0.0 |
| Graduate Degree | 0 (0.0%) | 0.0 |
| Total | 0 (0.0%) | 0.0 |
Fertility by Education by Marriage Status in Alpine Northwest
| Educational Attainment | Married | Unmarried |
| Less than High School | 0 (0.0%) | 0 (0.0%) |
| High School Diploma | 0 (0.0%) | 0 (0.0%) |
| College or Associate's Degree | 0 (0.0%) | 0 (0.0%) |
| Bachelor's Degree | 0 (0.0%) | 0 (0.0%) |
| Graduate Degree | 0 (0.0%) | 0 (0.0%) |
| Total | 0 (0.0%) | 0 (0.0%) |
Employment Characteristics in Alpine Northwest
Employment by Class of Employer in Alpine Northwest
Among the 87 employed individuals in Alpine Northwest, , and private company employees (87 | 100.0%) make up the most common classes of employment.
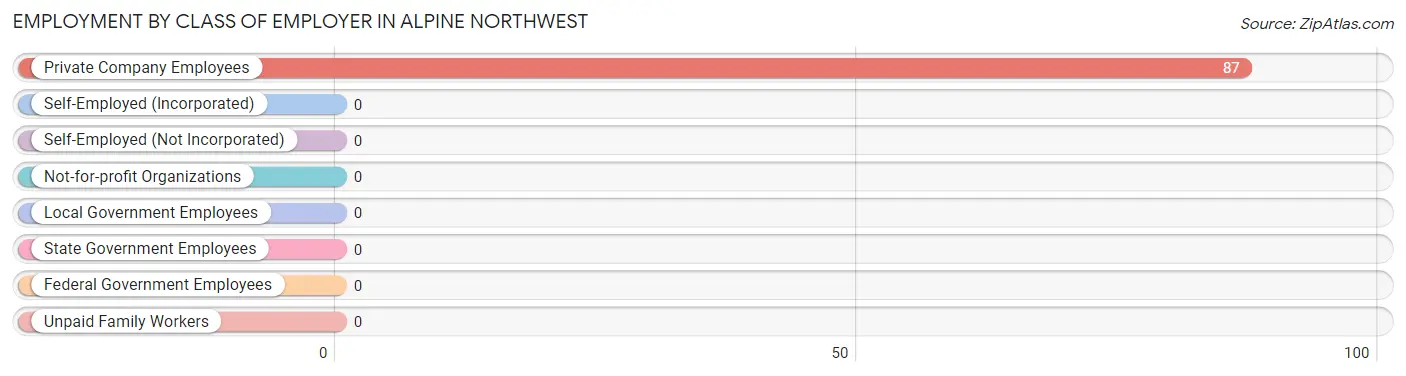
| Employer Class | # Employees | % Employees |
| Private Company Employees | 87 | 100.0% |
| Self-Employed (Incorporated) | 0 | 0.0% |
| Self-Employed (Not Incorporated) | 0 | 0.0% |
| Not-for-profit Organizations | 0 | 0.0% |
| Local Government Employees | 0 | 0.0% |
| State Government Employees | 0 | 0.0% |
| Federal Government Employees | 0 | 0.0% |
| Unpaid Family Workers | 0 | 0.0% |
| Total | 87 | 100.0% |
Employment Status by Age in Alpine Northwest
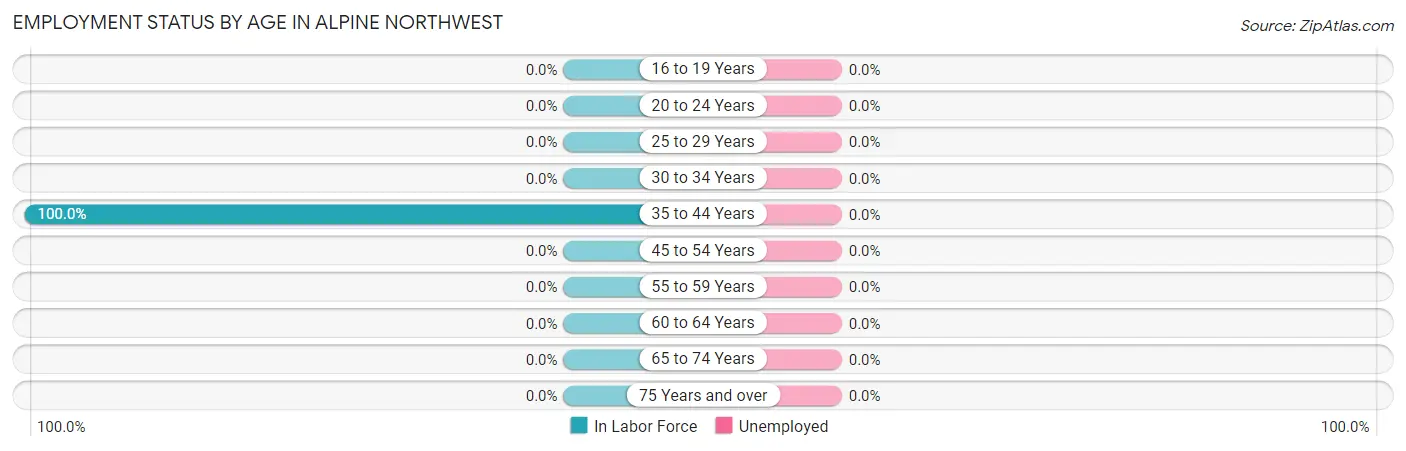
| Age Bracket | In Labor Force | Unemployed |
| 16 to 19 Years | 0 (0.0%) | 0 (0.0%) |
| 20 to 24 Years | 0 (0.0%) | 0 (0.0%) |
| 25 to 29 Years | 0 (0.0%) | 0 (0.0%) |
| 30 to 34 Years | 0 (0.0%) | 0 (0.0%) |
| 35 to 44 Years | 87 (100.0%) | 0 (0.0%) |
| 45 to 54 Years | 0 (0.0%) | 0 (0.0%) |
| 55 to 59 Years | 0 (0.0%) | 0 (0.0%) |
| 60 to 64 Years | 0 (0.0%) | 0 (0.0%) |
| 65 to 74 Years | 0 (0.0%) | 0 (0.0%) |
| 75 Years and over | 0 (0.0%) | 0 (0.0%) |
| Total | 87 (61.3%) | 0 (0.0%) |
Employment Status by Educational Attainment in Alpine Northwest
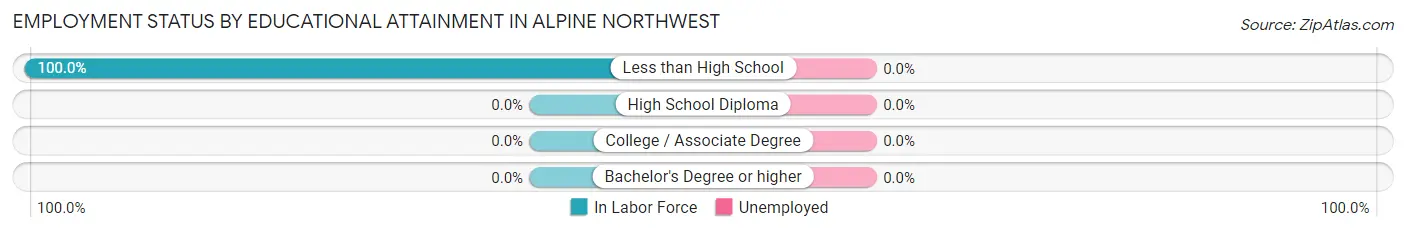
| Educational Attainment | In Labor Force | Unemployed |
| Less than High School | 87 (100.0%) | 0 (0.0%) |
| High School Diploma | 0 (0.0%) | 0 (0.0%) |
| College / Associate Degree | 0 (0.0%) | 0 (0.0%) |
| Bachelor's Degree or higher | 0 (0.0%) | 0 (0.0%) |
| Total | 87 (100.0%) | 0 (0.0%) |
Employment Occupations by Sex in Alpine Northwest
Management, Business, Science and Arts Occupations
Management, Business, Science and Arts Occupations by Sex
| Occupation | Male | Female |
| Management | 0 (0.0%) | 0 (0.0%) |
| Business & Financial | 0 (0.0%) | 0 (0.0%) |
| Computers, Engineering & Science | 0 (0.0%) | 0 (0.0%) |
| Computers & Mathematics | 0 (0.0%) | 0 (0.0%) |
| Architecture & Engineering | 0 (0.0%) | 0 (0.0%) |
| Life, Physical & Social Science | 0 (0.0%) | 0 (0.0%) |
| Community & Social Service | 0 (0.0%) | 0 (0.0%) |
| Education, Arts & Media | 0 (0.0%) | 0 (0.0%) |
| Legal Services & Support | 0 (0.0%) | 0 (0.0%) |
| Education Instruction & Library | 0 (0.0%) | 0 (0.0%) |
| Arts, Media & Entertainment | 0 (0.0%) | 0 (0.0%) |
| Health Diagnosing & Treating | 0 (0.0%) | 0 (0.0%) |
| Health Technologists | 0 (0.0%) | 0 (0.0%) |
| Total (Category) | 0 (0.0%) | 0 (0.0%) |
| Total (Overall) | 34 (39.1%) | 53 (60.9%) |
Services Occupations
Services Occupations by Sex
| Occupation | Male | Female |
| Healthcare Support | 0 (0.0%) | 0 (0.0%) |
| Security & Protection | 0 (0.0%) | 0 (0.0%) |
| Firefighting & Prevention | 0 (0.0%) | 0 (0.0%) |
| Law Enforcement | 0 (0.0%) | 0 (0.0%) |
| Food Preparation & Serving | 0 (0.0%) | 0 (0.0%) |
| Cleaning & Maintenance | 0 (0.0%) | 0 (0.0%) |
| Personal Care & Service | 0 (0.0%) | 0 (0.0%) |
| Total (Category) | 0 (0.0%) | 0 (0.0%) |
| Total (Overall) | 34 (39.1%) | 53 (60.9%) |
Sales and Office Occupations
The most common Sales and Office occupations in Alpine Northwest are , and Sales & Related (34 | 39.1%).
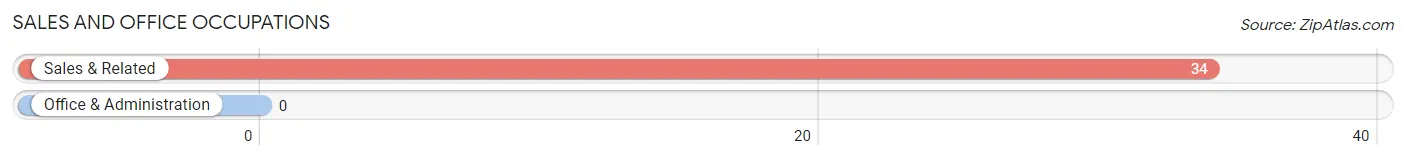
Sales and Office Occupations by Sex
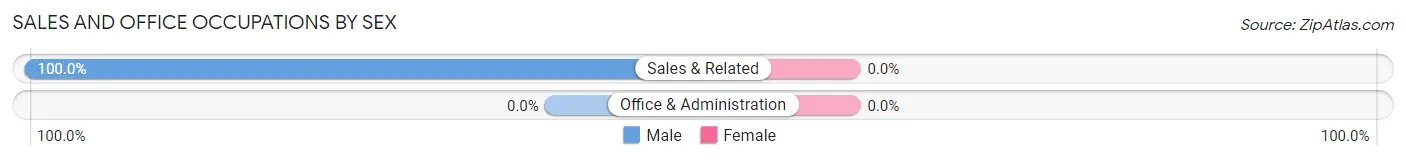
| Occupation | Male | Female |
| Sales & Related | 34 (100.0%) | 0 (0.0%) |
| Office & Administration | 0 (0.0%) | 0 (0.0%) |
| Total (Category) | 34 (100.0%) | 0 (0.0%) |
| Total (Overall) | 34 (39.1%) | 53 (60.9%) |
Natural Resources, Construction and Maintenance Occupations
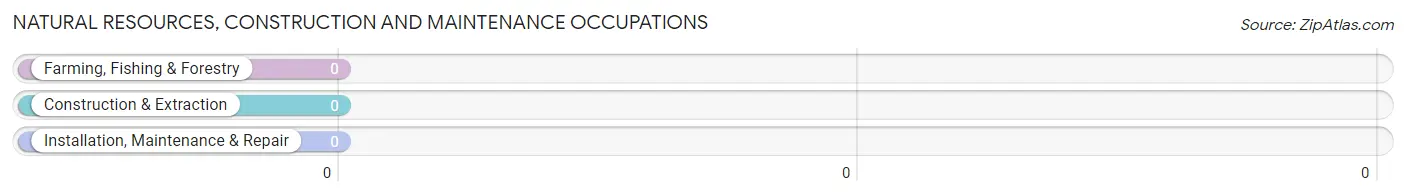
Natural Resources, Construction and Maintenance Occupations by Sex
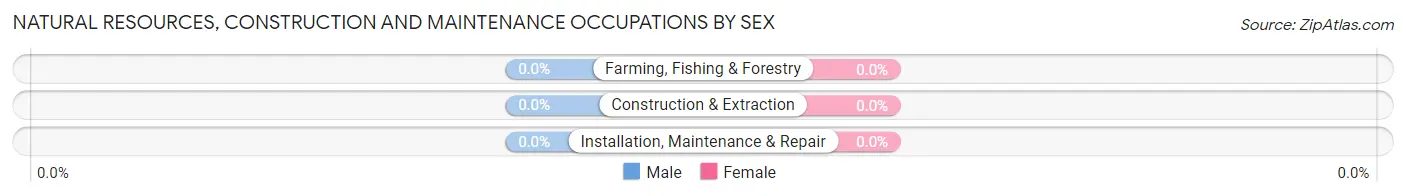
| Occupation | Male | Female |
| Farming, Fishing & Forestry | 0 (0.0%) | 0 (0.0%) |
| Construction & Extraction | 0 (0.0%) | 0 (0.0%) |
| Installation, Maintenance & Repair | 0 (0.0%) | 0 (0.0%) |
| Total (Category) | 0 (0.0%) | 0 (0.0%) |
| Total (Overall) | 34 (39.1%) | 53 (60.9%) |
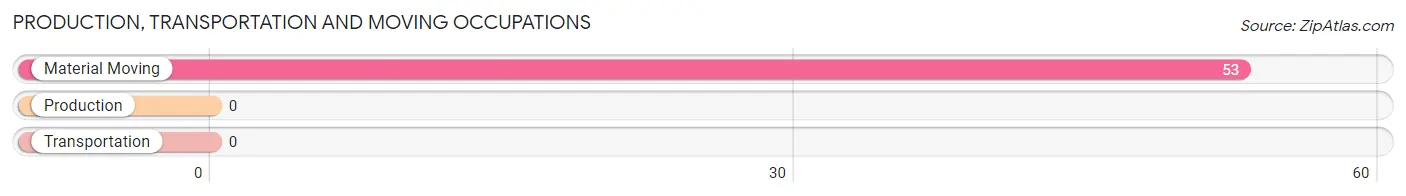
Production, Transportation and Moving Occupations
The most common Production, Transportation and Moving occupations in Alpine Northwest are , and Material Moving (53 | 60.9%).
Production, Transportation and Moving Occupations by Sex
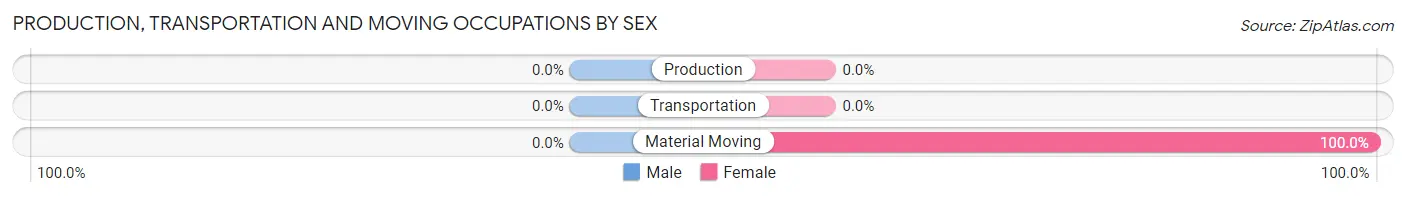
| Occupation | Male | Female |
| Production | 0 (0.0%) | 0 (0.0%) |
| Transportation | 0 (0.0%) | 0 (0.0%) |
| Material Moving | 0 (0.0%) | 53 (100.0%) |
| Total (Category) | 0 (0.0%) | 53 (100.0%) |
| Total (Overall) | 34 (39.1%) | 53 (60.9%) |
Employment Industries by Sex in Alpine Northwest
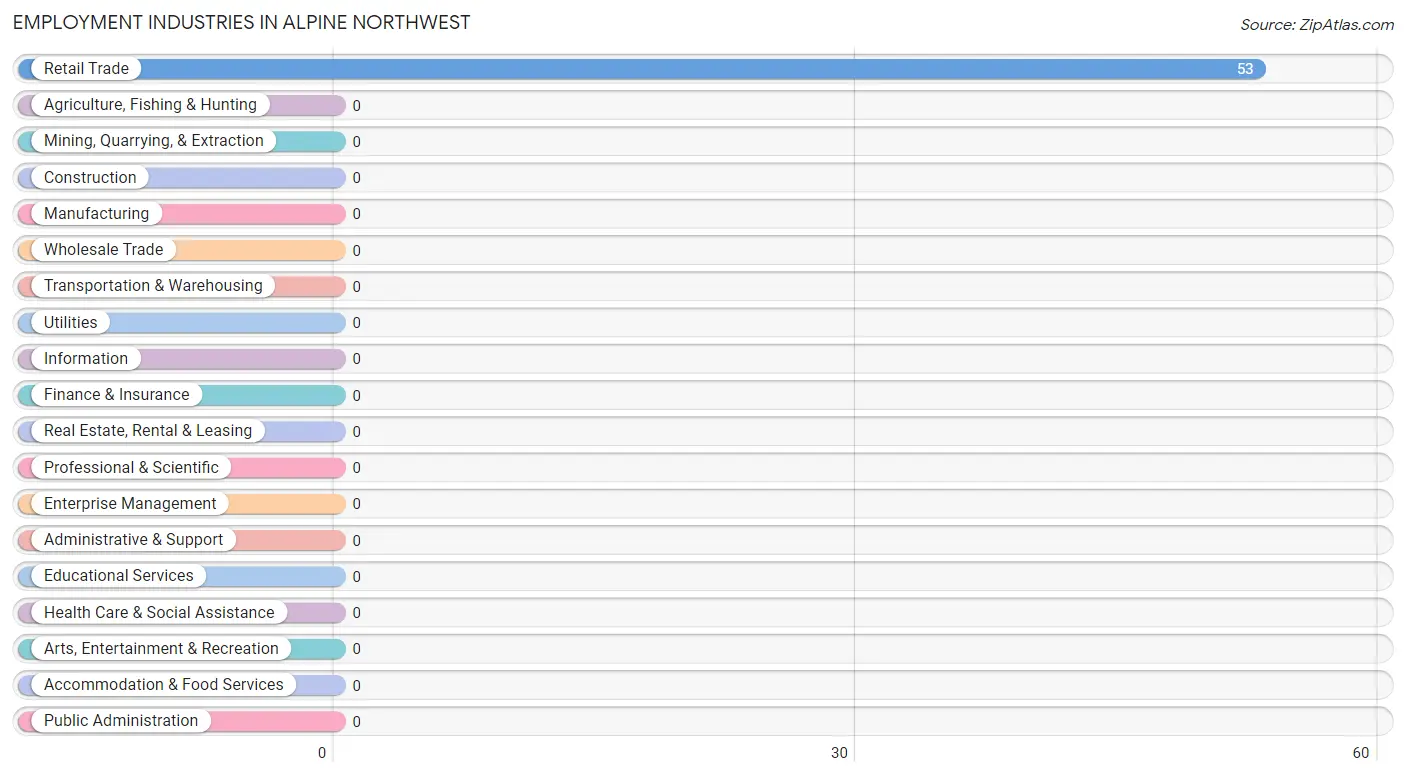
Employment Industries in Alpine Northwest
The major employment industries in Alpine Northwest include , and Retail Trade (53 | 60.9%).
Employment Industries by Sex in Alpine Northwest
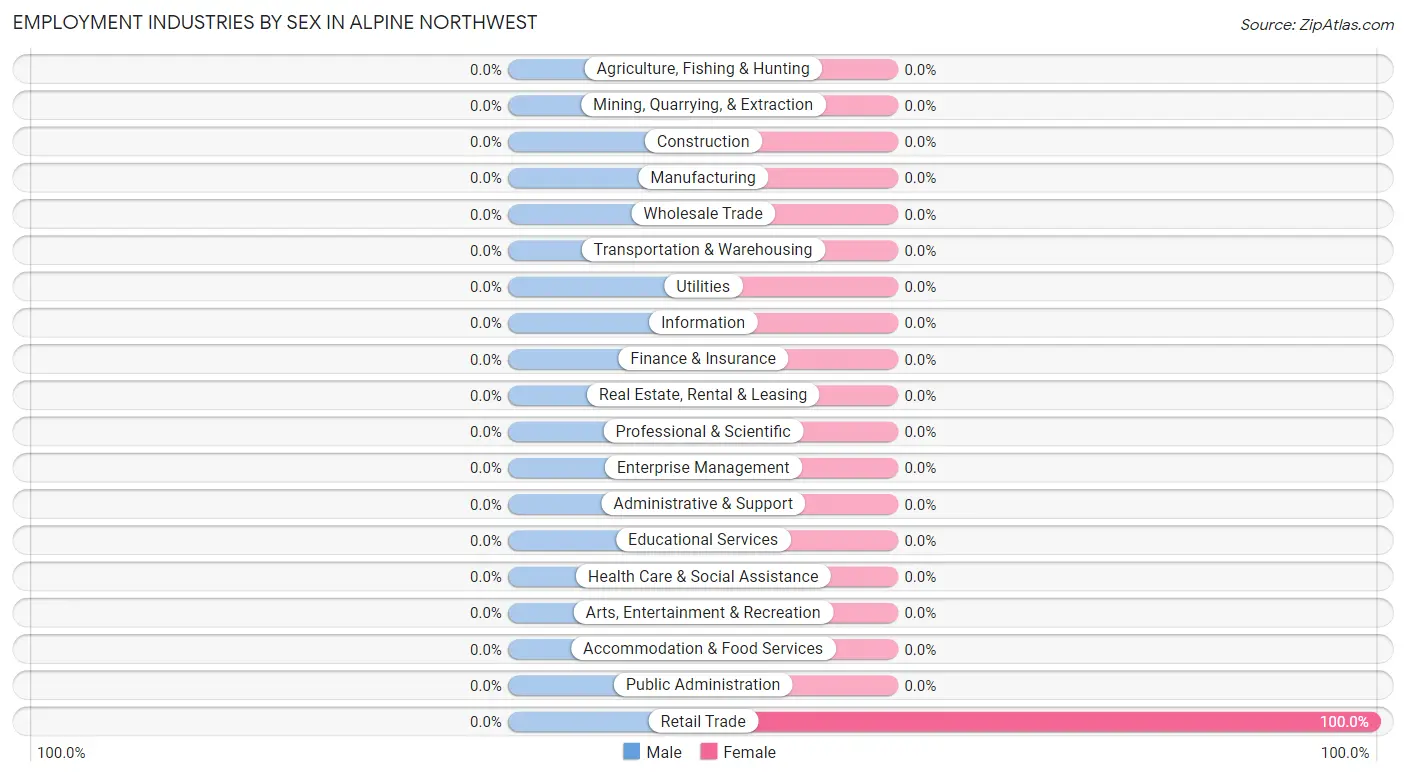
| Industry | Male | Female |
| Agriculture, Fishing & Hunting | 0 (0.0%) | 0 (0.0%) |
| Mining, Quarrying, & Extraction | 0 (0.0%) | 0 (0.0%) |
| Construction | 0 (0.0%) | 0 (0.0%) |
| Manufacturing | 0 (0.0%) | 0 (0.0%) |
| Wholesale Trade | 0 (0.0%) | 0 (0.0%) |
| Retail Trade | 0 (0.0%) | 53 (100.0%) |
| Transportation & Warehousing | 0 (0.0%) | 0 (0.0%) |
| Utilities | 0 (0.0%) | 0 (0.0%) |
| Information | 0 (0.0%) | 0 (0.0%) |
| Finance & Insurance | 0 (0.0%) | 0 (0.0%) |
| Real Estate, Rental & Leasing | 0 (0.0%) | 0 (0.0%) |
| Professional & Scientific | 0 (0.0%) | 0 (0.0%) |
| Enterprise Management | 0 (0.0%) | 0 (0.0%) |
| Administrative & Support | 0 (0.0%) | 0 (0.0%) |
| Educational Services | 0 (0.0%) | 0 (0.0%) |
| Health Care & Social Assistance | 0 (0.0%) | 0 (0.0%) |
| Arts, Entertainment & Recreation | 0 (0.0%) | 0 (0.0%) |
| Accommodation & Food Services | 0 (0.0%) | 0 (0.0%) |
| Public Administration | 0 (0.0%) | 0 (0.0%) |
| Total | 34 (39.1%) | 53 (60.9%) |
Education in Alpine Northwest
School Enrollment in Alpine Northwest
The most common levels of schooling among the 122 students in Alpine Northwest are middle school (61 | 50.0%), and high school (61 | 50.0%).
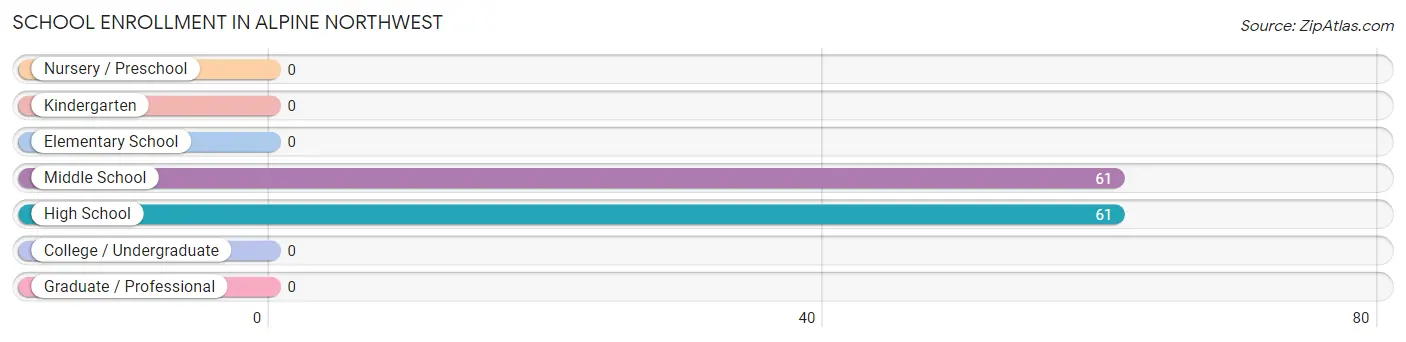
| School Level | # Students | % Students |
| Nursery / Preschool | 0 | 0.0% |
| Kindergarten | 0 | 0.0% |
| Elementary School | 0 | 0.0% |
| Middle School | 61 | 50.0% |
| High School | 61 | 50.0% |
| College / Undergraduate | 0 | 0.0% |
| Graduate / Professional | 0 | 0.0% |
| Total | 122 | 100.0% |
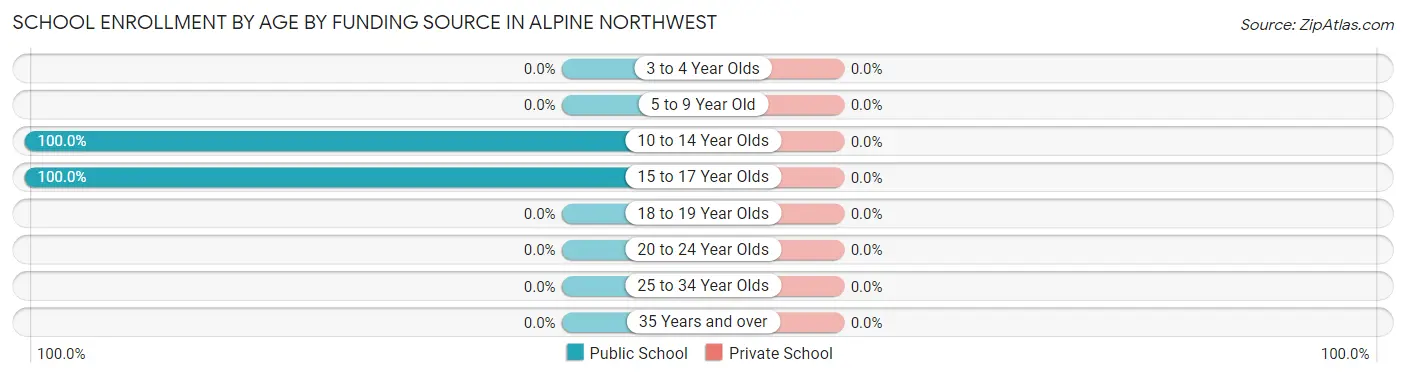
School Enrollment by Age by Funding Source in Alpine Northwest
| Age Bracket | Public School | Private School |
| 3 to 4 Year Olds | 0 (0.0%) | 0 (0.0%) |
| 5 to 9 Year Old | 0 (0.0%) | 0 (0.0%) |
| 10 to 14 Year Olds | 61 (100.0%) | 0 (0.0%) |
| 15 to 17 Year Olds | 61 (100.0%) | 0 (0.0%) |
| 18 to 19 Year Olds | 0 (0.0%) | 0 (0.0%) |
| 20 to 24 Year Olds | 0 (0.0%) | 0 (0.0%) |
| 25 to 34 Year Olds | 0 (0.0%) | 0 (0.0%) |
| 35 Years and over | 0 (0.0%) | 0 (0.0%) |
| Total | 122 (100.0%) | 0 (0.0%) |
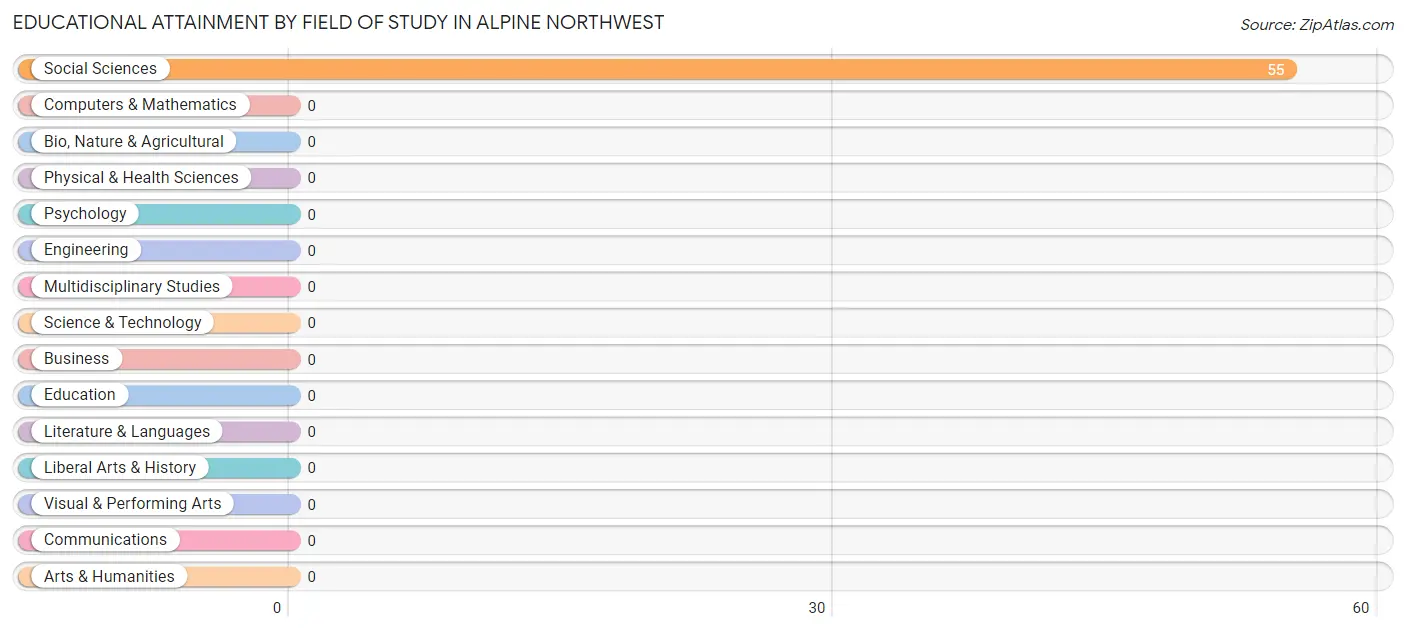
Educational Attainment by Field of Study in Alpine Northwest
, and social sciences (55 | 100.0%) are the most common fields of study among 55 individuals in Alpine Northwest who have obtained a bachelor's degree or higher.
| Field of Study | # Graduates | % Graduates |
| Computers & Mathematics | 0 | 0.0% |
| Bio, Nature & Agricultural | 0 | 0.0% |
| Physical & Health Sciences | 0 | 0.0% |
| Psychology | 0 | 0.0% |
| Social Sciences | 55 | 100.0% |
| Engineering | 0 | 0.0% |
| Multidisciplinary Studies | 0 | 0.0% |
| Science & Technology | 0 | 0.0% |
| Business | 0 | 0.0% |
| Education | 0 | 0.0% |
| Literature & Languages | 0 | 0.0% |
| Liberal Arts & History | 0 | 0.0% |
| Visual & Performing Arts | 0 | 0.0% |
| Communications | 0 | 0.0% |
| Arts & Humanities | 0 | 0.0% |
| Total | 55 | 100.0% |
Transportation & Commute in Alpine Northwest
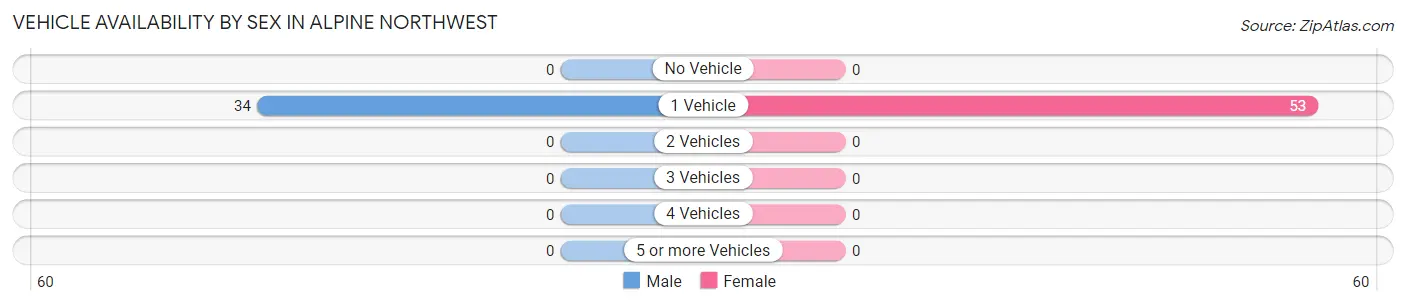
Vehicle Availability by Sex in Alpine Northwest
The most prevalent vehicle ownership categories in Alpine Northwest are males with 1 vehicle (34, accounting for 100.0%) and females with 1 vehicle (53, making up 64.1%).
| Vehicles Available | Male | Female |
| No Vehicle | 0 (0.0%) | 0 (0.0%) |
| 1 Vehicle | 34 (100.0%) | 53 (100.0%) |
| 2 Vehicles | 0 (0.0%) | 0 (0.0%) |
| 3 Vehicles | 0 (0.0%) | 0 (0.0%) |
| 4 Vehicles | 0 (0.0%) | 0 (0.0%) |
| 5 or more Vehicles | 0 (0.0%) | 0 (0.0%) |
| Total | 34 (100.0%) | 53 (100.0%) |
Commute Time in Alpine Northwest
The most frequently occuring commute durations in Alpine Northwest are 40 to 44 minutes (53 commuters, 60.9%), 45 to 59 minutes (34 commuters, 39.1%), and less than 5 minutes (0 commuters, 0.0%).
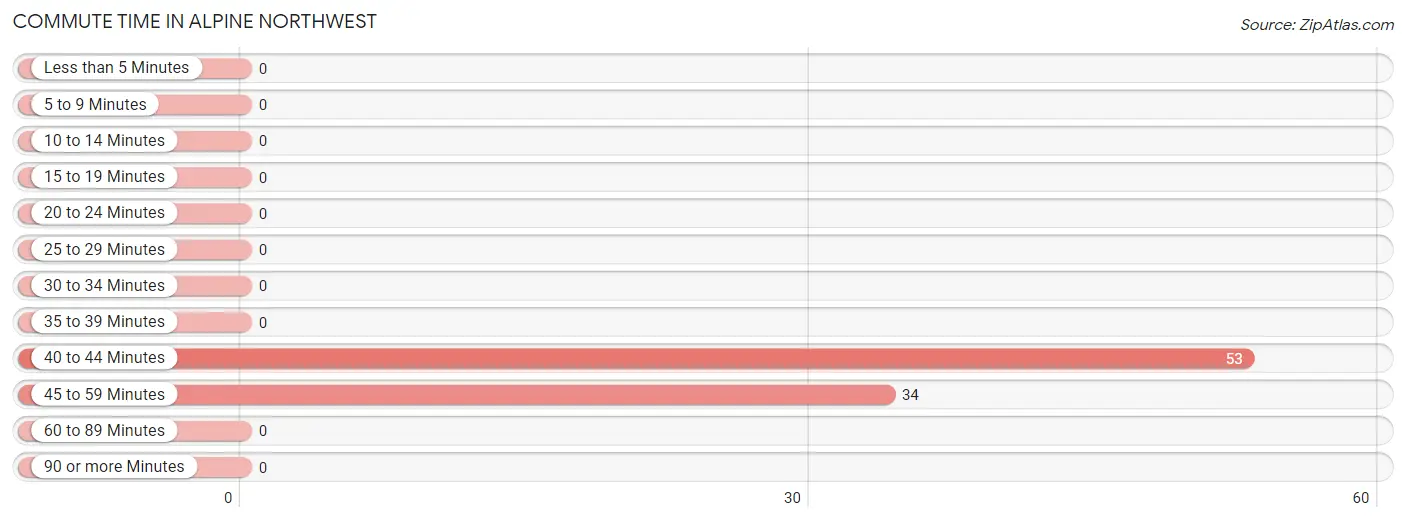
| Commute Time | # Commuters | % Commuters |
| Less than 5 Minutes | 0 | 0.0% |
| 5 to 9 Minutes | 0 | 0.0% |
| 10 to 14 Minutes | 0 | 0.0% |
| 15 to 19 Minutes | 0 | 0.0% |
| 20 to 24 Minutes | 0 | 0.0% |
| 25 to 29 Minutes | 0 | 0.0% |
| 30 to 34 Minutes | 0 | 0.0% |
| 35 to 39 Minutes | 0 | 0.0% |
| 40 to 44 Minutes | 53 | 60.9% |
| 45 to 59 Minutes | 34 | 39.1% |
| 60 to 89 Minutes | 0 | 0.0% |
| 90 or more Minutes | 0 | 0.0% |
Commute Time by Sex in Alpine Northwest
The most common commute times in Alpine Northwest are 45 to 59 minutes (34 commuters, 100.0%) for males and 40 to 44 minutes (53 commuters, 100.0%) for females.
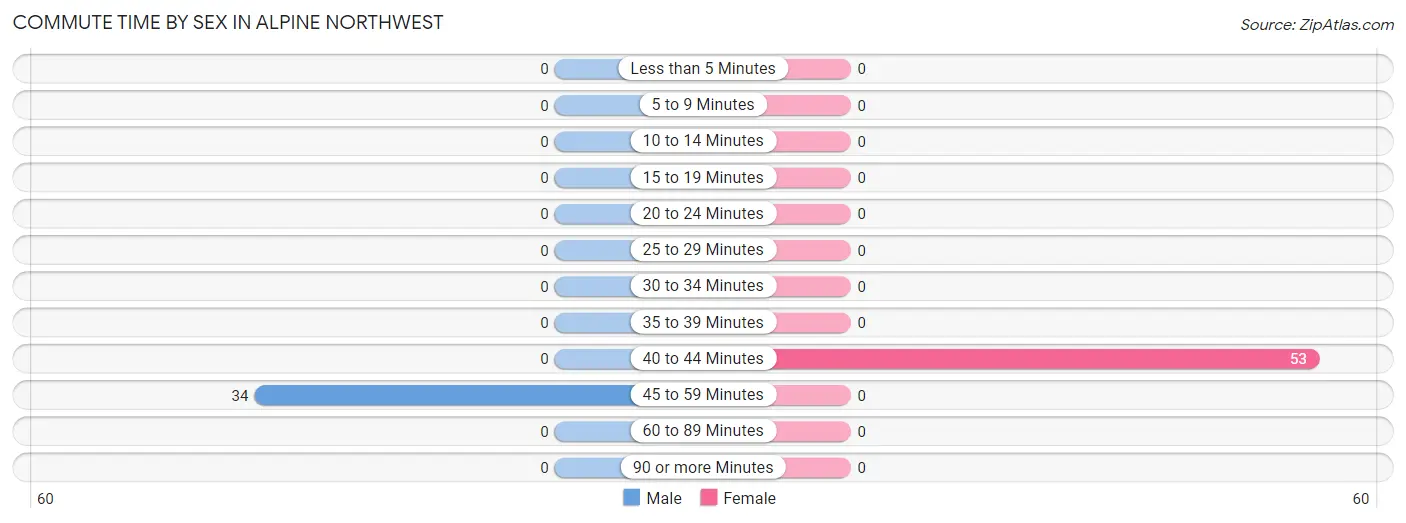
| Commute Time | Male | Female |
| Less than 5 Minutes | 0 (0.0%) | 0 (0.0%) |
| 5 to 9 Minutes | 0 (0.0%) | 0 (0.0%) |
| 10 to 14 Minutes | 0 (0.0%) | 0 (0.0%) |
| 15 to 19 Minutes | 0 (0.0%) | 0 (0.0%) |
| 20 to 24 Minutes | 0 (0.0%) | 0 (0.0%) |
| 25 to 29 Minutes | 0 (0.0%) | 0 (0.0%) |
| 30 to 34 Minutes | 0 (0.0%) | 0 (0.0%) |
| 35 to 39 Minutes | 0 (0.0%) | 0 (0.0%) |
| 40 to 44 Minutes | 0 (0.0%) | 53 (100.0%) |
| 45 to 59 Minutes | 34 (100.0%) | 0 (0.0%) |
| 60 to 89 Minutes | 0 (0.0%) | 0 (0.0%) |
| 90 or more Minutes | 0 (0.0%) | 0 (0.0%) |
Time of Departure to Work by Sex in Alpine Northwest
The most frequent times of departure to work in Alpine Northwest are 12:00 AM to 4:59 AM (34, 100.0%) for males and 12:00 AM to 4:59 AM (53, 100.0%) for females.
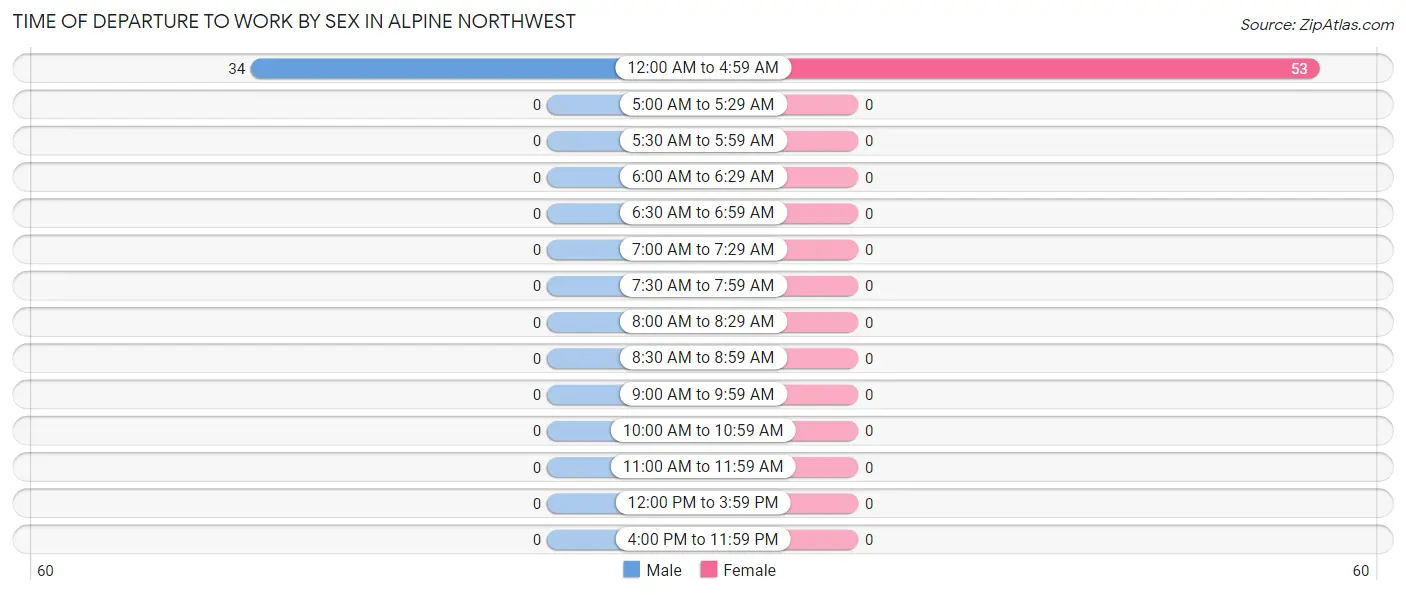
| Time of Departure | Male | Female |
| 12:00 AM to 4:59 AM | 34 (100.0%) | 53 (100.0%) |
| 5:00 AM to 5:29 AM | 0 (0.0%) | 0 (0.0%) |
| 5:30 AM to 5:59 AM | 0 (0.0%) | 0 (0.0%) |
| 6:00 AM to 6:29 AM | 0 (0.0%) | 0 (0.0%) |
| 6:30 AM to 6:59 AM | 0 (0.0%) | 0 (0.0%) |
| 7:00 AM to 7:29 AM | 0 (0.0%) | 0 (0.0%) |
| 7:30 AM to 7:59 AM | 0 (0.0%) | 0 (0.0%) |
| 8:00 AM to 8:29 AM | 0 (0.0%) | 0 (0.0%) |
| 8:30 AM to 8:59 AM | 0 (0.0%) | 0 (0.0%) |
| 9:00 AM to 9:59 AM | 0 (0.0%) | 0 (0.0%) |
| 10:00 AM to 10:59 AM | 0 (0.0%) | 0 (0.0%) |
| 11:00 AM to 11:59 AM | 0 (0.0%) | 0 (0.0%) |
| 12:00 PM to 3:59 PM | 0 (0.0%) | 0 (0.0%) |
| 4:00 PM to 11:59 PM | 0 (0.0%) | 0 (0.0%) |
| Total | 34 (100.0%) | 53 (100.0%) |
Housing Occupancy in Alpine Northwest
Occupancy by Ownership in Alpine Northwest
Of the total 89 dwellings in Alpine Northwest, owner-occupied units account for 55 (61.8%), while renter-occupied units make up 34 (38.2%).
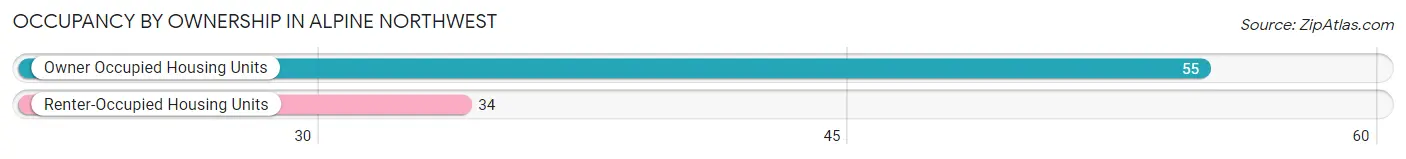
| Occupancy | # Housing Units | % Housing Units |
| Owner Occupied Housing Units | 55 | 61.8% |
| Renter-Occupied Housing Units | 34 | 38.2% |
| Total Occupied Housing Units | 89 | 100.0% |
Occupancy by Household Size in Alpine Northwest
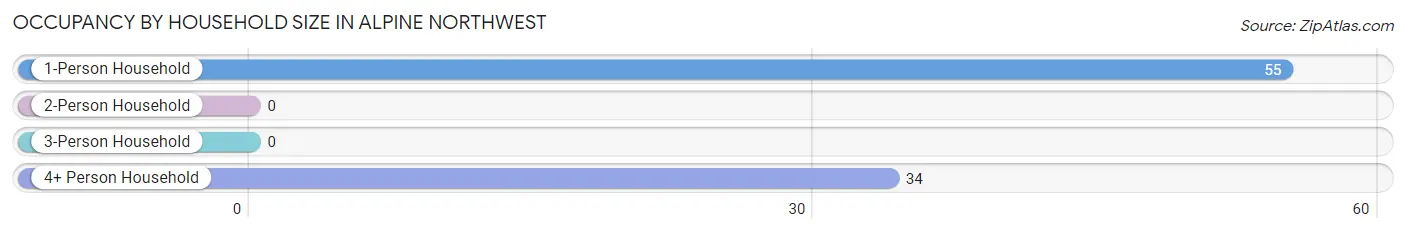
| Household Size | # Housing Units | % Housing Units |
| 1-Person Household | 55 | 61.8% |
| 2-Person Household | 0 | 0.0% |
| 3-Person Household | 0 | 0.0% |
| 4+ Person Household | 34 | 38.2% |
| Total Housing Units | 89 | 100.0% |
Occupancy by Ownership by Household Size in Alpine Northwest
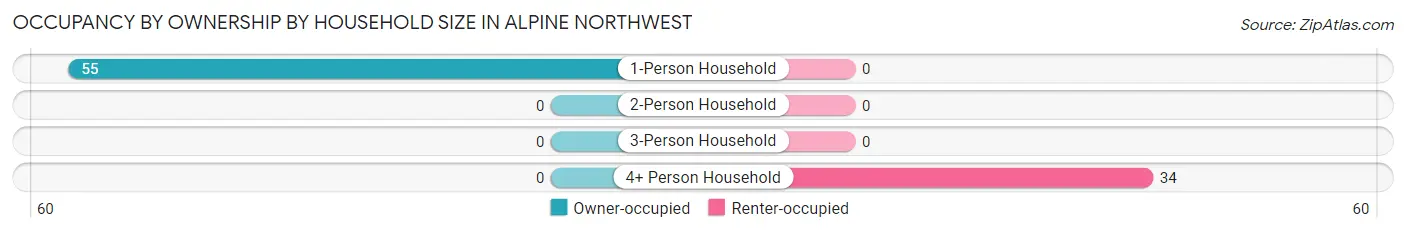
| Household Size | Owner-occupied | Renter-occupied |
| 1-Person Household | 55 (100.0%) | 0 (0.0%) |
| 2-Person Household | 0 (0.0%) | 0 (0.0%) |
| 3-Person Household | 0 (0.0%) | 0 (0.0%) |
| 4+ Person Household | 0 (0.0%) | 34 (100.0%) |
| Total Housing Units | 55 (61.8%) | 34 (38.2%) |
Occupancy by Educational Attainment in Alpine Northwest
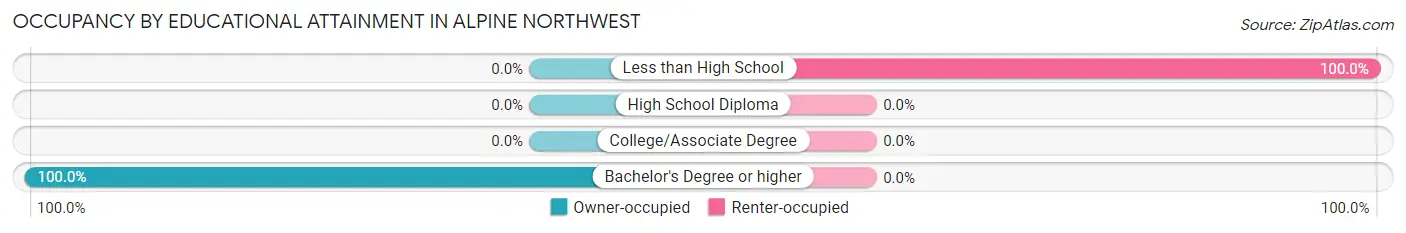
| Household Size | Owner-occupied | Renter-occupied |
| Less than High School | 0 (0.0%) | 34 (100.0%) |
| High School Diploma | 0 (0.0%) | 0 (0.0%) |
| College/Associate Degree | 0 (0.0%) | 0 (0.0%) |
| Bachelor's Degree or higher | 55 (100.0%) | 0 (0.0%) |
Occupancy by Age of Householder in Alpine Northwest
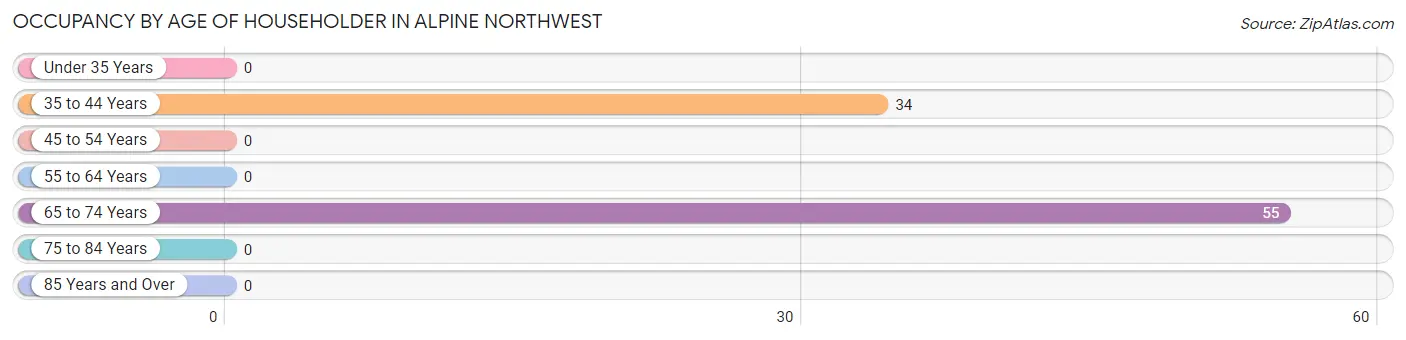
| Age Bracket | # Households | % Households |
| Under 35 Years | 0 | 0.0% |
| 35 to 44 Years | 34 | 38.2% |
| 45 to 54 Years | 0 | 0.0% |
| 55 to 64 Years | 0 | 0.0% |
| 65 to 74 Years | 55 | 61.8% |
| 75 to 84 Years | 0 | 0.0% |
| 85 Years and Over | 0 | 0.0% |
| Total | 89 | 100.0% |
Housing Finances in Alpine Northwest
Median Income by Occupancy in Alpine Northwest
| Occupancy Type | # Households | Median Income |
| Owner-Occupied | 55 (61.8%) | $0 |
| Renter-Occupied | 34 (38.2%) | $0 |
| Average | 89 (100.0%) | $0 |
Occupancy by Householder Income Bracket in Alpine Northwest
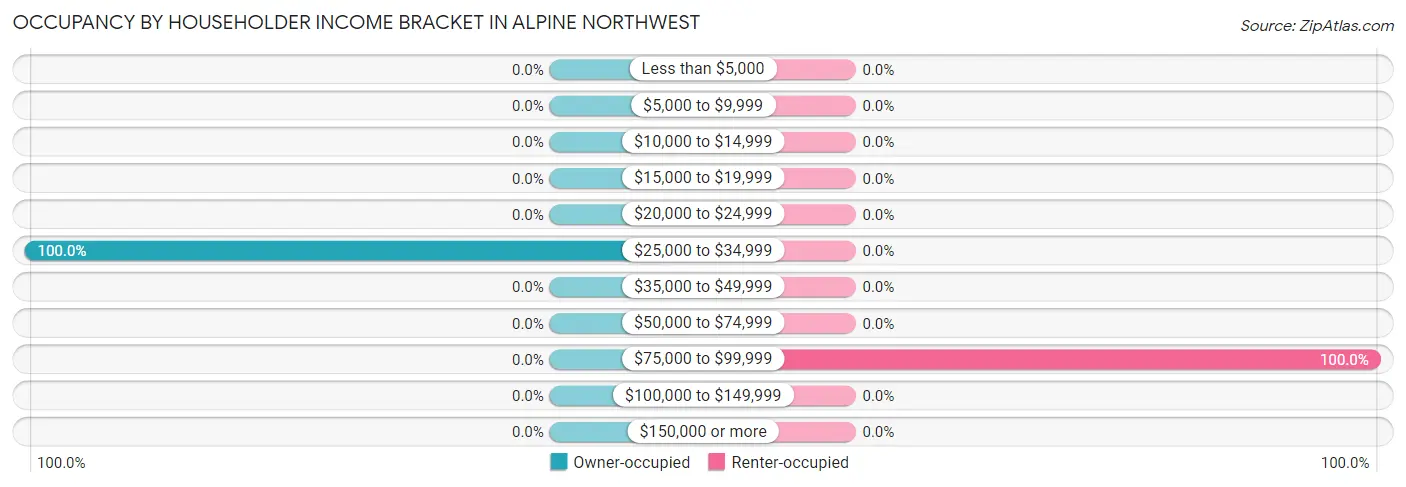
| Income Bracket | Owner-occupied | Renter-occupied |
| Less than $5,000 | 0 (0.0%) | 0 (0.0%) |
| $5,000 to $9,999 | 0 (0.0%) | 0 (0.0%) |
| $10,000 to $14,999 | 0 (0.0%) | 0 (0.0%) |
| $15,000 to $19,999 | 0 (0.0%) | 0 (0.0%) |
| $20,000 to $24,999 | 0 (0.0%) | 0 (0.0%) |
| $25,000 to $34,999 | 55 (100.0%) | 0 (0.0%) |
| $35,000 to $49,999 | 0 (0.0%) | 0 (0.0%) |
| $50,000 to $74,999 | 0 (0.0%) | 0 (0.0%) |
| $75,000 to $99,999 | 0 (0.0%) | 34 (100.0%) |
| $100,000 to $149,999 | 0 (0.0%) | 0 (0.0%) |
| $150,000 or more | 0 (0.0%) | 0 (0.0%) |
| Total | 55 (100.0%) | 34 (100.0%) |
Monthly Housing Cost Tiers in Alpine Northwest
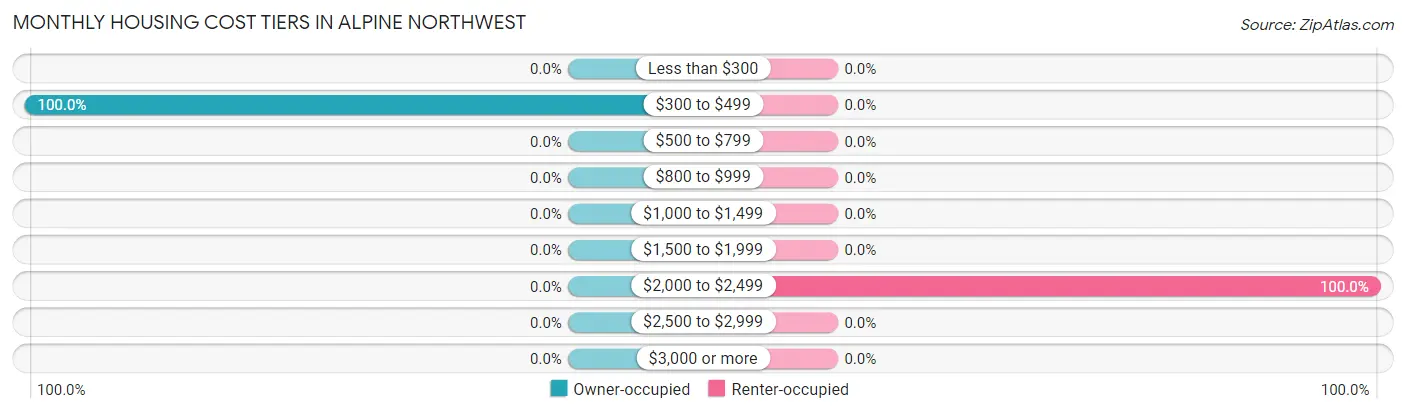
| Monthly Cost | Owner-occupied | Renter-occupied |
| Less than $300 | 0 (0.0%) | 0 (0.0%) |
| $300 to $499 | 55 (100.0%) | 0 (0.0%) |
| $500 to $799 | 0 (0.0%) | 0 (0.0%) |
| $800 to $999 | 0 (0.0%) | 0 (0.0%) |
| $1,000 to $1,499 | 0 (0.0%) | 0 (0.0%) |
| $1,500 to $1,999 | 0 (0.0%) | 0 (0.0%) |
| $2,000 to $2,499 | 0 (0.0%) | 34 (100.0%) |
| $2,500 to $2,999 | 0 (0.0%) | 0 (0.0%) |
| $3,000 or more | 0 (0.0%) | 0 (0.0%) |
| Total | 55 (100.0%) | 34 (100.0%) |
Physical Housing Characteristics in Alpine Northwest
Housing Structures in Alpine Northwest
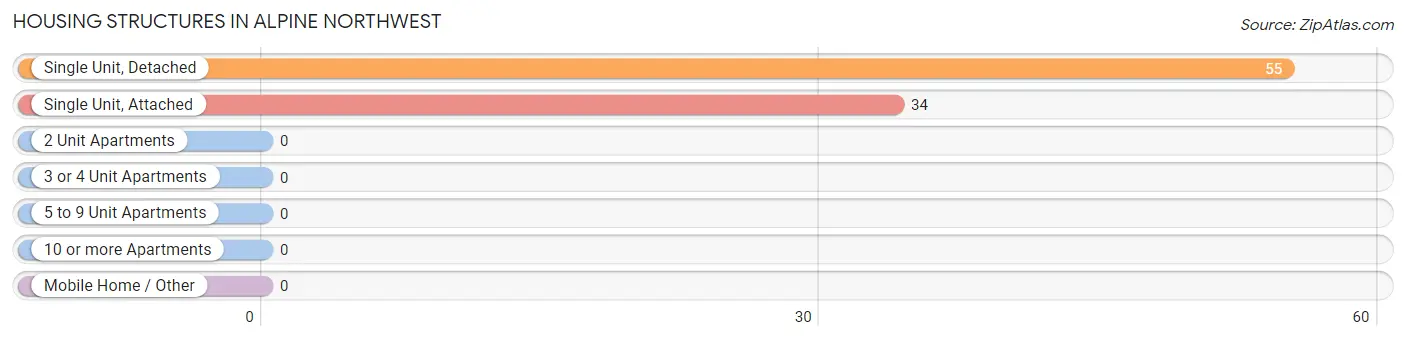
| Structure Type | # Housing Units | % Housing Units |
| Single Unit, Detached | 55 | 61.8% |
| Single Unit, Attached | 34 | 38.2% |
| 2 Unit Apartments | 0 | 0.0% |
| 3 or 4 Unit Apartments | 0 | 0.0% |
| 5 to 9 Unit Apartments | 0 | 0.0% |
| 10 or more Apartments | 0 | 0.0% |
| Mobile Home / Other | 0 | 0.0% |
| Total | 89 | 100.0% |
Housing Structures by Occupancy in Alpine Northwest
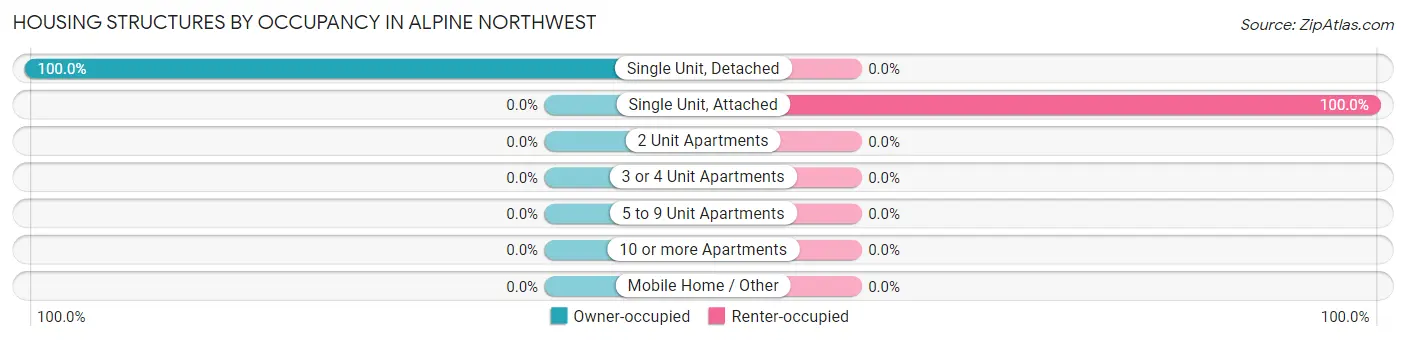
| Structure Type | Owner-occupied | Renter-occupied |
| Single Unit, Detached | 55 (100.0%) | 0 (0.0%) |
| Single Unit, Attached | 0 (0.0%) | 34 (100.0%) |
| 2 Unit Apartments | 0 (0.0%) | 0 (0.0%) |
| 3 or 4 Unit Apartments | 0 (0.0%) | 0 (0.0%) |
| 5 to 9 Unit Apartments | 0 (0.0%) | 0 (0.0%) |
| 10 or more Apartments | 0 (0.0%) | 0 (0.0%) |
| Mobile Home / Other | 0 (0.0%) | 0 (0.0%) |
| Total | 55 (61.8%) | 34 (38.2%) |
Housing Structures by Number of Rooms in Alpine Northwest
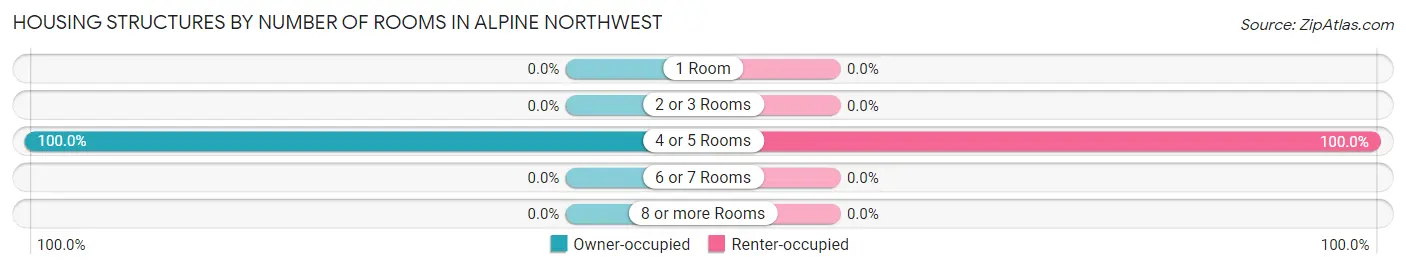
| Number of Rooms | Owner-occupied | Renter-occupied |
| 1 Room | 0 (0.0%) | 0 (0.0%) |
| 2 or 3 Rooms | 0 (0.0%) | 0 (0.0%) |
| 4 or 5 Rooms | 55 (100.0%) | 34 (100.0%) |
| 6 or 7 Rooms | 0 (0.0%) | 0 (0.0%) |
| 8 or more Rooms | 0 (0.0%) | 0 (0.0%) |
| Total | 55 (100.0%) | 34 (100.0%) |
Housing Structure by Heating Type in Alpine Northwest
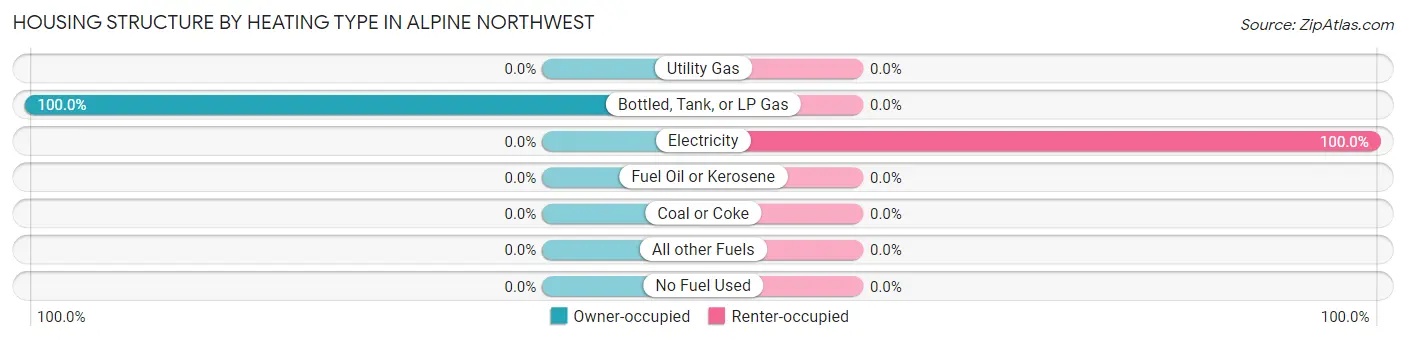
| Heating Type | Owner-occupied | Renter-occupied |
| Utility Gas | 0 (0.0%) | 0 (0.0%) |
| Bottled, Tank, or LP Gas | 55 (100.0%) | 0 (0.0%) |
| Electricity | 0 (0.0%) | 34 (100.0%) |
| Fuel Oil or Kerosene | 0 (0.0%) | 0 (0.0%) |
| Coal or Coke | 0 (0.0%) | 0 (0.0%) |
| All other Fuels | 0 (0.0%) | 0 (0.0%) |
| No Fuel Used | 0 (0.0%) | 0 (0.0%) |
| Total | 55 (100.0%) | 34 (100.0%) |
Household Vehicle Usage in Alpine Northwest
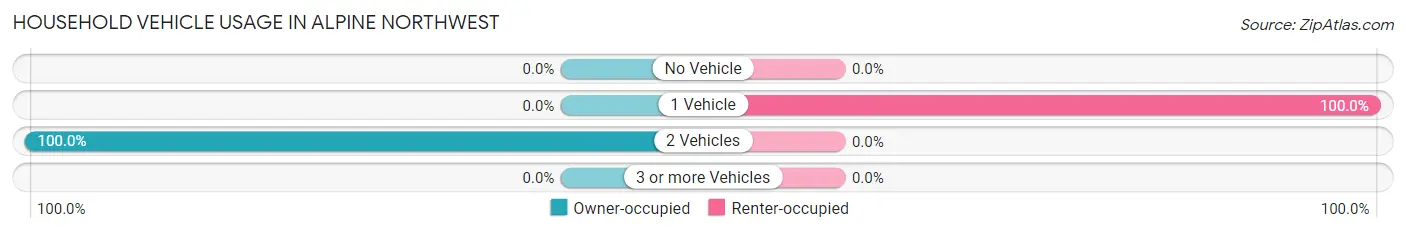
| Vehicles per Household | Owner-occupied | Renter-occupied |
| No Vehicle | 0 (0.0%) | 0 (0.0%) |
| 1 Vehicle | 0 (0.0%) | 34 (100.0%) |
| 2 Vehicles | 55 (100.0%) | 0 (0.0%) |
| 3 or more Vehicles | 0 (0.0%) | 0 (0.0%) |
| Total | 55 (100.0%) | 34 (100.0%) |
Real Estate & Mortgages in Alpine Northwest
Real Estate and Mortgage Overview in Alpine Northwest
| Characteristic | Without Mortgage | With Mortgage |
| Housing Units | 55 | 0 |
| Median Property Value | - | - |
| Median Household Income | - | - |
| Monthly Housing Costs | - | - |
| Real Estate Taxes | - | - |
Property Value by Mortgage Status in Alpine Northwest
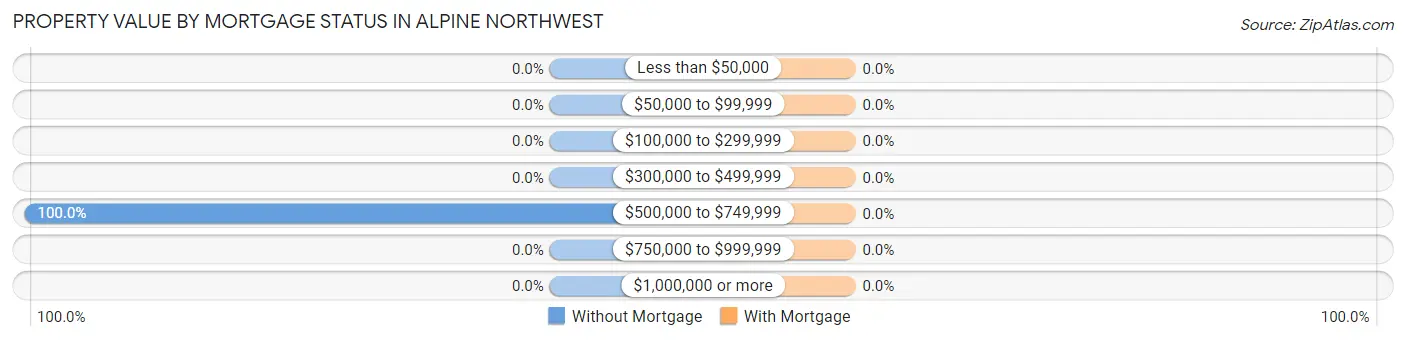
| Property Value | Without Mortgage | With Mortgage |
| Less than $50,000 | 0 (0.0%) | 0 (0.0%) |
| $50,000 to $99,999 | 0 (0.0%) | 0 (0.0%) |
| $100,000 to $299,999 | 0 (0.0%) | 0 (0.0%) |
| $300,000 to $499,999 | 0 (0.0%) | 0 (0.0%) |
| $500,000 to $749,999 | 55 (100.0%) | 0 (0.0%) |
| $750,000 to $999,999 | 0 (0.0%) | 0 (0.0%) |
| $1,000,000 or more | 0 (0.0%) | 0 (0.0%) |
| Total | 55 (100.0%) | 0 (0.0%) |
Household Income by Mortgage Status in Alpine Northwest
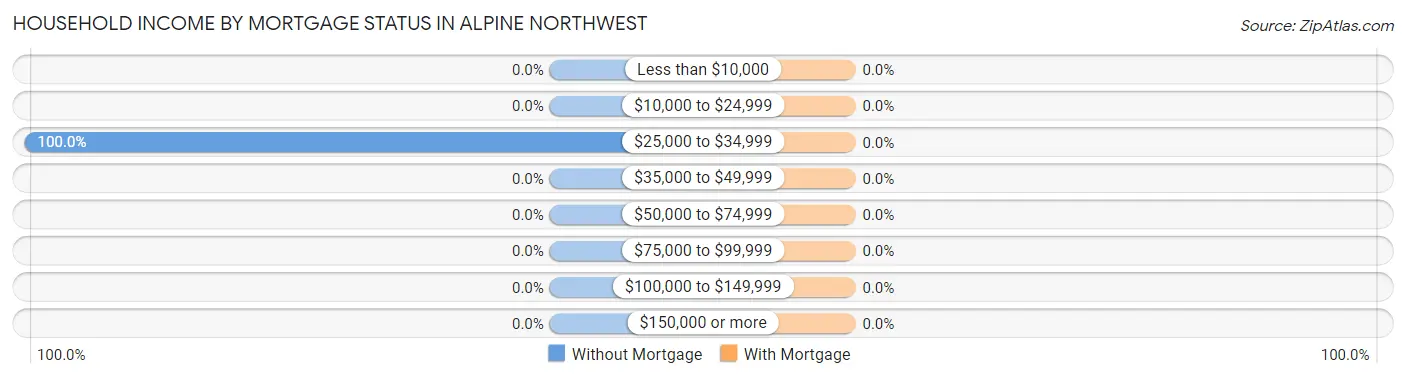
| Household Income | Without Mortgage | With Mortgage |
| Less than $10,000 | 0 (0.0%) | 0 (0.0%) |
| $10,000 to $24,999 | 0 (0.0%) | 0 (0.0%) |
| $25,000 to $34,999 | 55 (100.0%) | 0 (0.0%) |
| $35,000 to $49,999 | 0 (0.0%) | 0 (0.0%) |
| $50,000 to $74,999 | 0 (0.0%) | 0 (0.0%) |
| $75,000 to $99,999 | 0 (0.0%) | 0 (0.0%) |
| $100,000 to $149,999 | 0 (0.0%) | 0 (0.0%) |
| $150,000 or more | 0 (0.0%) | 0 (0.0%) |
| Total | 55 (100.0%) | 0 (0.0%) |
Property Value to Household Income Ratio in Alpine Northwest
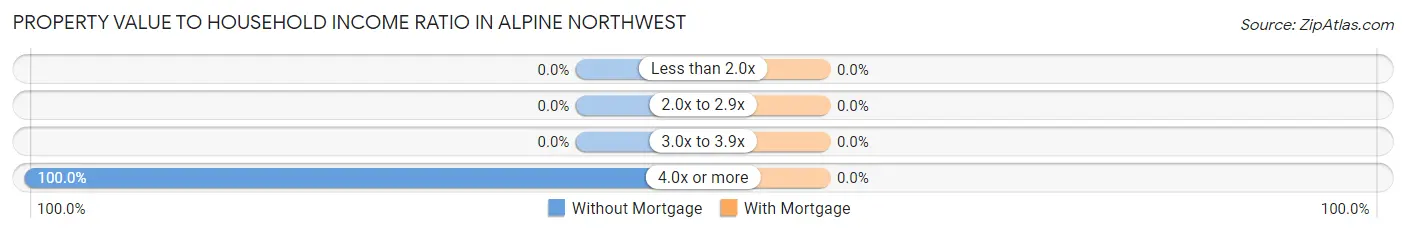
| Value-to-Income Ratio | Without Mortgage | With Mortgage |
| Less than 2.0x | 0 (0.0%) | 0 (0.0%) |
| 2.0x to 2.9x | 0 (0.0%) | 0 (0.0%) |
| 3.0x to 3.9x | 0 (0.0%) | 0 (0.0%) |
| 4.0x or more | 55 (100.0%) | 0 (0.0%) |
| Total | 55 (100.0%) | 0 (0.0%) |
Real Estate Taxes by Mortgage Status in Alpine Northwest
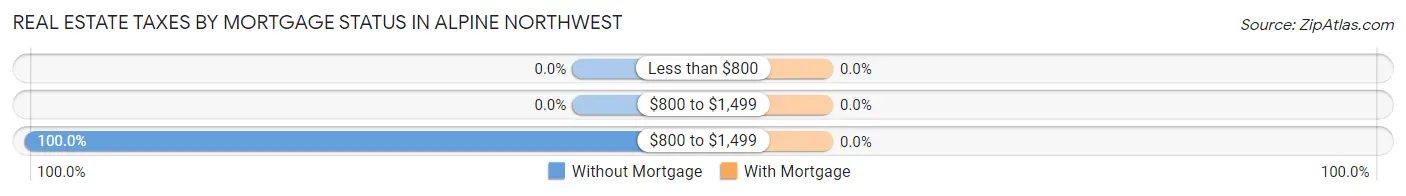
| Property Taxes | Without Mortgage | With Mortgage |
| Less than $800 | 0 (0.0%) | 0 (0.0%) |
| $800 to $1,499 | 0 (0.0%) | 0 (0.0%) |
| $800 to $1,499 | 55 (100.0%) | 0 (0.0%) |
| Total | 55 (100.0%) | 0 (0.0%) |
Health & Disability in Alpine Northwest
Health Insurance Coverage by Age in Alpine Northwest
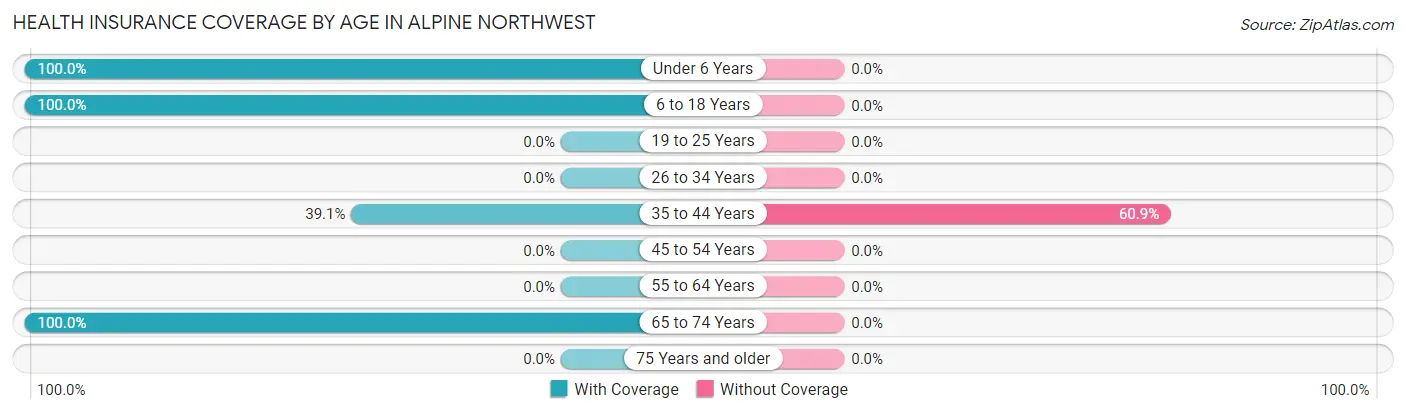
| Age Bracket | With Coverage | Without Coverage |
| Under 6 Years | 25 (100.0%) | 0 (0.0%) |
| 6 to 18 Years | 122 (100.0%) | 0 (0.0%) |
| 19 to 25 Years | 0 (0.0%) | 0 (0.0%) |
| 26 to 34 Years | 0 (0.0%) | 0 (0.0%) |
| 35 to 44 Years | 34 (39.1%) | 53 (60.9%) |
| 45 to 54 Years | 0 (0.0%) | 0 (0.0%) |
| 55 to 64 Years | 0 (0.0%) | 0 (0.0%) |
| 65 to 74 Years | 55 (100.0%) | 0 (0.0%) |
| 75 Years and older | 0 (0.0%) | 0 (0.0%) |
| Total | 236 (81.7%) | 53 (18.3%) |
Health Insurance Coverage by Citizenship Status in Alpine Northwest
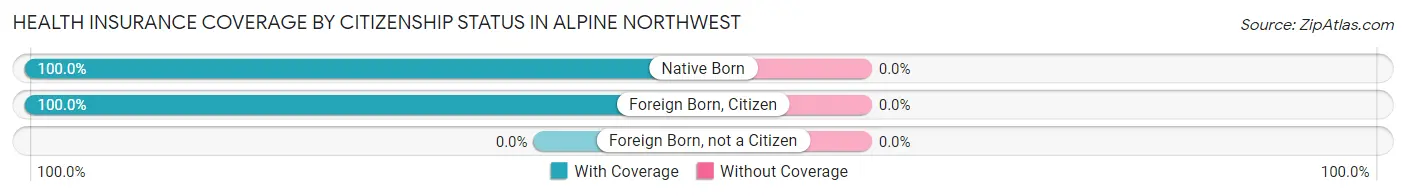
| Citizenship Status | With Coverage | Without Coverage |
| Native Born | 25 (100.0%) | 0 (0.0%) |
| Foreign Born, Citizen | 122 (100.0%) | 0 (0.0%) |
| Foreign Born, not a Citizen | 0 (0.0%) | 0 (0.0%) |
Health Insurance Coverage by Household Income in Alpine Northwest
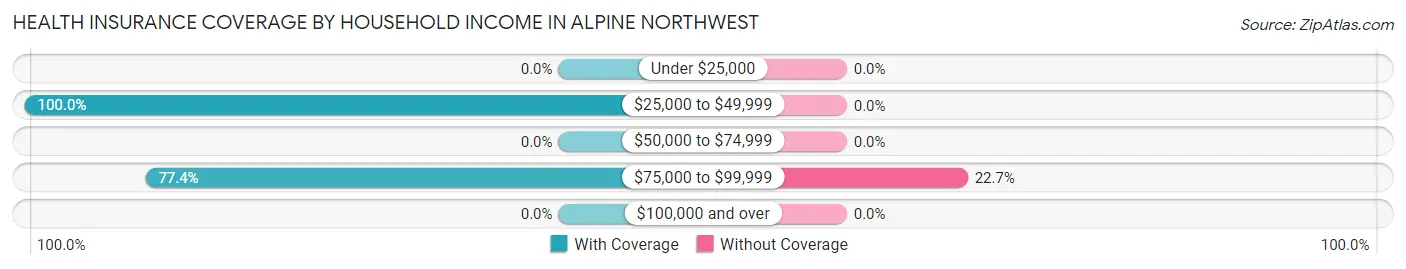
| Household Income | With Coverage | Without Coverage |
| Under $25,000 | 0 (0.0%) | 0 (0.0%) |
| $25,000 to $49,999 | 55 (100.0%) | 0 (0.0%) |
| $50,000 to $74,999 | 0 (0.0%) | 0 (0.0%) |
| $75,000 to $99,999 | 181 (77.3%) | 53 (22.7%) |
| $100,000 and over | 0 (0.0%) | 0 (0.0%) |
Public vs Private Health Insurance Coverage by Age in Alpine Northwest
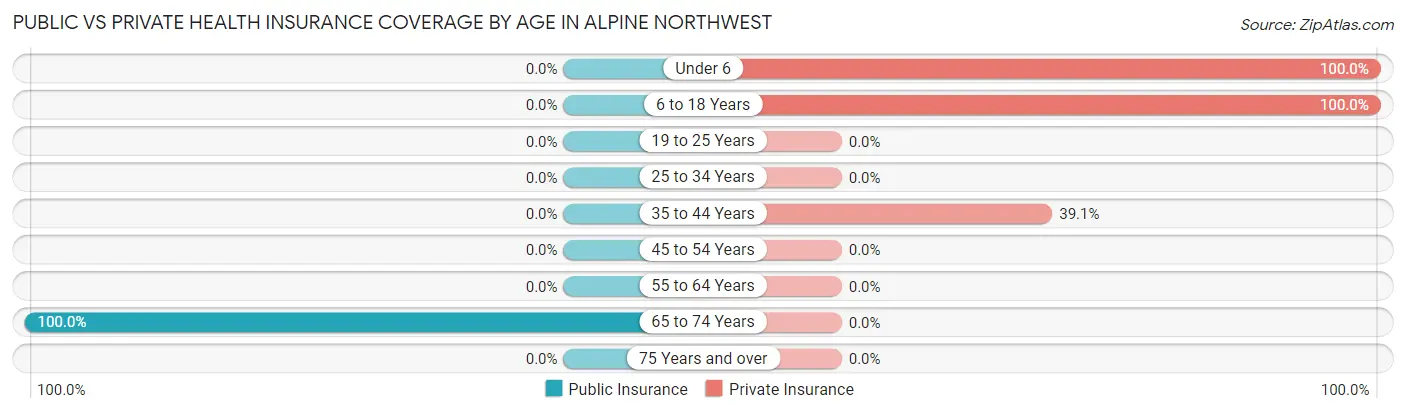
| Age Bracket | Public Insurance | Private Insurance |
| Under 6 | 0 (0.0%) | 25 (100.0%) |
| 6 to 18 Years | 0 (0.0%) | 122 (100.0%) |
| 19 to 25 Years | 0 (0.0%) | 0 (0.0%) |
| 25 to 34 Years | 0 (0.0%) | 0 (0.0%) |
| 35 to 44 Years | 0 (0.0%) | 34 (39.1%) |
| 45 to 54 Years | 0 (0.0%) | 0 (0.0%) |
| 55 to 64 Years | 0 (0.0%) | 0 (0.0%) |
| 65 to 74 Years | 55 (100.0%) | 0 (0.0%) |
| 75 Years and over | 0 (0.0%) | 0 (0.0%) |
| Total | 55 (19.0%) | 181 (62.6%) |
Disability Status by Sex by Age in Alpine Northwest
| Age Bracket | Male | Female |
| Under 5 Years | 0 (0.0%) | 0 (0.0%) |
| 5 to 17 Years | 0 (0.0%) | 0 (0.0%) |
| 18 to 34 Years | 0 (0.0%) | 0 (0.0%) |
| 35 to 64 Years | 0 (0.0%) | 0 (0.0%) |
| 65 to 74 Years | 0 (0.0%) | 0 (0.0%) |
| 75 Years and over | 0 (0.0%) | 0 (0.0%) |
Disability Class by Sex by Age in Alpine Northwest
Disability Class: Hearing Difficulty
| Age Bracket | Male | Female |
| Under 5 Years | 0 (0.0%) | 0 (0.0%) |
| 5 to 17 Years | 0 (0.0%) | 0 (0.0%) |
| 18 to 34 Years | 0 (0.0%) | 0 (0.0%) |
| 35 to 64 Years | 0 (0.0%) | 0 (0.0%) |
| 65 to 74 Years | 0 (0.0%) | 0 (0.0%) |
| 75 Years and over | 0 (0.0%) | 0 (0.0%) |
Disability Class: Vision Difficulty
| Age Bracket | Male | Female |
| Under 5 Years | 0 (0.0%) | 0 (0.0%) |
| 5 to 17 Years | 0 (0.0%) | 0 (0.0%) |
| 18 to 34 Years | 0 (0.0%) | 0 (0.0%) |
| 35 to 64 Years | 0 (0.0%) | 0 (0.0%) |
| 65 to 74 Years | 0 (0.0%) | 0 (0.0%) |
| 75 Years and over | 0 (0.0%) | 0 (0.0%) |
Disability Class: Cognitive Difficulty
| Age Bracket | Male | Female |
| 5 to 17 Years | 0 (0.0%) | 0 (0.0%) |
| 18 to 34 Years | 0 (0.0%) | 0 (0.0%) |
| 35 to 64 Years | 0 (0.0%) | 0 (0.0%) |
| 65 to 74 Years | 0 (0.0%) | 0 (0.0%) |
| 75 Years and over | 0 (0.0%) | 0 (0.0%) |
Disability Class: Ambulatory Difficulty
| Age Bracket | Male | Female |
| 5 to 17 Years | 0 (0.0%) | 0 (0.0%) |
| 18 to 34 Years | 0 (0.0%) | 0 (0.0%) |
| 35 to 64 Years | 0 (0.0%) | 0 (0.0%) |
| 65 to 74 Years | 0 (0.0%) | 0 (0.0%) |
| 75 Years and over | 0 (0.0%) | 0 (0.0%) |
Disability Class: Self-Care Difficulty

| Age Bracket | Male | Female |
| 5 to 17 Years | 0 (0.0%) | 0 (0.0%) |
| 18 to 34 Years | 0 (0.0%) | 0 (0.0%) |
| 35 to 64 Years | 0 (0.0%) | 0 (0.0%) |
| 65 to 74 Years | 0 (0.0%) | 0 (0.0%) |
| 75 Years and over | 0 (0.0%) | 0 (0.0%) |
Technology Access in Alpine Northwest
Computing Device Access in Alpine Northwest
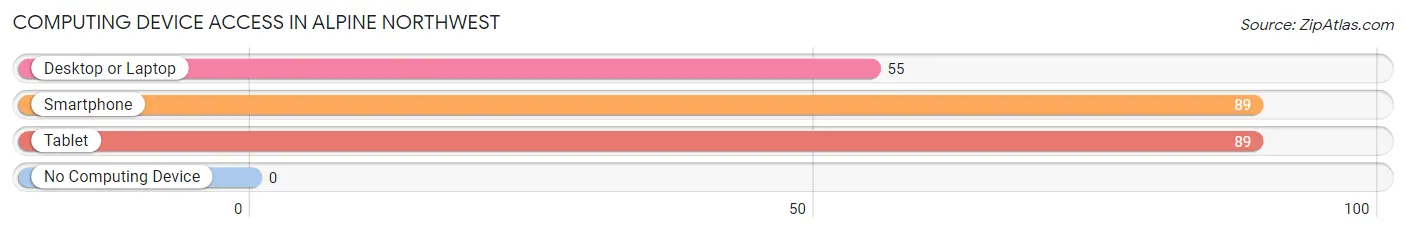
| Device Type | # Households | % Households |
| Desktop or Laptop | 55 | 61.8% |
| Smartphone | 89 | 100.0% |
| Tablet | 89 | 100.0% |
| No Computing Device | 0 | 0.0% |
| Total | 89 | 100.0% |
Internet Access in Alpine Northwest
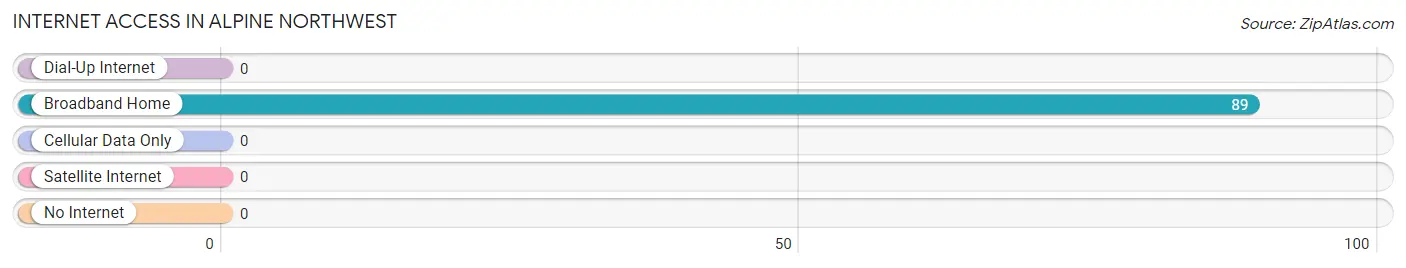
| Internet Type | # Households | % Households |
| Dial-Up Internet | 0 | 0.0% |
| Broadband Home | 89 | 100.0% |
| Cellular Data Only | 0 | 0.0% |
| Satellite Internet | 0 | 0.0% |
| No Internet | 0 | 0.0% |
| Total | 89 | 100.0% |
Alpine Northwest Summary
Alpine Northwest, Wyoming is a small town located in the northwest corner of the state. It is situated in the foothills of the Wind River Range, and is surrounded by the Bridger-Teton National Forest. The town is home to a population of just over 1,000 people, and is a popular destination for outdoor recreation.
History
Alpine Northwest was first settled in the late 1800s by homesteaders who were drawn to the area by its abundant natural resources. The town was originally known as “Alpine”, and was officially incorporated in 1909. The name was changed to “Alpine Northwest” in the early 1920s to distinguish it from other towns in the area.
The town was initially a center for logging and ranching, and the local economy was largely based on these industries. In the 1950s, the town began to attract tourists, and the economy shifted to focus on tourism and recreation.
Geography
Alpine Northwest is located in the northwest corner of Wyoming, in the foothills of the Wind River Range. The town is situated at an elevation of 6,000 feet, and is surrounded by the Bridger-Teton National Forest. The town is located approximately 30 miles from Jackson, Wyoming, and is accessible via US Highway 191.
The town is situated in a semi-arid climate, with hot summers and cold winters. The average annual temperature is around 40 degrees Fahrenheit, and the average annual precipitation is around 12 inches.
Economy
The economy of Alpine Northwest is largely based on tourism and recreation. The town is a popular destination for outdoor activities such as hiking, camping, fishing, and skiing. The town is also home to several restaurants, hotels, and other businesses that cater to tourists.
In addition to tourism, the town is also home to several small businesses, including a lumber mill, a sawmill, and a few small manufacturing companies. The town is also home to a small airport, which serves as a hub for private and commercial flights.
Demographics
As of the 2010 census, the population of Alpine Northwest was 1,072. The town is predominantly white, with a small Hispanic population. The median household income is around $50,000, and the median home value is around $200,000.
The town is served by the Sublette County School District, which includes two elementary schools, one middle school, and one high school. The town is also home to a branch of the University of Wyoming, which offers a variety of degree programs.
Conclusion
Alpine Northwest, Wyoming is a small town located in the northwest corner of the state. It is situated in the foothills of the Wind River Range, and is surrounded by the Bridger-Teton National Forest. The town is home to a population of just over 1,000 people, and is a popular destination for outdoor recreation. The economy of the town is largely based on tourism and recreation, and the town is served by the Sublette County School District.
Common Questions
What is Per Capita Income in Alpine Northwest?
Per Capita income in Alpine Northwest is $17,788.
What is Inequality or Gini Index in Alpine Northwest?
Inequality or Gini Index in Alpine Northwest is 0.23.
What is the Total Population of Alpine Northwest?
Total Population of Alpine Northwest is 289.
What is the Total Male Population of Alpine Northwest?
Total Male Population of Alpine Northwest is 95.
What is the Total Female Population of Alpine Northwest?
Total Female Population of Alpine Northwest is 194.
What is the Ratio of Males per 100 Females in Alpine Northwest?
There are 48.97 Males per 100 Females in Alpine Northwest.
What is the Ratio of Females per 100 Males in Alpine Northwest?
There are 204.21 Females per 100 Males in Alpine Northwest.
What is the Median Population Age in Alpine Northwest?
Median Population Age in Alpine Northwest is 16.0 Years.
What is the Average Family Size in Alpine Northwest
Average Family Size in Alpine Northwest is 6.9 People.
What is the Average Household Size in Alpine Northwest
Average Household Size in Alpine Northwest is 3.2 People.
How Large is the Labor Force in Alpine Northwest?
There are 87 People in the Labor Forcein in Alpine Northwest.
What is the Percentage of People in the Labor Force in Alpine Northwest?
61.3% of People are in the Labor Force in Alpine Northwest.