Clearview Acres, WY Map & Demographics
Clearview Acres Map
Clearview Acres Overview
$27,551
PER CAPITA INCOME
$72,035
AVG FAMILY INCOME
$113,256
AVG HOUSEHOLD INCOME
52.2%
WAGE / INCOME GAP [ % ]
47.8¢/ $1
WAGE / INCOME GAP [ $ ]
0.23
INEQUALITY / GINI INDEX
495
TOTAL POPULATION
368
MALE POPULATION
127
FEMALE POPULATION
289.76
MALES / 100 FEMALES
34.51
FEMALES / 100 MALES
19.8
MEDIAN AGE
3.4
AVG FAMILY SIZE
3.6
AVG HOUSEHOLD SIZE
340
LABOR FORCE [ PEOPLE ]
89.5%
PERCENT IN LABOR FORCE
Income in Clearview Acres
Income Overview in Clearview Acres
Per Capita Income in Clearview Acres is $27,551, while median incomes of families and households are $72,035 and $113,256 respectively.
| Characteristic | Number | Measure |
| Per Capita Income | 495 | $27,551 |
| Median Family Income | 122 | $72,035 |
| Mean Family Income | 122 | $87,720 |
| Median Household Income | 136 | $113,256 |
| Mean Household Income | 136 | $93,987 |
| Income Deficit | 122 | $0 |
| Wage / Income Gap (%) | 495 | 52.19% |
| Wage / Income Gap ($) | 495 | 47.81¢ per $1 |
| Gini / Inequality Index | 495 | 0.23 |
Earnings by Sex in Clearview Acres
Average Earnings in Clearview Acres are $40,266, $40,686 for men and $19,452 for women, a difference of 52.2%.
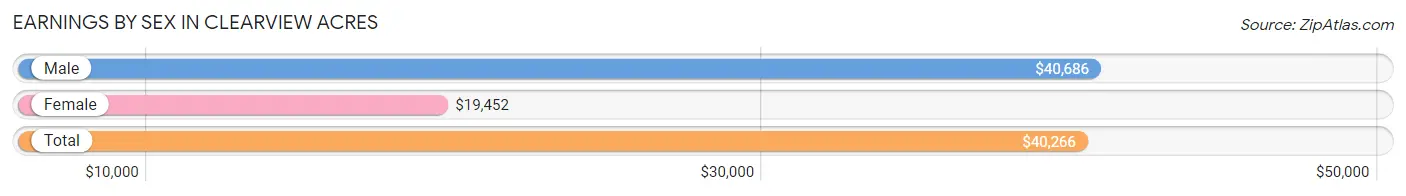
| Sex | Number | Average Earnings |
| Male | 251 (73.8%) | $40,686 |
| Female | 89 (26.2%) | $19,452 |
| Total | 340 (100.0%) | $40,266 |
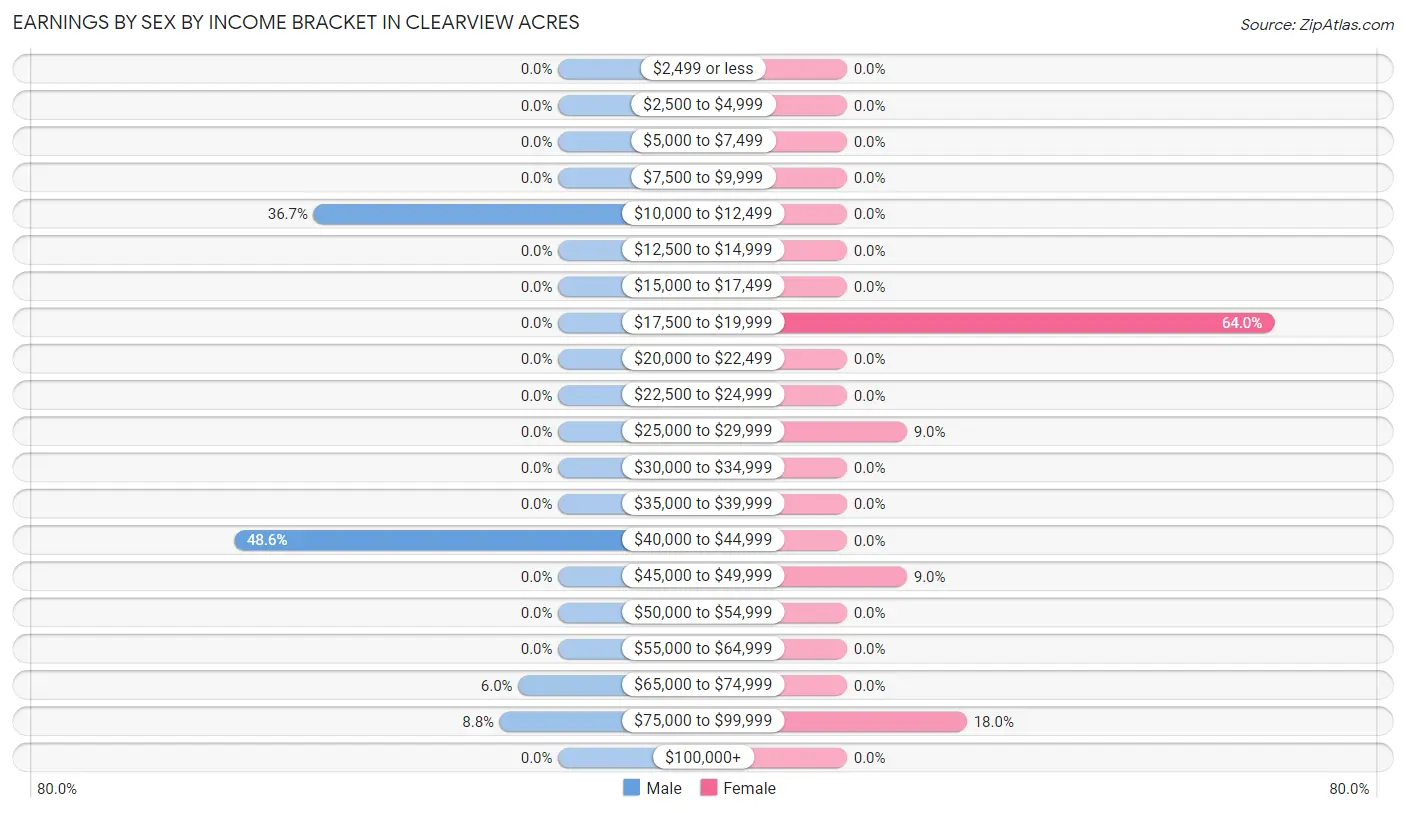
Earnings by Sex by Income Bracket in Clearview Acres
The most common earnings brackets in Clearview Acres are $40,000 to $44,999 for men (122 | 48.6%) and $17,500 to $19,999 for women (57 | 64.0%).
| Income | Male | Female |
| $2,499 or less | 0 (0.0%) | 0 (0.0%) |
| $2,500 to $4,999 | 0 (0.0%) | 0 (0.0%) |
| $5,000 to $7,499 | 0 (0.0%) | 0 (0.0%) |
| $7,500 to $9,999 | 0 (0.0%) | 0 (0.0%) |
| $10,000 to $12,499 | 92 (36.6%) | 0 (0.0%) |
| $12,500 to $14,999 | 0 (0.0%) | 0 (0.0%) |
| $15,000 to $17,499 | 0 (0.0%) | 0 (0.0%) |
| $17,500 to $19,999 | 0 (0.0%) | 57 (64.0%) |
| $20,000 to $22,499 | 0 (0.0%) | 0 (0.0%) |
| $22,500 to $24,999 | 0 (0.0%) | 0 (0.0%) |
| $25,000 to $29,999 | 0 (0.0%) | 8 (9.0%) |
| $30,000 to $34,999 | 0 (0.0%) | 0 (0.0%) |
| $35,000 to $39,999 | 0 (0.0%) | 0 (0.0%) |
| $40,000 to $44,999 | 122 (48.6%) | 0 (0.0%) |
| $45,000 to $49,999 | 0 (0.0%) | 8 (9.0%) |
| $50,000 to $54,999 | 0 (0.0%) | 0 (0.0%) |
| $55,000 to $64,999 | 0 (0.0%) | 0 (0.0%) |
| $65,000 to $74,999 | 15 (6.0%) | 0 (0.0%) |
| $75,000 to $99,999 | 22 (8.8%) | 16 (18.0%) |
| $100,000+ | 0 (0.0%) | 0 (0.0%) |
| Total | 251 (100.0%) | 89 (100.0%) |
Earnings by Sex by Educational Attainment in Clearview Acres
| Educational Attainment | Male Income | Female Income |
| Less than High School | - | - |
| High School Diploma | - | - |
| College or Associate's Degree | - | - |
| Bachelor's Degree | - | - |
| Graduate Degree | - | - |
| Total | $41,629 | $0 |
Family Income in Clearview Acres
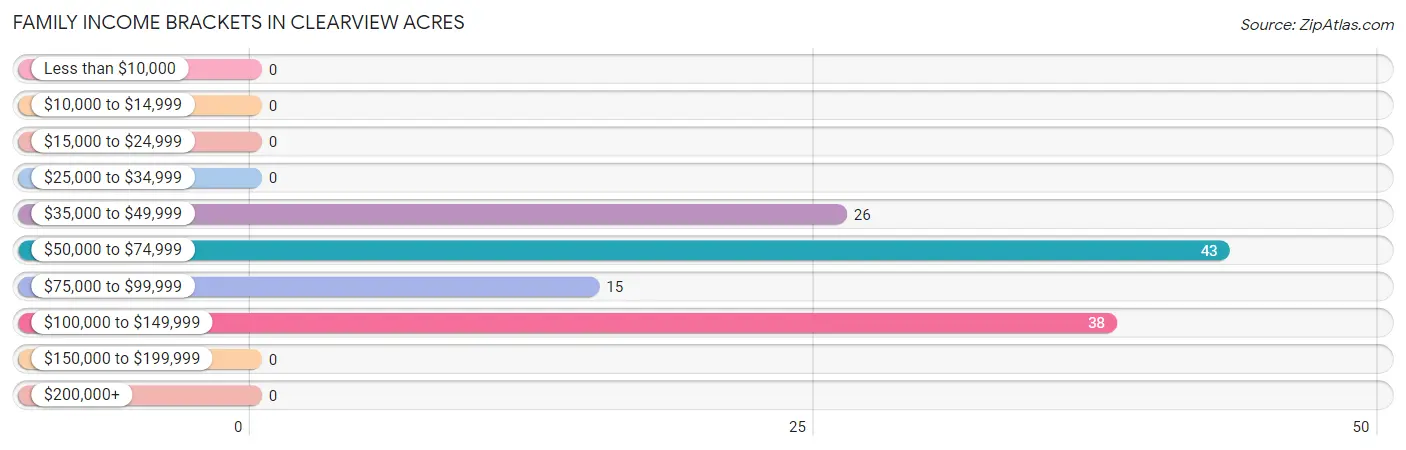
Family Income Brackets in Clearview Acres
According to the Clearview Acres family income data, there are 43 families falling into the $50,000 to $74,999 income range, which is the most common income bracket and makes up 35.2% of all families.
| Income Bracket | # Families | % Families |
| Less than $10,000 | 0 | 0.0% |
| $10,000 to $14,999 | 0 | 0.0% |
| $15,000 to $24,999 | 0 | 0.0% |
| $25,000 to $34,999 | 0 | 0.0% |
| $35,000 to $49,999 | 26 | 21.3% |
| $50,000 to $74,999 | 43 | 35.2% |
| $75,000 to $99,999 | 15 | 12.3% |
| $100,000 to $149,999 | 38 | 31.1% |
| $150,000 to $199,999 | 0 | 0.0% |
| $200,000+ | 0 | 0.0% |
Family Income by Famaliy Size in Clearview Acres
| Income Bracket | # Families | Median Income |
| 2-Person Families | 16 (13.1%) | $0 |
| 3-Person Families | 48 (39.3%) | $0 |
| 4-Person Families | 58 (47.5%) | $0 |
| 5-Person Families | 0 (0.0%) | $0 |
| 6-Person Families | 0 (0.0%) | $0 |
| 7+ Person Families | 0 (0.0%) | $0 |
| Total | 122 (100.0%) | $72,035 |
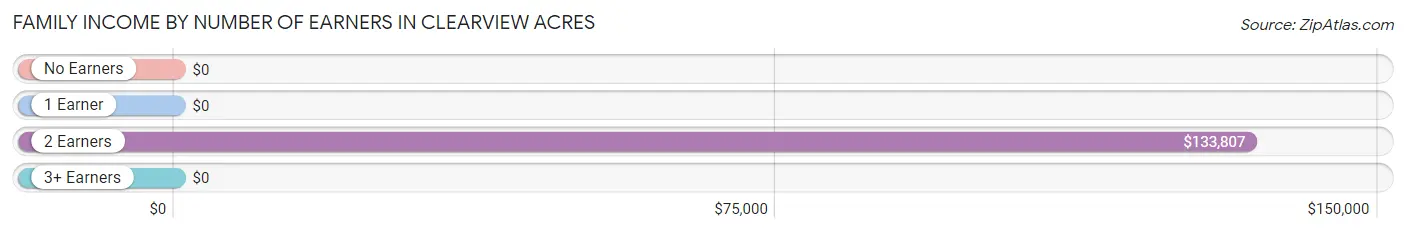
Family Income by Number of Earners in Clearview Acres
| Number of Earners | # Families | Median Income |
| No Earners | 26 (21.3%) | $0 |
| 1 Earner | 0 (0.0%) | $0 |
| 2 Earners | 53 (43.4%) | $133,807 |
| 3+ Earners | 43 (35.2%) | $0 |
| Total | 122 (100.0%) | $72,035 |
Household Income in Clearview Acres
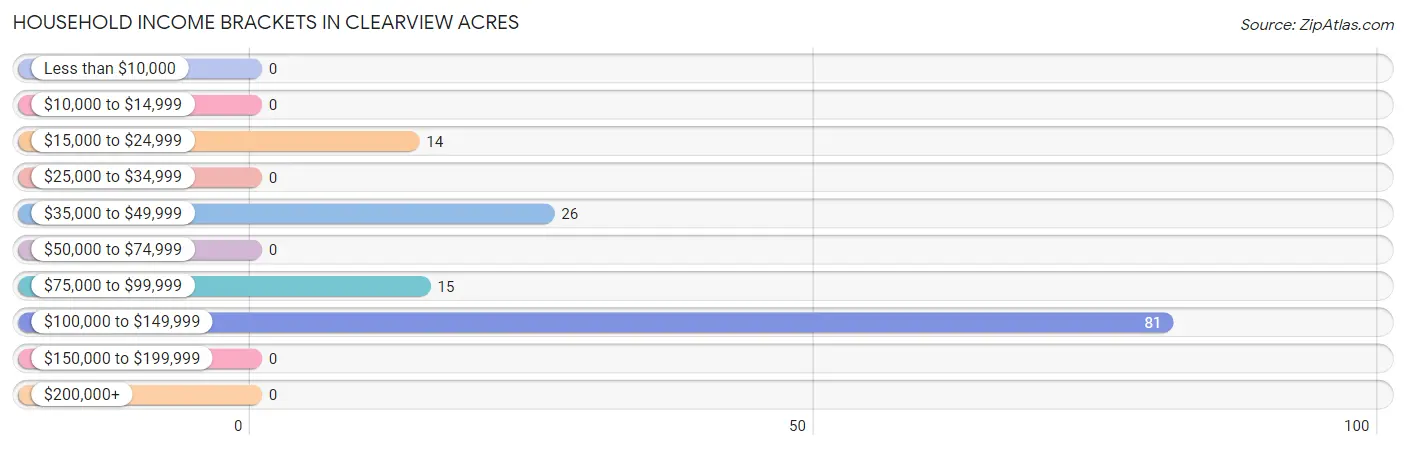
Household Income Brackets in Clearview Acres
With 81 households falling in the category, the $100,000 to $149,999 income range is the most frequent in Clearview Acres, accounting for 59.6% of all households.
| Income Bracket | # Households | % Households |
| Less than $10,000 | 0 | 0.0% |
| $10,000 to $14,999 | 0 | 0.0% |
| $15,000 to $24,999 | 14 | 10.3% |
| $25,000 to $34,999 | 0 | 0.0% |
| $35,000 to $49,999 | 26 | 19.1% |
| $50,000 to $74,999 | 0 | 0.0% |
| $75,000 to $99,999 | 15 | 11.0% |
| $100,000 to $149,999 | 81 | 59.6% |
| $150,000 to $199,999 | 0 | 0.0% |
| $200,000+ | 0 | 0.0% |
Household Income by Householder Age in Clearview Acres
The median household income in Clearview Acres is $113,256, with the highest median household income of $114,855 found in the 45 to 64 years age bracket for the primary householder. A total of 81 households (59.6%) fall into this category.
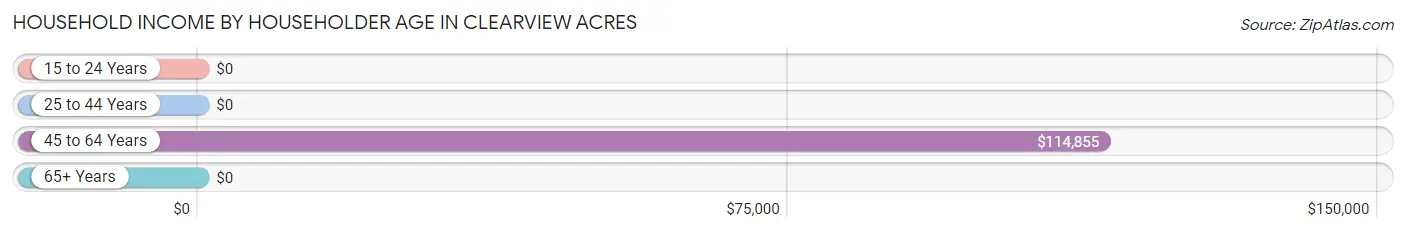
| Income Bracket | # Households | Median Income |
| 15 to 24 Years | 0 (0.0%) | $0 |
| 25 to 44 Years | 15 (11.0%) | $0 |
| 45 to 64 Years | 81 (59.6%) | $114,855 |
| 65+ Years | 40 (29.4%) | $0 |
| Total | 136 (100.0%) | $113,256 |
Poverty in Clearview Acres
Income Below Poverty by Sex and Age in Clearview Acres
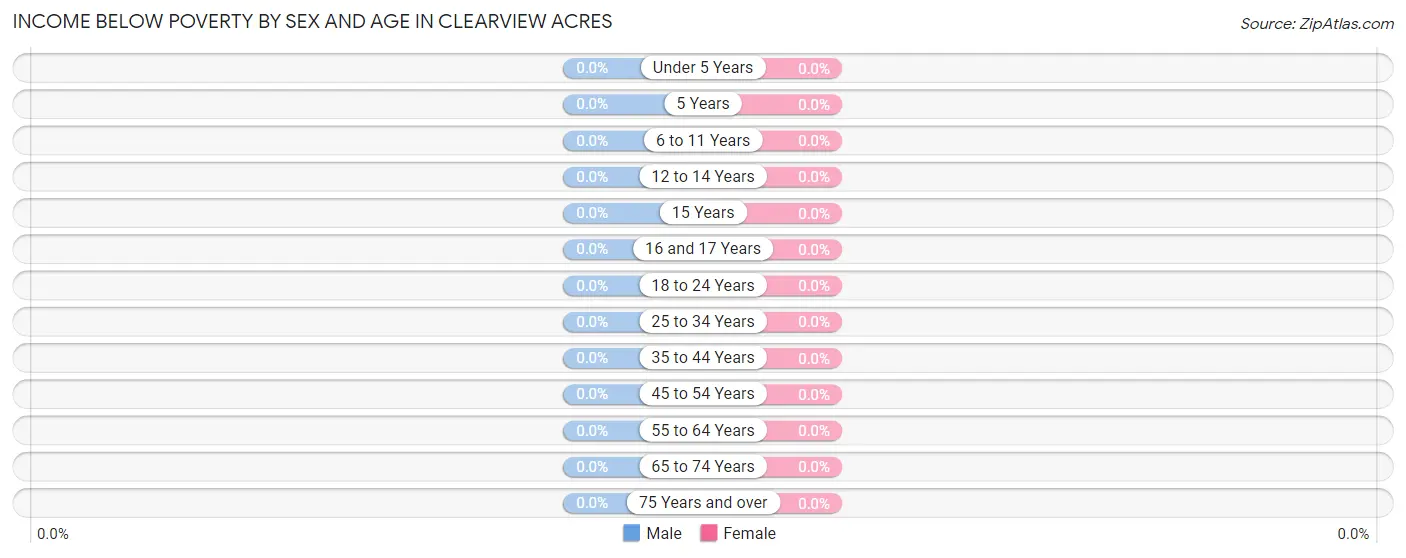
| Age Bracket | Male | Female |
| Under 5 Years | 0 (0.0%) | 0 (0.0%) |
| 5 Years | 0 (0.0%) | 0 (0.0%) |
| 6 to 11 Years | 0 (0.0%) | 0 (0.0%) |
| 12 to 14 Years | 0 (0.0%) | 0 (0.0%) |
| 15 Years | 0 (0.0%) | 0 (0.0%) |
| 16 and 17 Years | 0 (0.0%) | 0 (0.0%) |
| 18 to 24 Years | 0 (0.0%) | 0 (0.0%) |
| 25 to 34 Years | 0 (0.0%) | 0 (0.0%) |
| 35 to 44 Years | 0 (0.0%) | 0 (0.0%) |
| 45 to 54 Years | 0 (0.0%) | 0 (0.0%) |
| 55 to 64 Years | 0 (0.0%) | 0 (0.0%) |
| 65 to 74 Years | 0 (0.0%) | 0 (0.0%) |
| 75 Years and over | 0 (0.0%) | 0 (0.0%) |
| Total | 0 (0.0%) | 0 (0.0%) |
Income Above Poverty by Sex and Age in Clearview Acres
According to the poverty statistics in Clearview Acres, males aged 6 to 11 years and females aged under 5 years are the age groups that are most secure financially, with 100.0% of males and 100.0% of females in these age groups living above the poverty line.
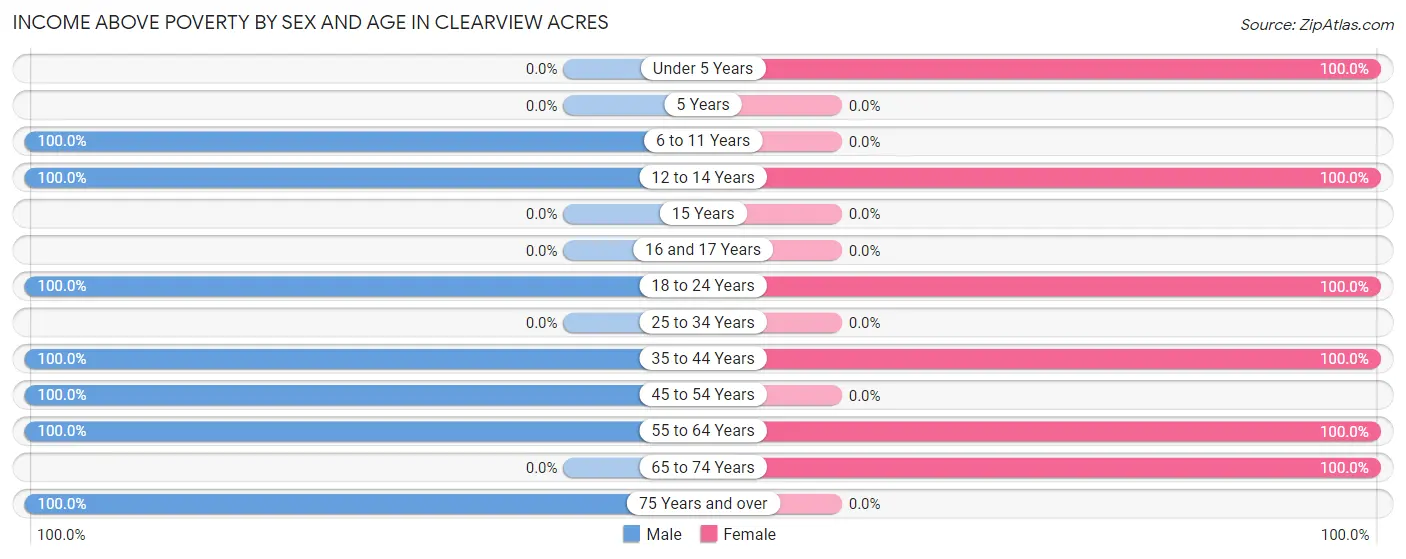
| Age Bracket | Male | Female |
| Under 5 Years | 0 (0.0%) | 3 (100.0%) |
| 5 Years | 0 (0.0%) | 0 (0.0%) |
| 6 to 11 Years | 46 (100.0%) | 0 (0.0%) |
| 12 to 14 Years | 57 (100.0%) | 9 (100.0%) |
| 15 Years | 0 (0.0%) | 0 (0.0%) |
| 16 and 17 Years | 0 (0.0%) | 0 (0.0%) |
| 18 to 24 Years | 92 (100.0%) | 57 (100.0%) |
| 25 to 34 Years | 0 (0.0%) | 0 (0.0%) |
| 35 to 44 Years | 15 (100.0%) | 16 (100.0%) |
| 45 to 54 Years | 105 (100.0%) | 0 (0.0%) |
| 55 to 64 Years | 39 (100.0%) | 16 (100.0%) |
| 65 to 74 Years | 0 (0.0%) | 26 (100.0%) |
| 75 Years and over | 14 (100.0%) | 0 (0.0%) |
| Total | 368 (100.0%) | 127 (100.0%) |
Income Below Poverty Among Married-Couple Families in Clearview Acres
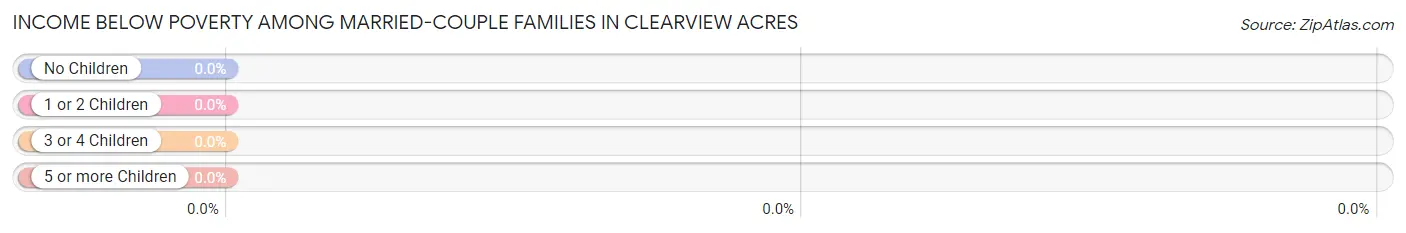
| Children | Above Poverty | Below Poverty |
| No Children | 16 (100.0%) | 0 (0.0%) |
| 1 or 2 Children | 37 (100.0%) | 0 (0.0%) |
| 3 or 4 Children | 0 (0.0%) | 0 (0.0%) |
| 5 or more Children | 0 (0.0%) | 0 (0.0%) |
| Total | 53 (100.0%) | 0 (0.0%) |
Income Below Poverty Among Single-Parent Households in Clearview Acres
| Children | Single Father | Single Mother |
| No Children | 0 (0.0%) | 0 (0.0%) |
| 1 or 2 Children | 0 (0.0%) | 0 (0.0%) |
| 3 or 4 Children | 0 (0.0%) | 0 (0.0%) |
| 5 or more Children | 0 (0.0%) | 0 (0.0%) |
| Total | 0 (0.0%) | 0 (0.0%) |
Income Below Poverty Among Married-Couple vs Single-Parent Households in Clearview Acres
| Children | Married-Couple Families | Single-Parent Households |
| No Children | 0 (0.0%) | 0 (0.0%) |
| 1 or 2 Children | 0 (0.0%) | 0 (0.0%) |
| 3 or 4 Children | 0 (0.0%) | 0 (0.0%) |
| 5 or more Children | 0 (0.0%) | 0 (0.0%) |
| Total | 0 (0.0%) | 0 (0.0%) |
Race in Clearview Acres
The most populous races in Clearview Acres are White / Caucasian (470 | 95.0%), Hispanic or Latino (350 | 70.7%), and Native / Alaskan (22 | 4.4%).
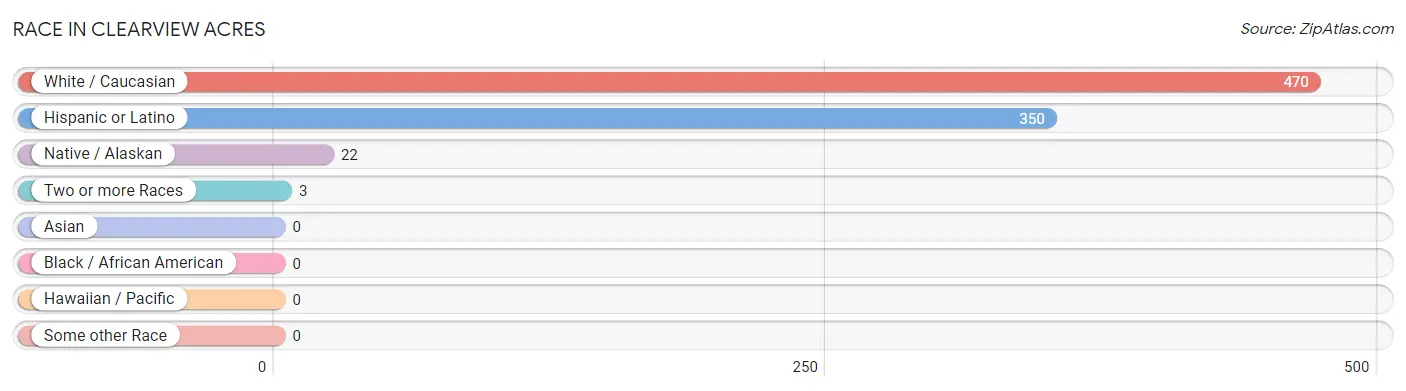
| Race | # Population | % Population |
| Asian | 0 | 0.0% |
| Black / African American | 0 | 0.0% |
| Hawaiian / Pacific | 0 | 0.0% |
| Hispanic or Latino | 350 | 70.7% |
| Native / Alaskan | 22 | 4.4% |
| White / Caucasian | 470 | 95.0% |
| Two or more Races | 3 | 0.6% |
| Some other Race | 0 | 0.0% |
| Total | 495 | 100.0% |
Ancestry in Clearview Acres
The most populous ancestries reported in Clearview Acres are Mexican (350 | 70.7%), Creek (25 | 5.1%), German (24 | 4.9%), and French (11 | 2.2%), together accounting for 82.8% of all Clearview Acres residents.
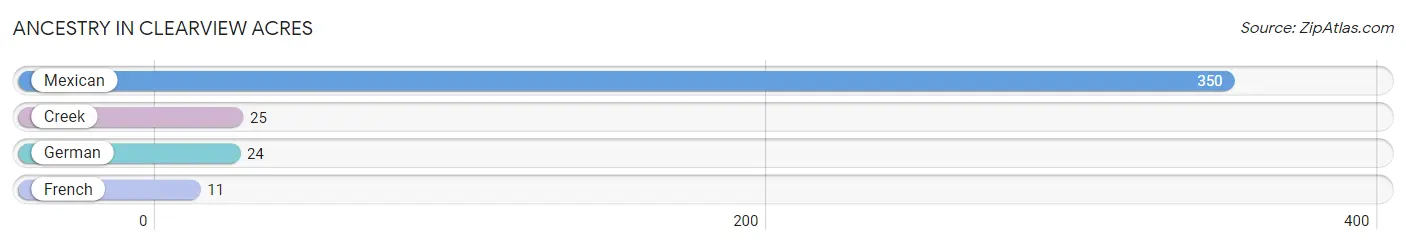
| Ancestry | # Population | % Population |
| Creek | 25 | 5.1% |
| French | 11 | 2.2% |
| German | 24 | 4.9% |
| Mexican | 350 | 70.7% | View All 4 Rows |
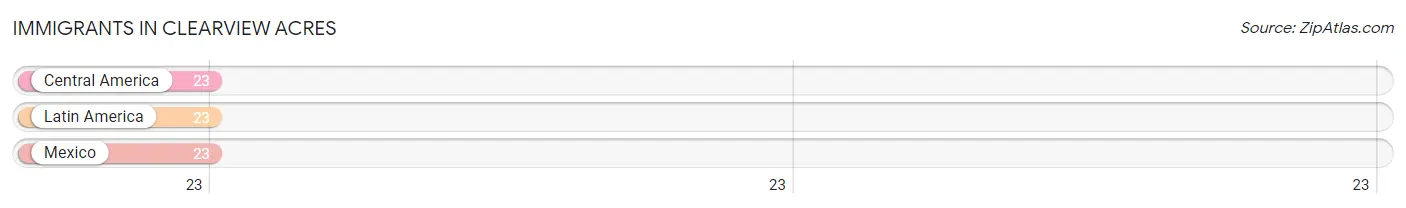
Immigrants in Clearview Acres
The most numerous immigrant groups reported in Clearview Acres came from Central America (23 | 4.6%), Latin America (23 | 4.6%), and Mexico (23 | 4.6%), together accounting for 14.0% of all Clearview Acres residents.
| Immigration Origin | # Population | % Population |
| Central America | 23 | 4.6% |
| Latin America | 23 | 4.6% |
| Mexico | 23 | 4.6% | View All 3 Rows |
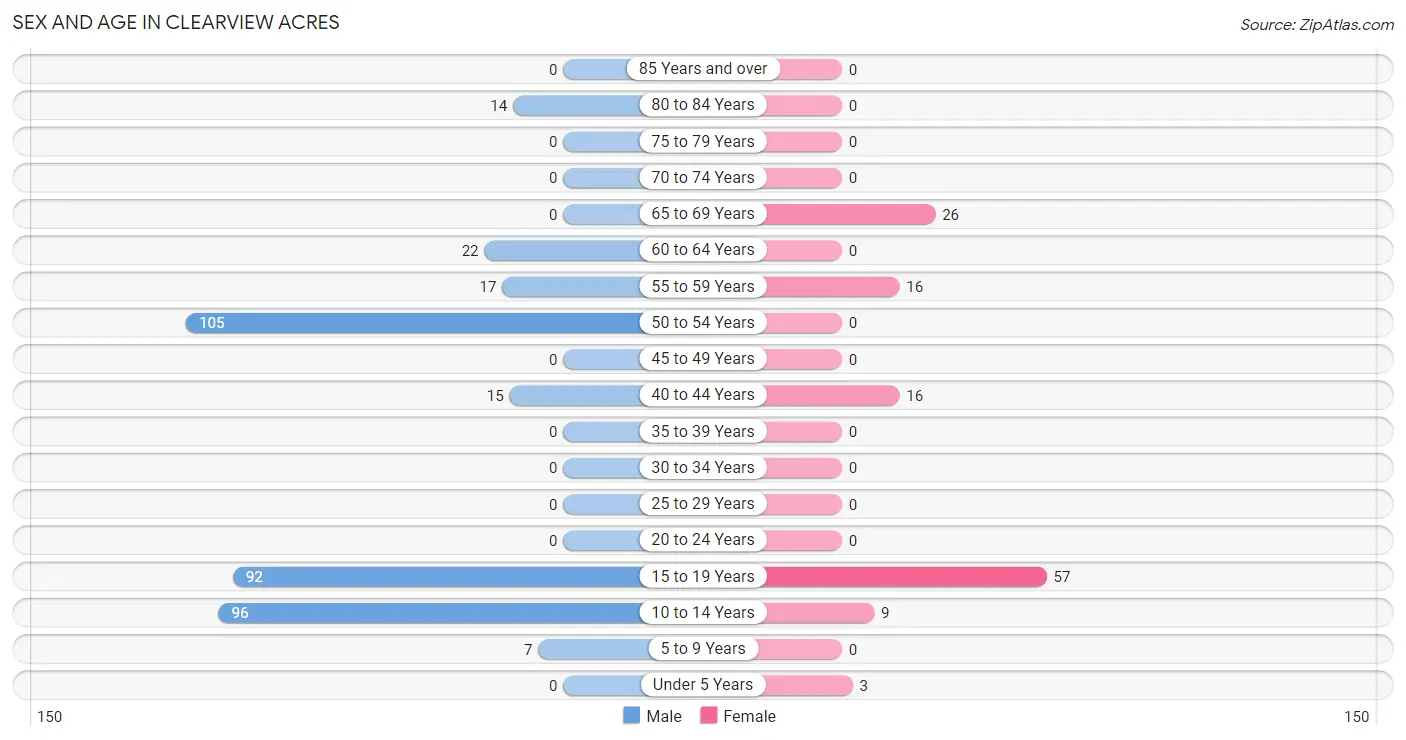
Sex and Age in Clearview Acres
Sex and Age in Clearview Acres
The most populous age groups in Clearview Acres are 50 to 54 Years (105 | 28.5%) for men and 15 to 19 Years (57 | 44.9%) for women.
| Age Bracket | Male | Female |
| Under 5 Years | 0 (0.0%) | 3 (2.4%) |
| 5 to 9 Years | 7 (1.9%) | 0 (0.0%) |
| 10 to 14 Years | 96 (26.1%) | 9 (7.1%) |
| 15 to 19 Years | 92 (25.0%) | 57 (44.9%) |
| 20 to 24 Years | 0 (0.0%) | 0 (0.0%) |
| 25 to 29 Years | 0 (0.0%) | 0 (0.0%) |
| 30 to 34 Years | 0 (0.0%) | 0 (0.0%) |
| 35 to 39 Years | 0 (0.0%) | 0 (0.0%) |
| 40 to 44 Years | 15 (4.1%) | 16 (12.6%) |
| 45 to 49 Years | 0 (0.0%) | 0 (0.0%) |
| 50 to 54 Years | 105 (28.5%) | 0 (0.0%) |
| 55 to 59 Years | 17 (4.6%) | 16 (12.6%) |
| 60 to 64 Years | 22 (6.0%) | 0 (0.0%) |
| 65 to 69 Years | 0 (0.0%) | 26 (20.5%) |
| 70 to 74 Years | 0 (0.0%) | 0 (0.0%) |
| 75 to 79 Years | 0 (0.0%) | 0 (0.0%) |
| 80 to 84 Years | 14 (3.8%) | 0 (0.0%) |
| 85 Years and over | 0 (0.0%) | 0 (0.0%) |
| Total | 368 (100.0%) | 127 (100.0%) |
Families and Households in Clearview Acres
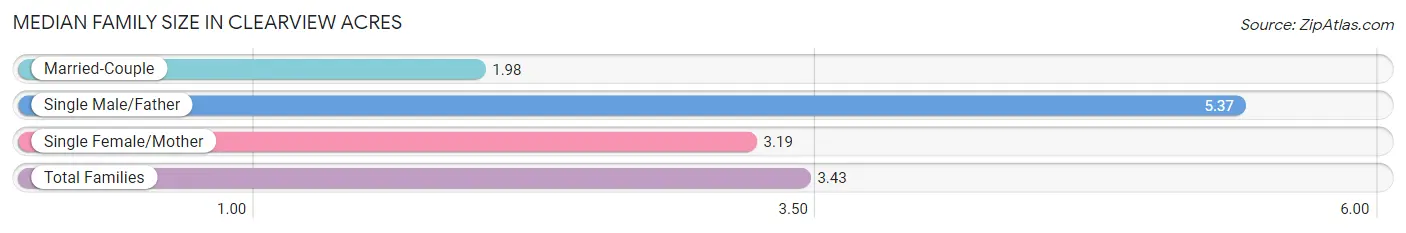
Median Family Size in Clearview Acres
The median family size in Clearview Acres is 3.43 persons per family, with single male/father families (43 | 35.2%) accounting for the largest median family size of 5.37 persons per family. On the other hand, married-couple families (53 | 43.4%) represent the smallest median family size with 1.98 persons per family.
| Family Type | # Families | Family Size |
| Married-Couple | 53 (43.4%) | 1.98 |
| Single Male/Father | 43 (35.2%) | 5.37 |
| Single Female/Mother | 26 (21.3%) | 3.19 |
| Total Families | 122 (100.0%) | 3.43 |
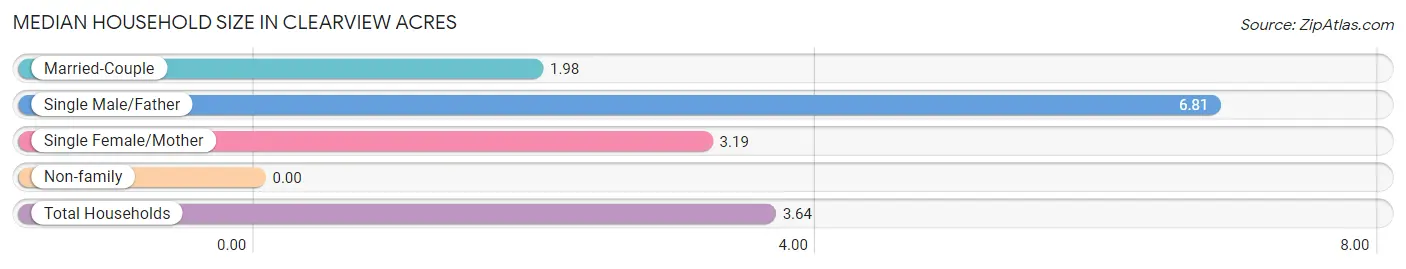
Median Household Size in Clearview Acres
| Household Type | # Households | Household Size |
| Married-Couple | 53 (39.0%) | 1.98 |
| Single Male/Father | 43 (31.6%) | 6.81 |
| Single Female/Mother | 26 (19.1%) | 3.19 |
| Non-family | 14 (10.3%) | - |
| Total Households | 136 (100.0%) | 3.64 |
Household Size by Marriage Status in Clearview Acres
Out of a total of 136 households in Clearview Acres, 122 (89.7%) are family households, while 14 (10.3%) are nonfamily households. The most numerous type of family households are 3-person households, comprising 48, and the most common type of nonfamily households are 1-person households, comprising 14.
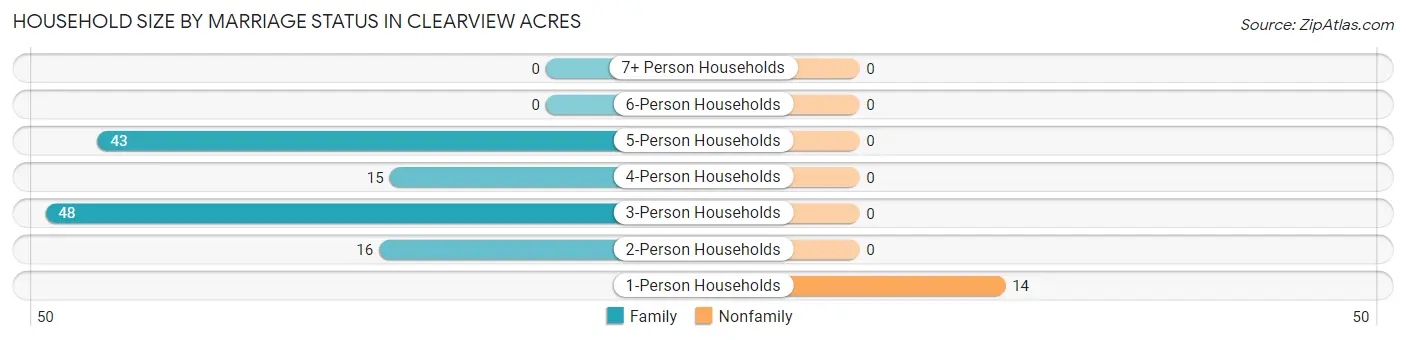
| Household Size | Family Households | Nonfamily Households |
| 1-Person Households | - | 14 (10.3%) |
| 2-Person Households | 16 (11.8%) | 0 (0.0%) |
| 3-Person Households | 48 (35.3%) | 0 (0.0%) |
| 4-Person Households | 15 (11.0%) | 0 (0.0%) |
| 5-Person Households | 43 (31.6%) | 0 (0.0%) |
| 6-Person Households | 0 (0.0%) | 0 (0.0%) |
| 7+ Person Households | 0 (0.0%) | 0 (0.0%) |
| Total | 122 (89.7%) | 14 (10.3%) |
Female Fertility in Clearview Acres
Fertility by Age in Clearview Acres
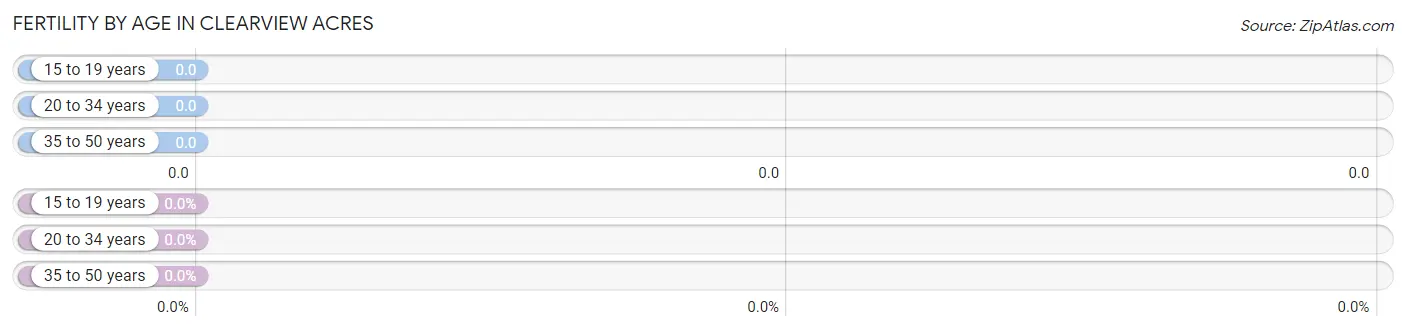
| Age Bracket | Women with Births | Births / 1,000 Women |
| 15 to 19 years | 0 (0.0%) | 0.0 |
| 20 to 34 years | 0 (0.0%) | 0.0 |
| 35 to 50 years | 0 (0.0%) | 0.0 |
| Total | 0 (0.0%) | 0.0 |
Fertility by Age by Marriage Status in Clearview Acres
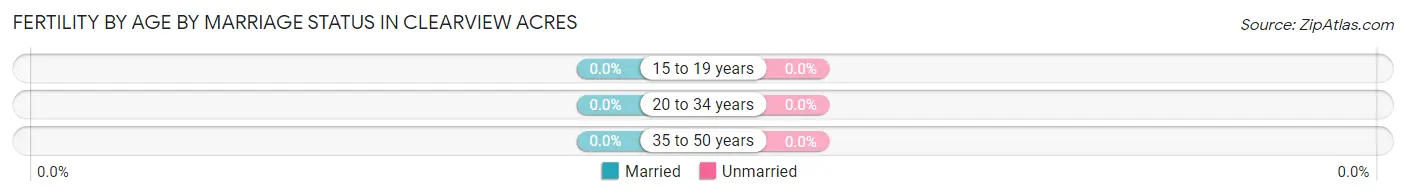
| Age Bracket | Married | Unmarried |
| 15 to 19 years | 0 (0.0%) | 0 (0.0%) |
| 20 to 34 years | 0 (0.0%) | 0 (0.0%) |
| 35 to 50 years | 0 (0.0%) | 0 (0.0%) |
| Total | 0 (0.0%) | 0 (0.0%) |
Fertility by Education in Clearview Acres
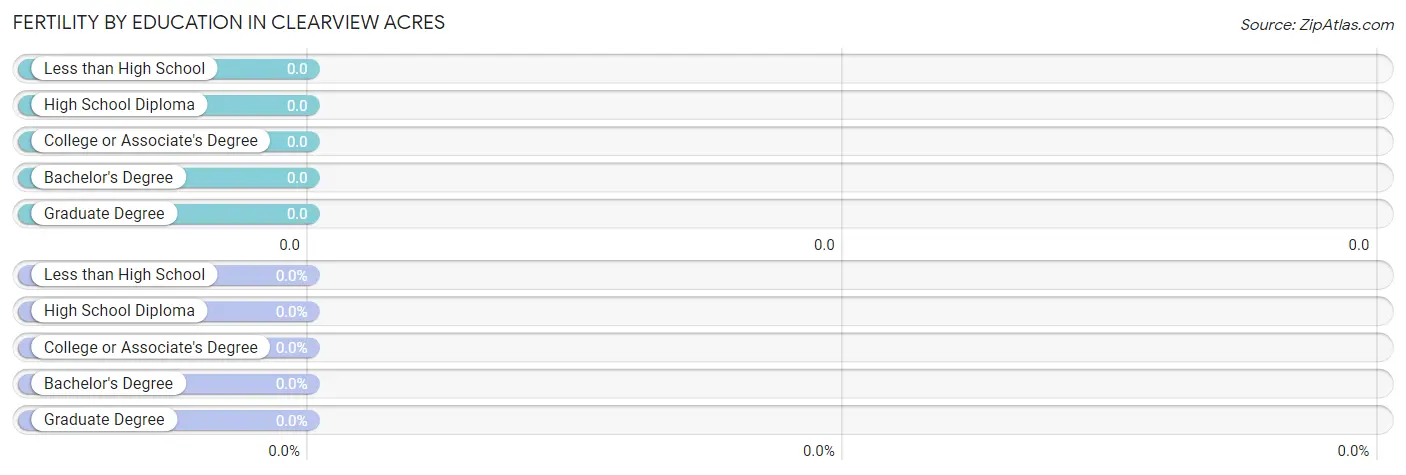
| Educational Attainment | Women with Births | Births / 1,000 Women |
| Less than High School | 0 (0.0%) | 0.0 |
| High School Diploma | 0 (0.0%) | 0.0 |
| College or Associate's Degree | 0 (0.0%) | 0.0 |
| Bachelor's Degree | 0 (0.0%) | 0.0 |
| Graduate Degree | 0 (0.0%) | 0.0 |
| Total | 0 (0.0%) | 0.0 |
Fertility by Education by Marriage Status in Clearview Acres
| Educational Attainment | Married | Unmarried |
| Less than High School | 0 (0.0%) | 0 (0.0%) |
| High School Diploma | 0 (0.0%) | 0 (0.0%) |
| College or Associate's Degree | 0 (0.0%) | 0 (0.0%) |
| Bachelor's Degree | 0 (0.0%) | 0 (0.0%) |
| Graduate Degree | 0 (0.0%) | 0 (0.0%) |
| Total | 0 (0.0%) | 0 (0.0%) |
Employment Characteristics in Clearview Acres
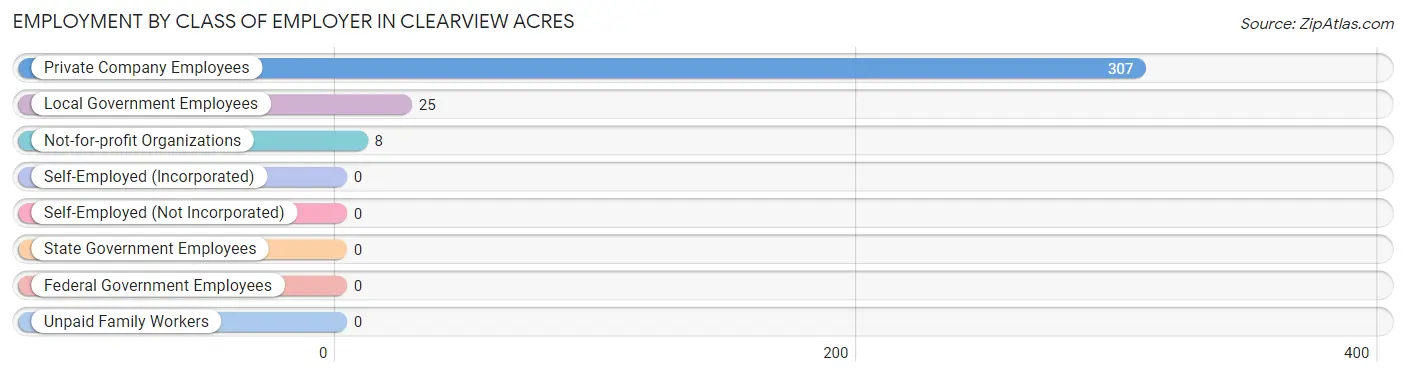
Employment by Class of Employer in Clearview Acres
Among the 340 employed individuals in Clearview Acres, private company employees (307 | 90.3%), local government employees (25 | 7.3%), and not-for-profit organizations (8 | 2.4%) make up the most common classes of employment.
| Employer Class | # Employees | % Employees |
| Private Company Employees | 307 | 90.3% |
| Self-Employed (Incorporated) | 0 | 0.0% |
| Self-Employed (Not Incorporated) | 0 | 0.0% |
| Not-for-profit Organizations | 8 | 2.4% |
| Local Government Employees | 25 | 7.3% |
| State Government Employees | 0 | 0.0% |
| Federal Government Employees | 0 | 0.0% |
| Unpaid Family Workers | 0 | 0.0% |
| Total | 340 | 100.0% |
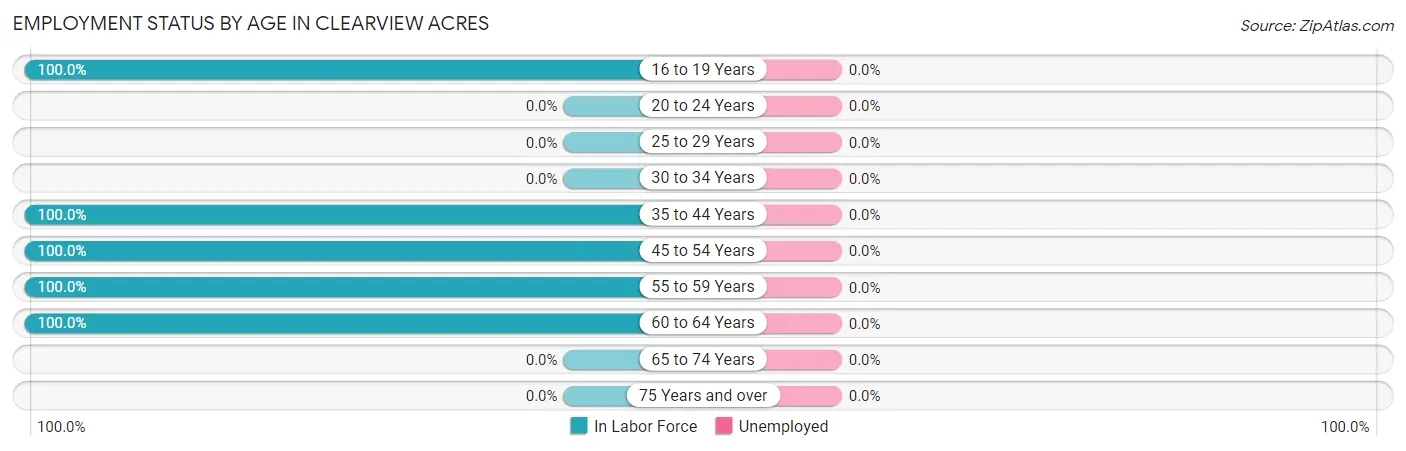
Employment Status by Age in Clearview Acres
| Age Bracket | In Labor Force | Unemployed |
| 16 to 19 Years | 149 (100.0%) | 0 (0.0%) |
| 20 to 24 Years | 0 (0.0%) | 0 (0.0%) |
| 25 to 29 Years | 0 (0.0%) | 0 (0.0%) |
| 30 to 34 Years | 0 (0.0%) | 0 (0.0%) |
| 35 to 44 Years | 31 (100.0%) | 0 (0.0%) |
| 45 to 54 Years | 105 (100.0%) | 0 (0.0%) |
| 55 to 59 Years | 33 (100.0%) | 0 (0.0%) |
| 60 to 64 Years | 22 (100.0%) | 0 (0.0%) |
| 65 to 74 Years | 0 (0.0%) | 0 (0.0%) |
| 75 Years and over | 0 (0.0%) | 0 (0.0%) |
| Total | 340 (89.5%) | 0 (0.0%) |
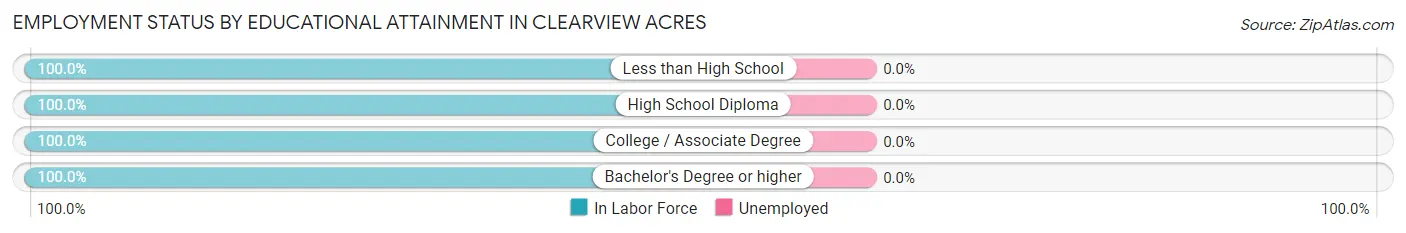
Employment Status by Educational Attainment in Clearview Acres
| Educational Attainment | In Labor Force | Unemployed |
| Less than High School | 17 (100.0%) | 0 (0.0%) |
| High School Diploma | 77 (100.0%) | 0 (0.0%) |
| College / Associate Degree | 89 (100.0%) | 0 (0.0%) |
| Bachelor's Degree or higher | 8 (100.0%) | 0 (0.0%) |
| Total | 191 (100.0%) | 0 (0.0%) |
Employment Occupations by Sex in Clearview Acres
Management, Business, Science and Arts Occupations
The most common Management, Business, Science and Arts occupations in Clearview Acres are Community & Social Service (8 | 2.4%), and Education Instruction & Library (8 | 2.4%).
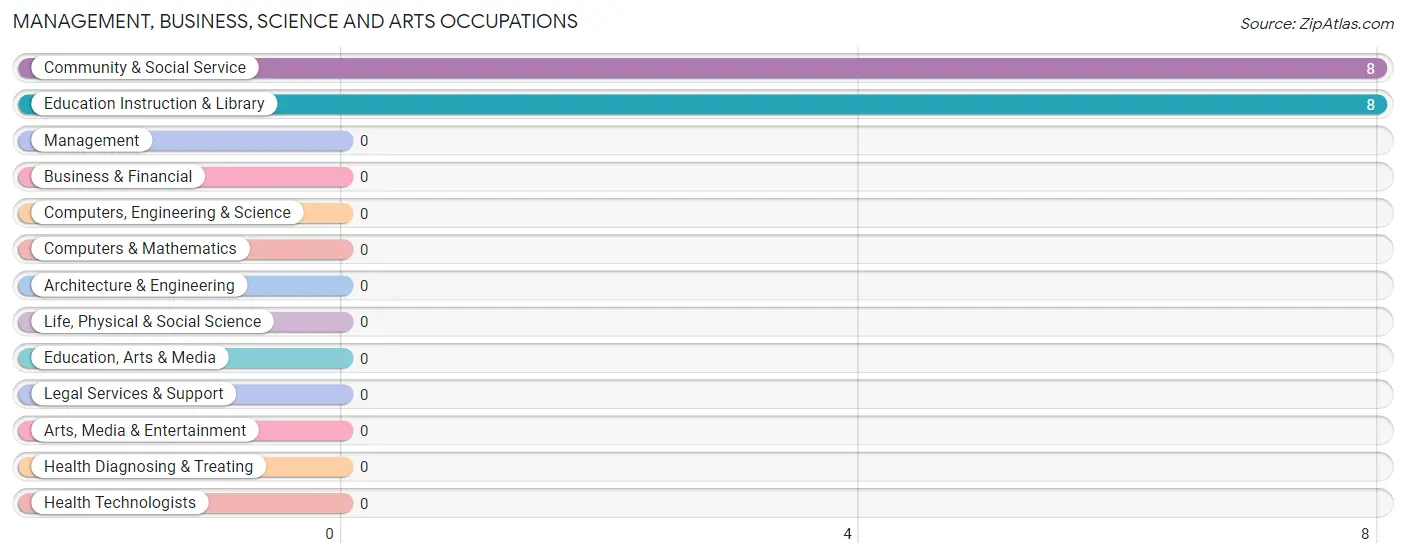
Management, Business, Science and Arts Occupations by Sex
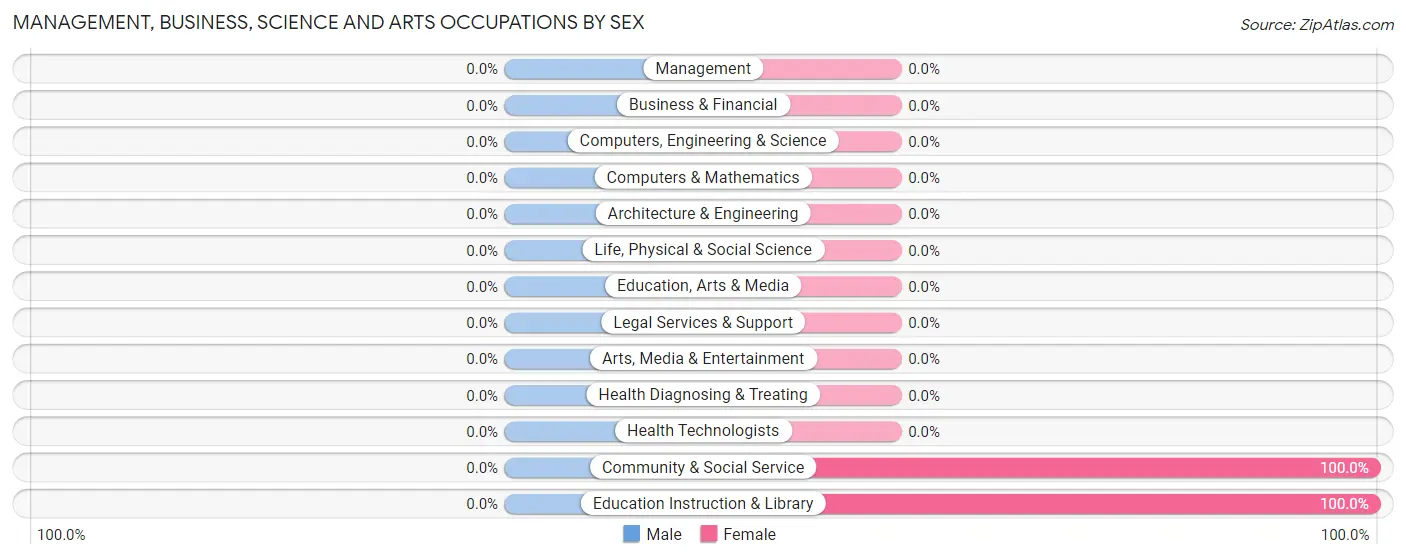
| Occupation | Male | Female |
| Management | 0 (0.0%) | 0 (0.0%) |
| Business & Financial | 0 (0.0%) | 0 (0.0%) |
| Computers, Engineering & Science | 0 (0.0%) | 0 (0.0%) |
| Computers & Mathematics | 0 (0.0%) | 0 (0.0%) |
| Architecture & Engineering | 0 (0.0%) | 0 (0.0%) |
| Life, Physical & Social Science | 0 (0.0%) | 0 (0.0%) |
| Community & Social Service | 0 (0.0%) | 8 (100.0%) |
| Education, Arts & Media | 0 (0.0%) | 0 (0.0%) |
| Legal Services & Support | 0 (0.0%) | 0 (0.0%) |
| Education Instruction & Library | 0 (0.0%) | 8 (100.0%) |
| Arts, Media & Entertainment | 0 (0.0%) | 0 (0.0%) |
| Health Diagnosing & Treating | 0 (0.0%) | 0 (0.0%) |
| Health Technologists | 0 (0.0%) | 0 (0.0%) |
| Total (Category) | 0 (0.0%) | 8 (100.0%) |
| Total (Overall) | 251 (73.8%) | 89 (26.2%) |
Services Occupations
The most common Services occupations in Clearview Acres are Food Preparation & Serving (57 | 16.8%), and Cleaning & Maintenance (17 | 5.0%).
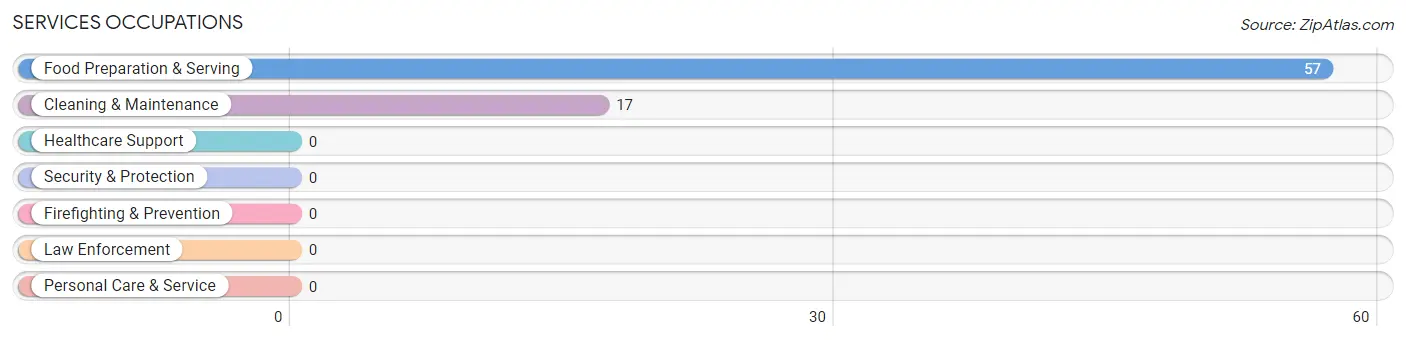
Services Occupations by Sex
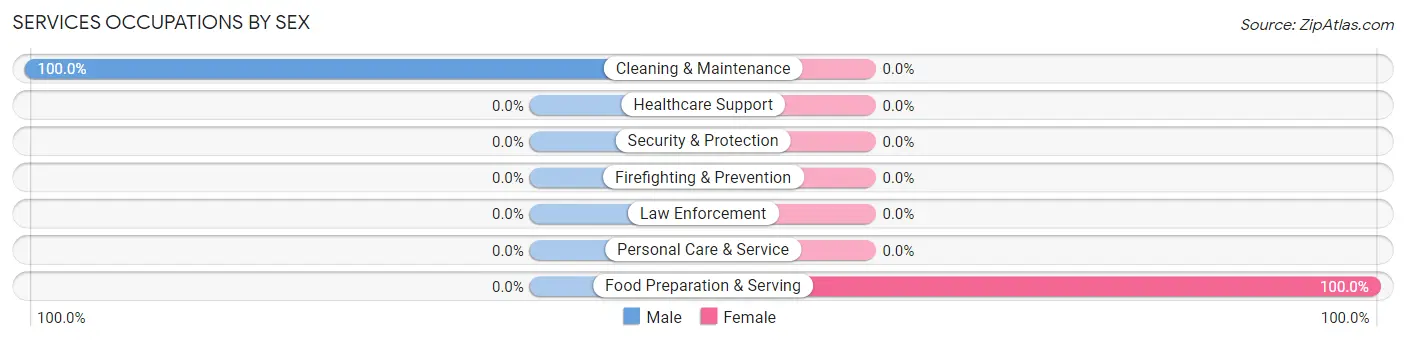
| Occupation | Male | Female |
| Healthcare Support | 0 (0.0%) | 0 (0.0%) |
| Security & Protection | 0 (0.0%) | 0 (0.0%) |
| Firefighting & Prevention | 0 (0.0%) | 0 (0.0%) |
| Law Enforcement | 0 (0.0%) | 0 (0.0%) |
| Food Preparation & Serving | 0 (0.0%) | 57 (100.0%) |
| Cleaning & Maintenance | 17 (100.0%) | 0 (0.0%) |
| Personal Care & Service | 0 (0.0%) | 0 (0.0%) |
| Total (Category) | 17 (23.0%) | 57 (77.0%) |
| Total (Overall) | 251 (73.8%) | 89 (26.2%) |
Sales and Office Occupations
The most common Sales and Office occupations in Clearview Acres are Office & Administration (100 | 29.4%), and Sales & Related (16 | 4.7%).
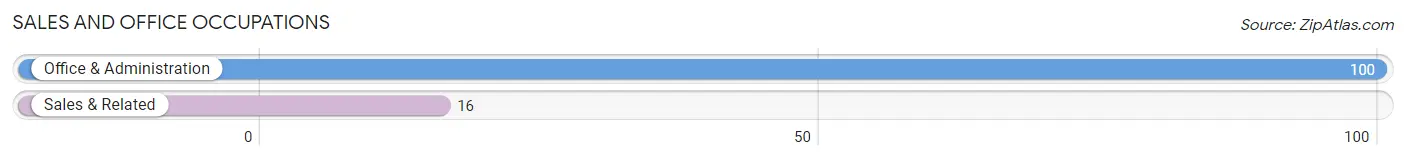
Sales and Office Occupations by Sex
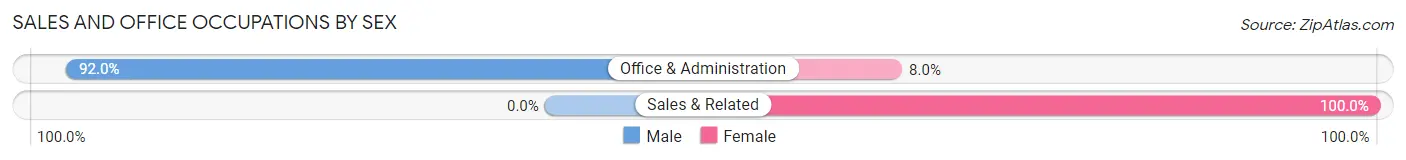
| Occupation | Male | Female |
| Sales & Related | 0 (0.0%) | 16 (100.0%) |
| Office & Administration | 92 (92.0%) | 8 (8.0%) |
| Total (Category) | 92 (79.3%) | 24 (20.7%) |
| Total (Overall) | 251 (73.8%) | 89 (26.2%) |
Natural Resources, Construction and Maintenance Occupations
The most common Natural Resources, Construction and Maintenance occupations in Clearview Acres are Construction & Extraction (105 | 30.9%), and Installation, Maintenance & Repair (22 | 6.5%).
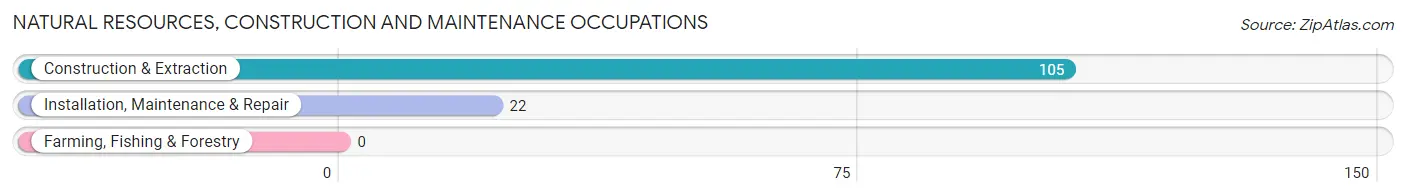
Natural Resources, Construction and Maintenance Occupations by Sex
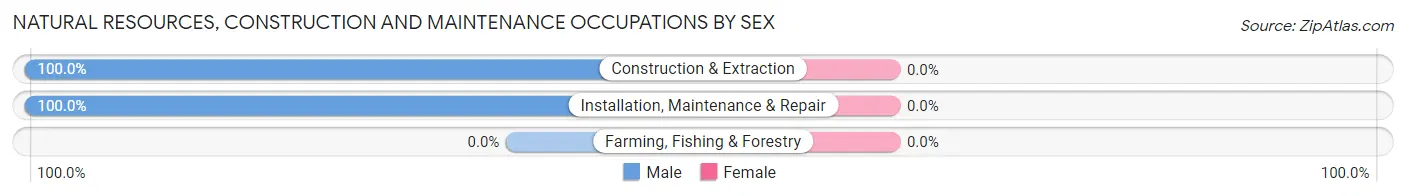
| Occupation | Male | Female |
| Farming, Fishing & Forestry | 0 (0.0%) | 0 (0.0%) |
| Construction & Extraction | 105 (100.0%) | 0 (0.0%) |
| Installation, Maintenance & Repair | 22 (100.0%) | 0 (0.0%) |
| Total (Category) | 127 (100.0%) | 0 (0.0%) |
| Total (Overall) | 251 (73.8%) | 89 (26.2%) |
Production, Transportation and Moving Occupations
The most common Production, Transportation and Moving occupations in Clearview Acres are , and Material Moving (15 | 4.4%).
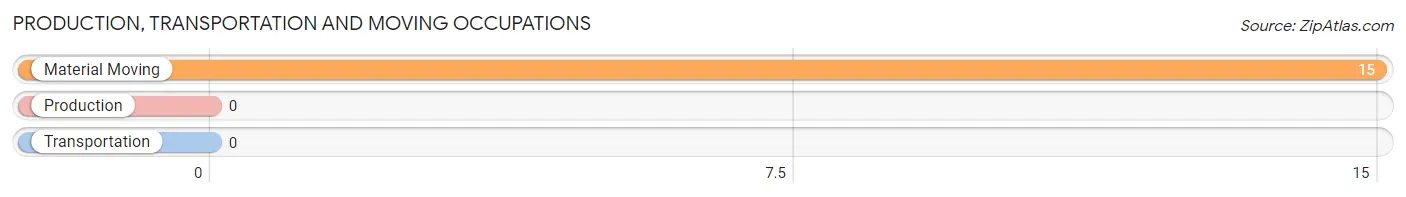
Production, Transportation and Moving Occupations by Sex
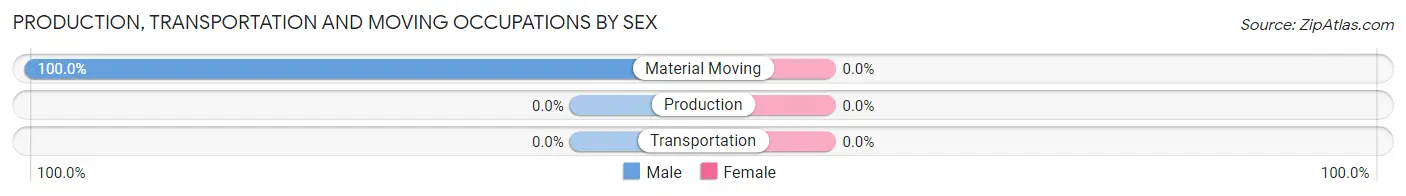
| Occupation | Male | Female |
| Production | 0 (0.0%) | 0 (0.0%) |
| Transportation | 0 (0.0%) | 0 (0.0%) |
| Material Moving | 15 (100.0%) | 0 (0.0%) |
| Total (Category) | 15 (100.0%) | 0 (0.0%) |
| Total (Overall) | 251 (73.8%) | 89 (26.2%) |
Employment Industries by Sex in Clearview Acres
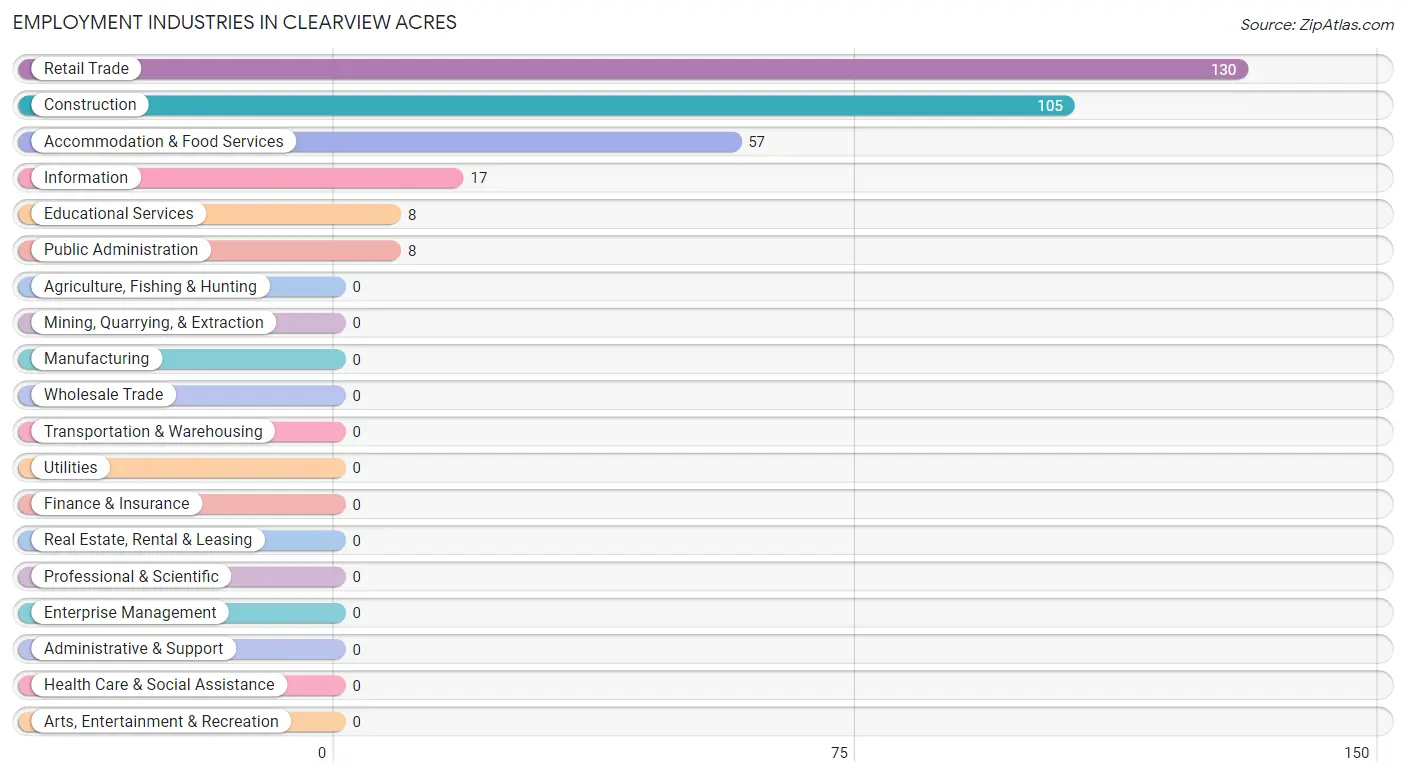
Employment Industries in Clearview Acres
The major employment industries in Clearview Acres include Retail Trade (130 | 38.2%), Construction (105 | 30.9%), Accommodation & Food Services (57 | 16.8%), Information (17 | 5.0%), and Educational Services (8 | 2.4%).
Employment Industries by Sex in Clearview Acres
The Clearview Acres industries that see more men than women are Construction (100.0%), Information (100.0%), and Retail Trade (87.7%), whereas the industries that tend to have a higher number of women are Educational Services (100.0%), Accommodation & Food Services (100.0%), and Public Administration (100.0%).
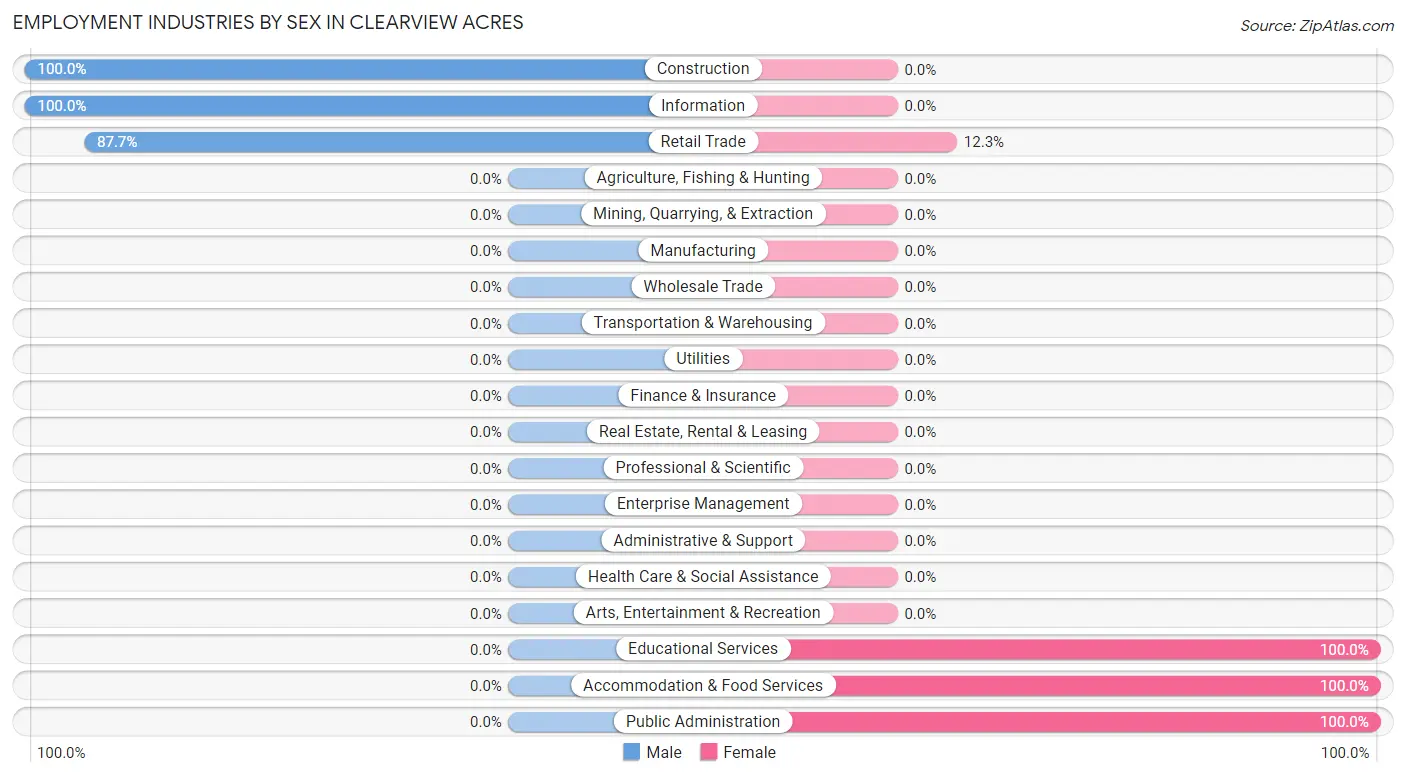
| Industry | Male | Female |
| Agriculture, Fishing & Hunting | 0 (0.0%) | 0 (0.0%) |
| Mining, Quarrying, & Extraction | 0 (0.0%) | 0 (0.0%) |
| Construction | 105 (100.0%) | 0 (0.0%) |
| Manufacturing | 0 (0.0%) | 0 (0.0%) |
| Wholesale Trade | 0 (0.0%) | 0 (0.0%) |
| Retail Trade | 114 (87.7%) | 16 (12.3%) |
| Transportation & Warehousing | 0 (0.0%) | 0 (0.0%) |
| Utilities | 0 (0.0%) | 0 (0.0%) |
| Information | 17 (100.0%) | 0 (0.0%) |
| Finance & Insurance | 0 (0.0%) | 0 (0.0%) |
| Real Estate, Rental & Leasing | 0 (0.0%) | 0 (0.0%) |
| Professional & Scientific | 0 (0.0%) | 0 (0.0%) |
| Enterprise Management | 0 (0.0%) | 0 (0.0%) |
| Administrative & Support | 0 (0.0%) | 0 (0.0%) |
| Educational Services | 0 (0.0%) | 8 (100.0%) |
| Health Care & Social Assistance | 0 (0.0%) | 0 (0.0%) |
| Arts, Entertainment & Recreation | 0 (0.0%) | 0 (0.0%) |
| Accommodation & Food Services | 0 (0.0%) | 57 (100.0%) |
| Public Administration | 0 (0.0%) | 8 (100.0%) |
| Total | 251 (73.8%) | 89 (26.2%) |
Education in Clearview Acres
School Enrollment in Clearview Acres
The most common levels of schooling among the 180 students in Clearview Acres are high school (96 | 53.3%), elementary school (46 | 25.6%), and middle school (27 | 15.0%).
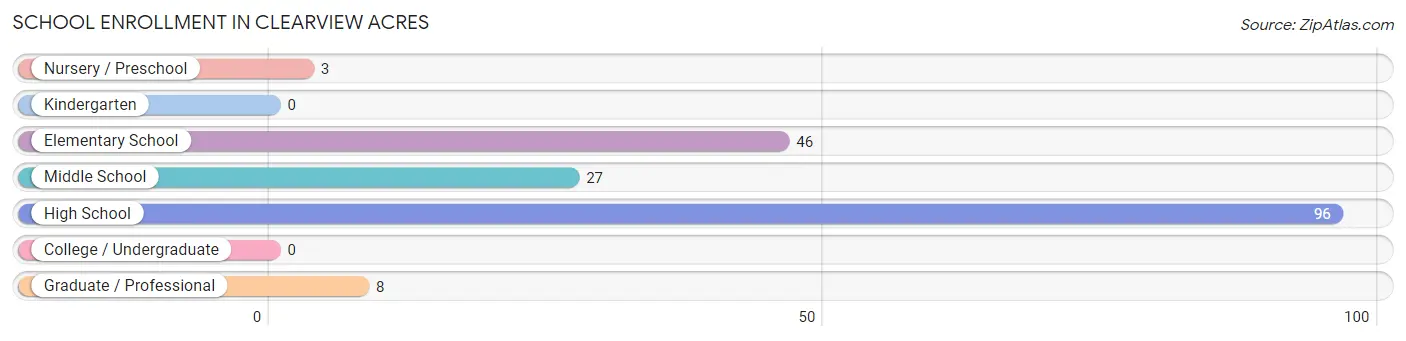
| School Level | # Students | % Students |
| Nursery / Preschool | 3 | 1.7% |
| Kindergarten | 0 | 0.0% |
| Elementary School | 46 | 25.6% |
| Middle School | 27 | 15.0% |
| High School | 96 | 53.3% |
| College / Undergraduate | 0 | 0.0% |
| Graduate / Professional | 8 | 4.4% |
| Total | 180 | 100.0% |
School Enrollment by Age by Funding Source in Clearview Acres
Out of a total of 180 students who are enrolled in schools in Clearview Acres, 3 (1.7%) attend a private institution, while the remaining 177 (98.3%) are enrolled in public schools. The age group of 3 to 4 year olds has the highest likelihood of being enrolled in private schools, with 3 (100.0% in the age bracket) enrolled. Conversely, the age group of 5 to 9 year old has the lowest likelihood of being enrolled in a private school, with 7 (100.0% in the age bracket) attending a public institution.
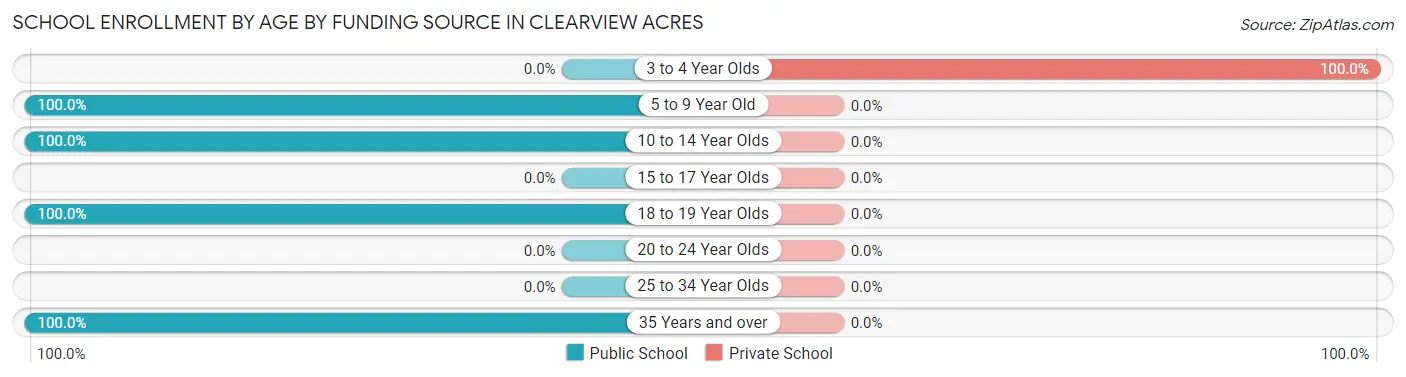
| Age Bracket | Public School | Private School |
| 3 to 4 Year Olds | 0 (0.0%) | 3 (100.0%) |
| 5 to 9 Year Old | 7 (100.0%) | 0 (0.0%) |
| 10 to 14 Year Olds | 105 (100.0%) | 0 (0.0%) |
| 15 to 17 Year Olds | 0 (0.0%) | 0 (0.0%) |
| 18 to 19 Year Olds | 57 (100.0%) | 0 (0.0%) |
| 20 to 24 Year Olds | 0 (0.0%) | 0 (0.0%) |
| 25 to 34 Year Olds | 0 (0.0%) | 0 (0.0%) |
| 35 Years and over | 8 (100.0%) | 0 (0.0%) |
| Total | 177 (98.3%) | 3 (1.7%) |
Educational Attainment by Field of Study in Clearview Acres
Business (14 | 63.6%), and education (8 | 36.4%) are the most common fields of study among 22 individuals in Clearview Acres who have obtained a bachelor's degree or higher.
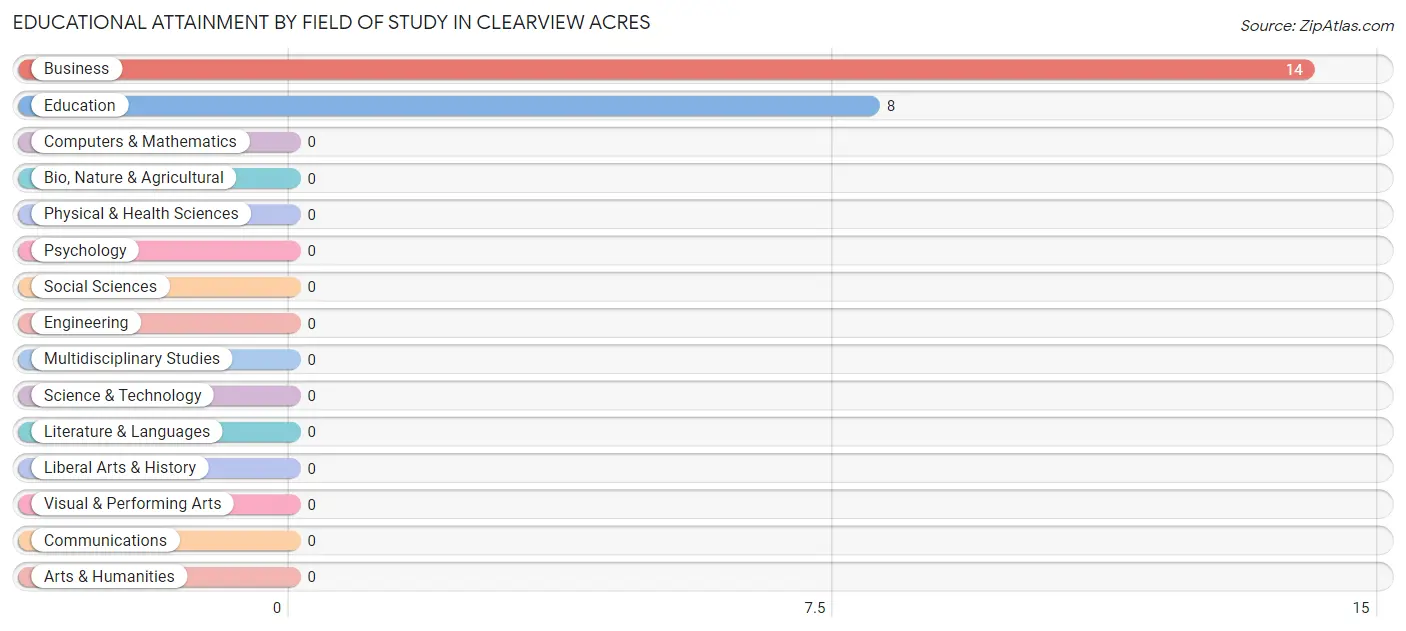
| Field of Study | # Graduates | % Graduates |
| Computers & Mathematics | 0 | 0.0% |
| Bio, Nature & Agricultural | 0 | 0.0% |
| Physical & Health Sciences | 0 | 0.0% |
| Psychology | 0 | 0.0% |
| Social Sciences | 0 | 0.0% |
| Engineering | 0 | 0.0% |
| Multidisciplinary Studies | 0 | 0.0% |
| Science & Technology | 0 | 0.0% |
| Business | 14 | 63.6% |
| Education | 8 | 36.4% |
| Literature & Languages | 0 | 0.0% |
| Liberal Arts & History | 0 | 0.0% |
| Visual & Performing Arts | 0 | 0.0% |
| Communications | 0 | 0.0% |
| Arts & Humanities | 0 | 0.0% |
| Total | 22 | 100.0% |
Transportation & Commute in Clearview Acres
Vehicle Availability by Sex in Clearview Acres
The most prevalent vehicle ownership categories in Clearview Acres are males with 5 or more vehicles (197, accounting for 78.5%) and females with 5 or more vehicles (57, making up 221.3%).
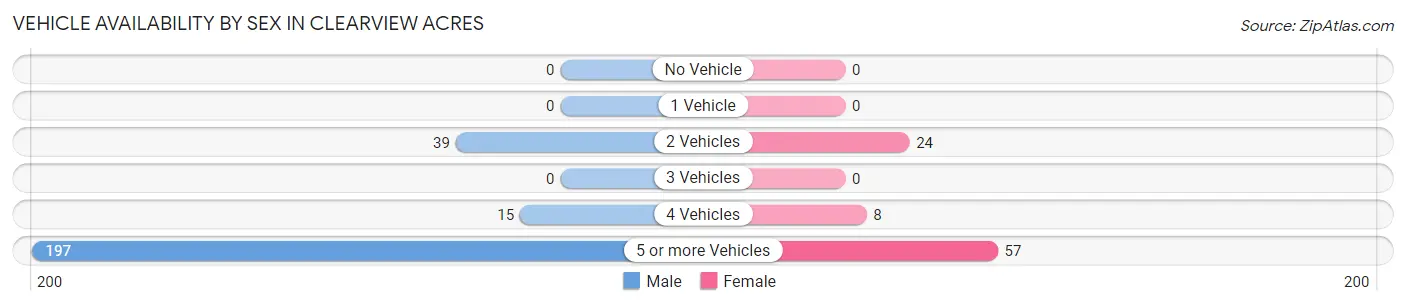
| Vehicles Available | Male | Female |
| No Vehicle | 0 (0.0%) | 0 (0.0%) |
| 1 Vehicle | 0 (0.0%) | 0 (0.0%) |
| 2 Vehicles | 39 (15.5%) | 24 (27.0%) |
| 3 Vehicles | 0 (0.0%) | 0 (0.0%) |
| 4 Vehicles | 15 (6.0%) | 8 (9.0%) |
| 5 or more Vehicles | 197 (78.5%) | 57 (64.0%) |
| Total | 251 (100.0%) | 89 (100.0%) |
Commute Time in Clearview Acres
The most frequently occuring commute durations in Clearview Acres are 10 to 14 minutes (197 commuters, 57.9%), 35 to 39 minutes (57 commuters, 16.8%), and 5 to 9 minutes (30 commuters, 8.8%).
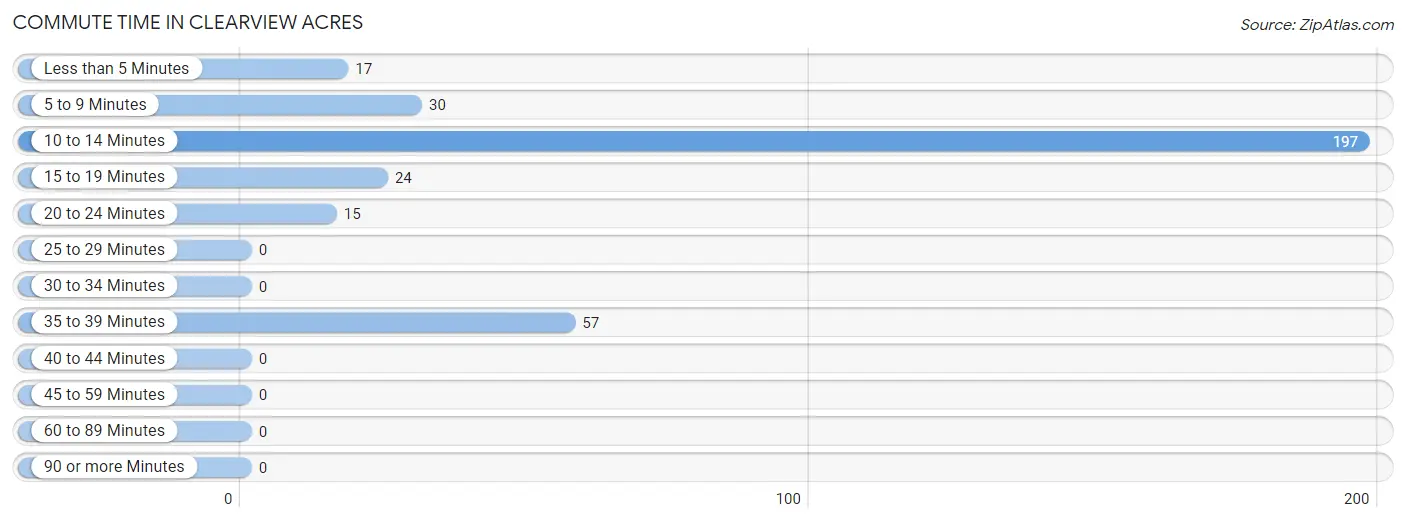
| Commute Time | # Commuters | % Commuters |
| Less than 5 Minutes | 17 | 5.0% |
| 5 to 9 Minutes | 30 | 8.8% |
| 10 to 14 Minutes | 197 | 57.9% |
| 15 to 19 Minutes | 24 | 7.1% |
| 20 to 24 Minutes | 15 | 4.4% |
| 25 to 29 Minutes | 0 | 0.0% |
| 30 to 34 Minutes | 0 | 0.0% |
| 35 to 39 Minutes | 57 | 16.8% |
| 40 to 44 Minutes | 0 | 0.0% |
| 45 to 59 Minutes | 0 | 0.0% |
| 60 to 89 Minutes | 0 | 0.0% |
| 90 or more Minutes | 0 | 0.0% |
Commute Time by Sex in Clearview Acres
The most common commute times in Clearview Acres are 10 to 14 minutes (197 commuters, 78.5%) for males and 35 to 39 minutes (57 commuters, 64.0%) for females.
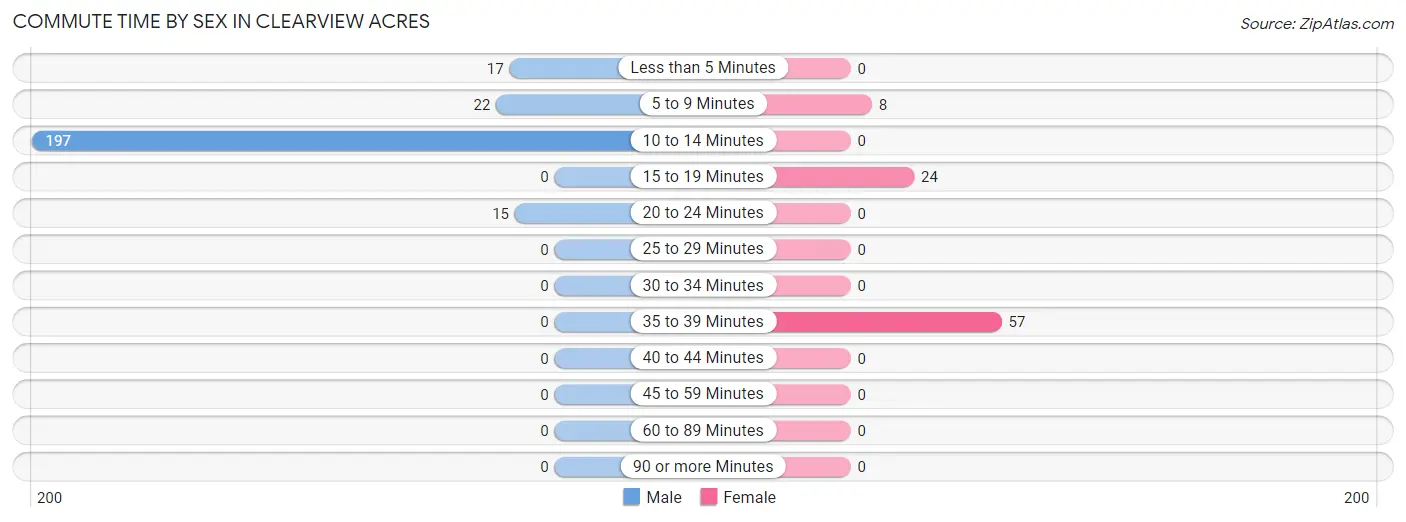
| Commute Time | Male | Female |
| Less than 5 Minutes | 17 (6.8%) | 0 (0.0%) |
| 5 to 9 Minutes | 22 (8.8%) | 8 (9.0%) |
| 10 to 14 Minutes | 197 (78.5%) | 0 (0.0%) |
| 15 to 19 Minutes | 0 (0.0%) | 24 (27.0%) |
| 20 to 24 Minutes | 15 (6.0%) | 0 (0.0%) |
| 25 to 29 Minutes | 0 (0.0%) | 0 (0.0%) |
| 30 to 34 Minutes | 0 (0.0%) | 0 (0.0%) |
| 35 to 39 Minutes | 0 (0.0%) | 57 (64.0%) |
| 40 to 44 Minutes | 0 (0.0%) | 0 (0.0%) |
| 45 to 59 Minutes | 0 (0.0%) | 0 (0.0%) |
| 60 to 89 Minutes | 0 (0.0%) | 0 (0.0%) |
| 90 or more Minutes | 0 (0.0%) | 0 (0.0%) |
Time of Departure to Work by Sex in Clearview Acres
The most frequent times of departure to work in Clearview Acres are 4:00 PM to 11:59 PM (92, 36.6%) for males and 12:00 PM to 3:59 PM (57, 64.0%) for females.
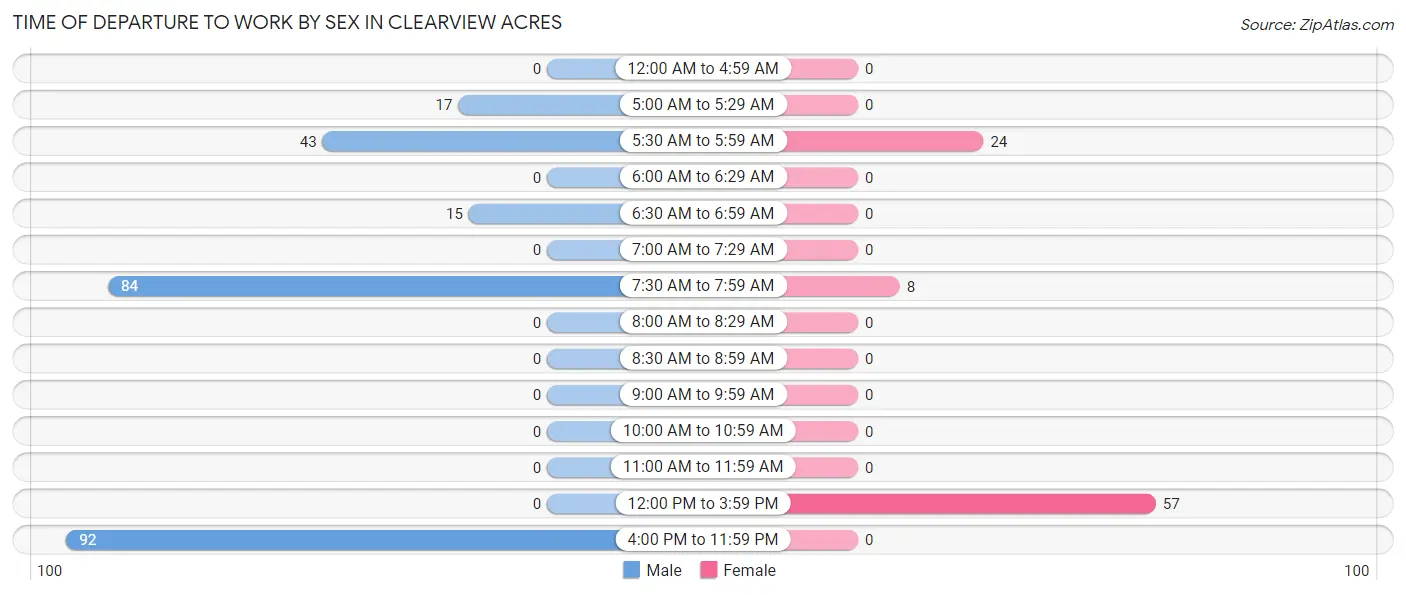
| Time of Departure | Male | Female |
| 12:00 AM to 4:59 AM | 0 (0.0%) | 0 (0.0%) |
| 5:00 AM to 5:29 AM | 17 (6.8%) | 0 (0.0%) |
| 5:30 AM to 5:59 AM | 43 (17.1%) | 24 (27.0%) |
| 6:00 AM to 6:29 AM | 0 (0.0%) | 0 (0.0%) |
| 6:30 AM to 6:59 AM | 15 (6.0%) | 0 (0.0%) |
| 7:00 AM to 7:29 AM | 0 (0.0%) | 0 (0.0%) |
| 7:30 AM to 7:59 AM | 84 (33.5%) | 8 (9.0%) |
| 8:00 AM to 8:29 AM | 0 (0.0%) | 0 (0.0%) |
| 8:30 AM to 8:59 AM | 0 (0.0%) | 0 (0.0%) |
| 9:00 AM to 9:59 AM | 0 (0.0%) | 0 (0.0%) |
| 10:00 AM to 10:59 AM | 0 (0.0%) | 0 (0.0%) |
| 11:00 AM to 11:59 AM | 0 (0.0%) | 0 (0.0%) |
| 12:00 PM to 3:59 PM | 0 (0.0%) | 57 (64.0%) |
| 4:00 PM to 11:59 PM | 92 (36.6%) | 0 (0.0%) |
| Total | 251 (100.0%) | 89 (100.0%) |
Housing Occupancy in Clearview Acres
Occupancy by Ownership in Clearview Acres
Of the total 136 dwellings in Clearview Acres, owner-occupied units account for 136 (100.0%), while renter-occupied units make up 0 (0.0%).
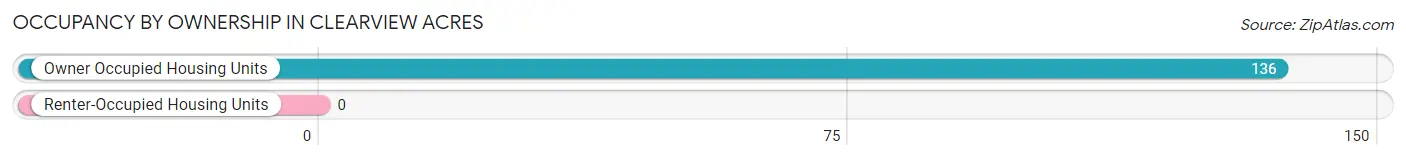
| Occupancy | # Housing Units | % Housing Units |
| Owner Occupied Housing Units | 136 | 100.0% |
| Renter-Occupied Housing Units | 0 | 0.0% |
| Total Occupied Housing Units | 136 | 100.0% |
Occupancy by Household Size in Clearview Acres
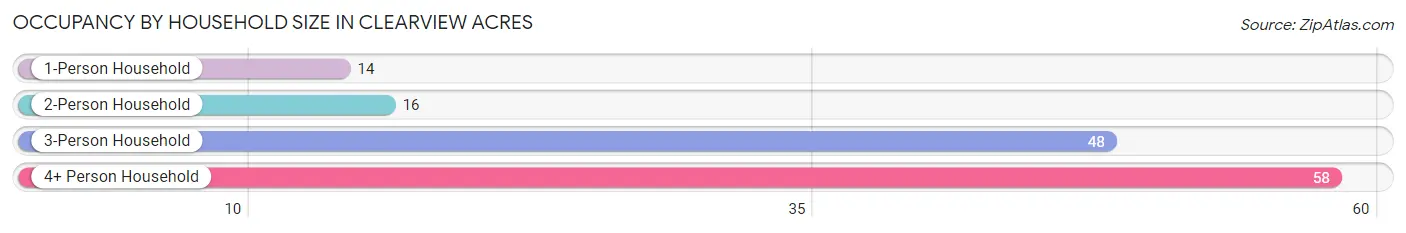
| Household Size | # Housing Units | % Housing Units |
| 1-Person Household | 14 | 10.3% |
| 2-Person Household | 16 | 11.8% |
| 3-Person Household | 48 | 35.3% |
| 4+ Person Household | 58 | 42.6% |
| Total Housing Units | 136 | 100.0% |
Occupancy by Ownership by Household Size in Clearview Acres
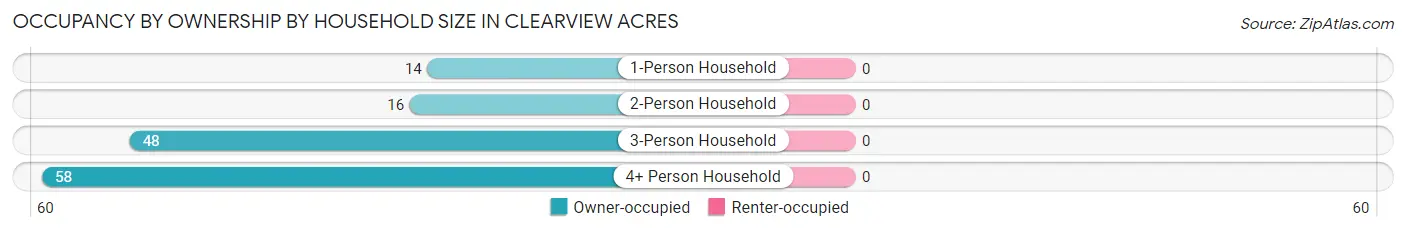
| Household Size | Owner-occupied | Renter-occupied |
| 1-Person Household | 14 (100.0%) | 0 (0.0%) |
| 2-Person Household | 16 (100.0%) | 0 (0.0%) |
| 3-Person Household | 48 (100.0%) | 0 (0.0%) |
| 4+ Person Household | 58 (100.0%) | 0 (0.0%) |
| Total Housing Units | 136 (100.0%) | 0 (0.0%) |
Occupancy by Educational Attainment in Clearview Acres
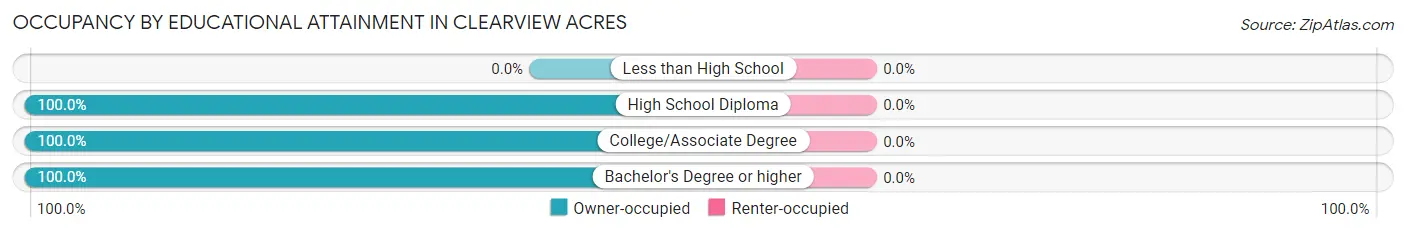
| Household Size | Owner-occupied | Renter-occupied |
| Less than High School | 0 (0.0%) | 0 (0.0%) |
| High School Diploma | 15 (100.0%) | 0 (0.0%) |
| College/Associate Degree | 107 (100.0%) | 0 (0.0%) |
| Bachelor's Degree or higher | 14 (100.0%) | 0 (0.0%) |
Occupancy by Age of Householder in Clearview Acres
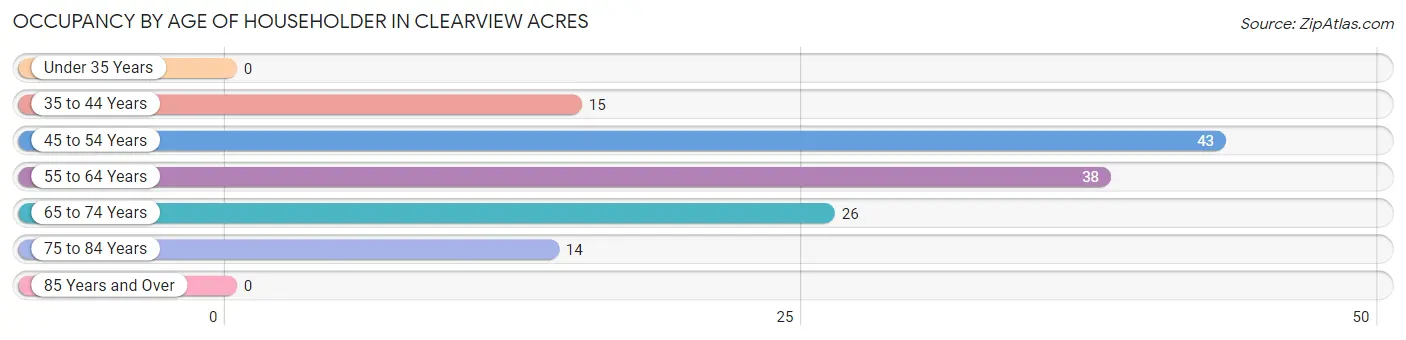
| Age Bracket | # Households | % Households |
| Under 35 Years | 0 | 0.0% |
| 35 to 44 Years | 15 | 11.0% |
| 45 to 54 Years | 43 | 31.6% |
| 55 to 64 Years | 38 | 27.9% |
| 65 to 74 Years | 26 | 19.1% |
| 75 to 84 Years | 14 | 10.3% |
| 85 Years and Over | 0 | 0.0% |
| Total | 136 | 100.0% |
Housing Finances in Clearview Acres
Median Income by Occupancy in Clearview Acres
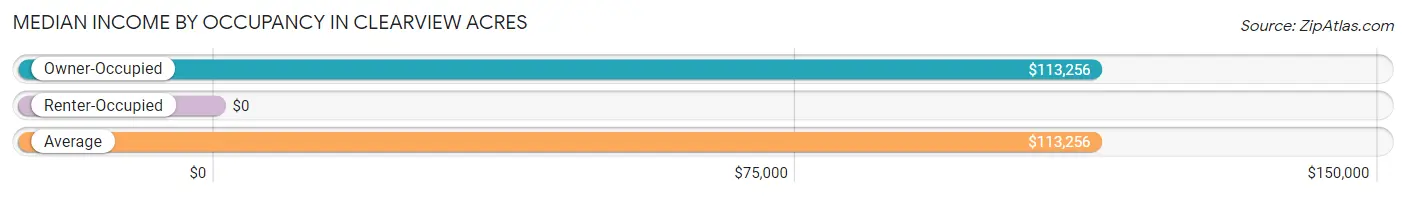
| Occupancy Type | # Households | Median Income |
| Owner-Occupied | 136 (100.0%) | $113,256 |
| Renter-Occupied | 0 (0.0%) | $0 |
| Average | 136 (100.0%) | $113,256 |
Occupancy by Householder Income Bracket in Clearview Acres
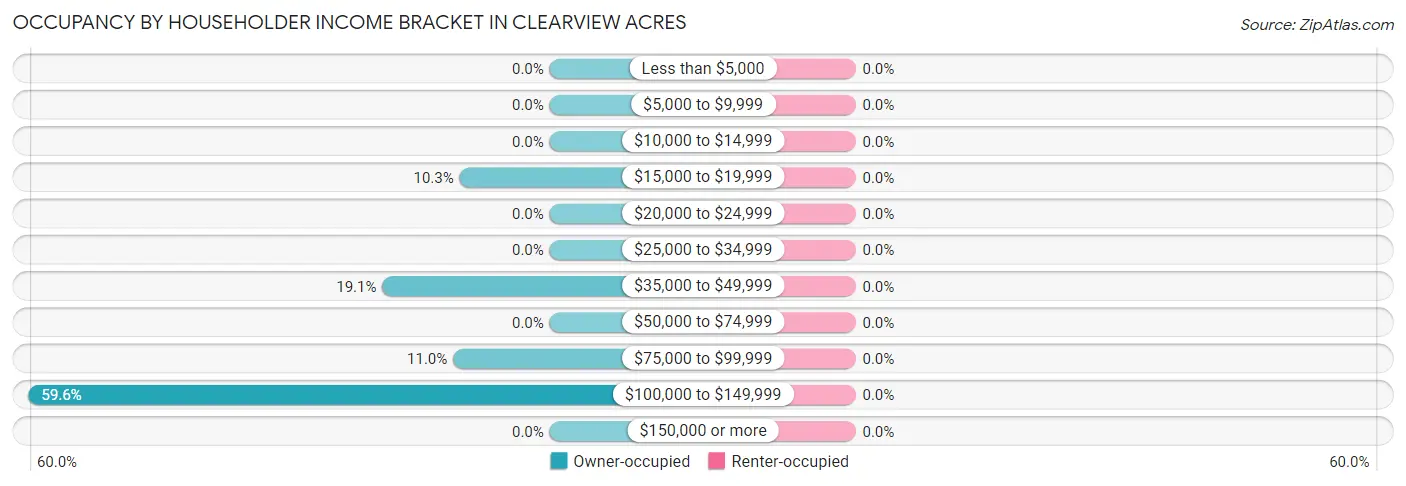
| Income Bracket | Owner-occupied | Renter-occupied |
| Less than $5,000 | 0 (0.0%) | 0 (0.0%) |
| $5,000 to $9,999 | 0 (0.0%) | 0 (0.0%) |
| $10,000 to $14,999 | 0 (0.0%) | 0 (0.0%) |
| $15,000 to $19,999 | 14 (10.3%) | 0 (0.0%) |
| $20,000 to $24,999 | 0 (0.0%) | 0 (0.0%) |
| $25,000 to $34,999 | 0 (0.0%) | 0 (0.0%) |
| $35,000 to $49,999 | 26 (19.1%) | 0 (0.0%) |
| $50,000 to $74,999 | 0 (0.0%) | 0 (0.0%) |
| $75,000 to $99,999 | 15 (11.0%) | 0 (0.0%) |
| $100,000 to $149,999 | 81 (59.6%) | 0 (0.0%) |
| $150,000 or more | 0 (0.0%) | 0 (0.0%) |
| Total | 136 (100.0%) | 0 (0.0%) |
Monthly Housing Cost Tiers in Clearview Acres
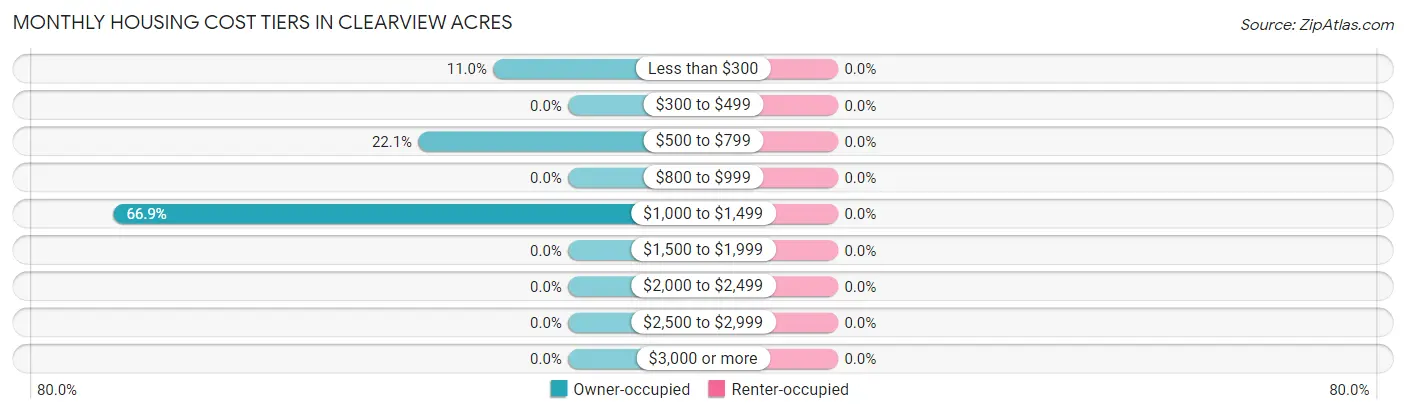
| Monthly Cost | Owner-occupied | Renter-occupied |
| Less than $300 | 15 (11.0%) | 0 (0.0%) |
| $300 to $499 | 0 (0.0%) | 0 (0.0%) |
| $500 to $799 | 30 (22.1%) | 0 (0.0%) |
| $800 to $999 | 0 (0.0%) | 0 (0.0%) |
| $1,000 to $1,499 | 91 (66.9%) | 0 (0.0%) |
| $1,500 to $1,999 | 0 (0.0%) | 0 (0.0%) |
| $2,000 to $2,499 | 0 (0.0%) | 0 (0.0%) |
| $2,500 to $2,999 | 0 (0.0%) | 0 (0.0%) |
| $3,000 or more | 0 (0.0%) | 0 (0.0%) |
| Total | 136 (100.0%) | 0 (0.0%) |
Physical Housing Characteristics in Clearview Acres
Housing Structures in Clearview Acres
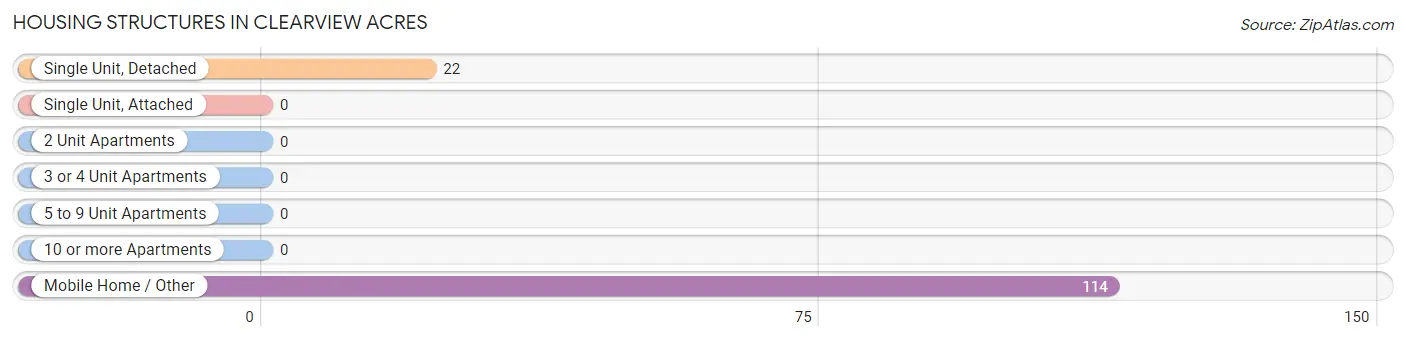
| Structure Type | # Housing Units | % Housing Units |
| Single Unit, Detached | 22 | 16.2% |
| Single Unit, Attached | 0 | 0.0% |
| 2 Unit Apartments | 0 | 0.0% |
| 3 or 4 Unit Apartments | 0 | 0.0% |
| 5 to 9 Unit Apartments | 0 | 0.0% |
| 10 or more Apartments | 0 | 0.0% |
| Mobile Home / Other | 114 | 83.8% |
| Total | 136 | 100.0% |
Housing Structures by Occupancy in Clearview Acres

| Structure Type | Owner-occupied | Renter-occupied |
| Single Unit, Detached | 22 (100.0%) | 0 (0.0%) |
| Single Unit, Attached | 0 (0.0%) | 0 (0.0%) |
| 2 Unit Apartments | 0 (0.0%) | 0 (0.0%) |
| 3 or 4 Unit Apartments | 0 (0.0%) | 0 (0.0%) |
| 5 to 9 Unit Apartments | 0 (0.0%) | 0 (0.0%) |
| 10 or more Apartments | 0 (0.0%) | 0 (0.0%) |
| Mobile Home / Other | 114 (100.0%) | 0 (0.0%) |
| Total | 136 (100.0%) | 0 (0.0%) |
Housing Structures by Number of Rooms in Clearview Acres
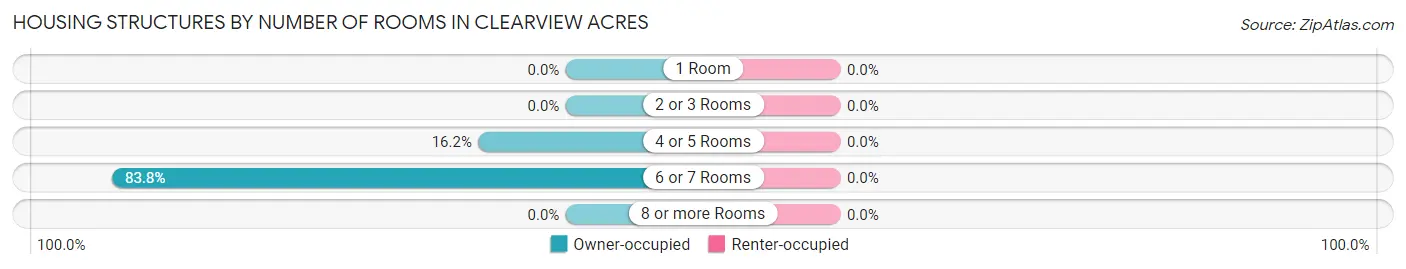
| Number of Rooms | Owner-occupied | Renter-occupied |
| 1 Room | 0 (0.0%) | 0 (0.0%) |
| 2 or 3 Rooms | 0 (0.0%) | 0 (0.0%) |
| 4 or 5 Rooms | 22 (16.2%) | 0 (0.0%) |
| 6 or 7 Rooms | 114 (83.8%) | 0 (0.0%) |
| 8 or more Rooms | 0 (0.0%) | 0 (0.0%) |
| Total | 136 (100.0%) | 0 (0.0%) |
Housing Structure by Heating Type in Clearview Acres
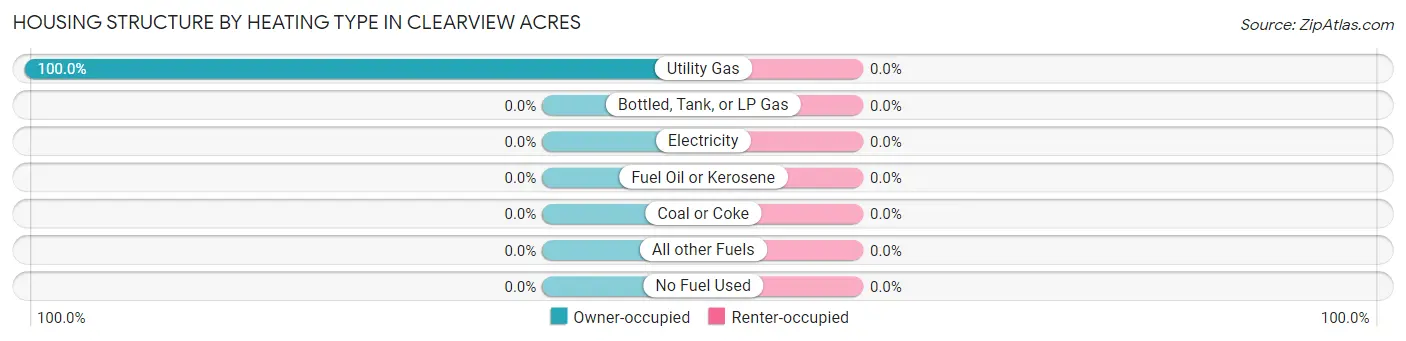
| Heating Type | Owner-occupied | Renter-occupied |
| Utility Gas | 136 (100.0%) | 0 (0.0%) |
| Bottled, Tank, or LP Gas | 0 (0.0%) | 0 (0.0%) |
| Electricity | 0 (0.0%) | 0 (0.0%) |
| Fuel Oil or Kerosene | 0 (0.0%) | 0 (0.0%) |
| Coal or Coke | 0 (0.0%) | 0 (0.0%) |
| All other Fuels | 0 (0.0%) | 0 (0.0%) |
| No Fuel Used | 0 (0.0%) | 0 (0.0%) |
| Total | 136 (100.0%) | 0 (0.0%) |
Household Vehicle Usage in Clearview Acres
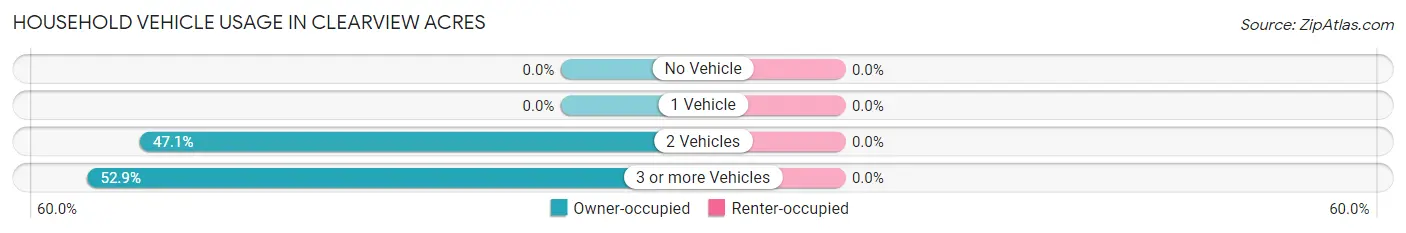
| Vehicles per Household | Owner-occupied | Renter-occupied |
| No Vehicle | 0 (0.0%) | 0 (0.0%) |
| 1 Vehicle | 0 (0.0%) | 0 (0.0%) |
| 2 Vehicles | 64 (47.1%) | 0 (0.0%) |
| 3 or more Vehicles | 72 (52.9%) | 0 (0.0%) |
| Total | 136 (100.0%) | 0 (0.0%) |
Real Estate & Mortgages in Clearview Acres
Real Estate and Mortgage Overview in Clearview Acres
| Characteristic | Without Mortgage | With Mortgage |
| Housing Units | 29 | 107 |
| Median Property Value | - | - |
| Median Household Income | - | - |
| Monthly Housing Costs | - | - |
| Real Estate Taxes | - | - |
Property Value by Mortgage Status in Clearview Acres
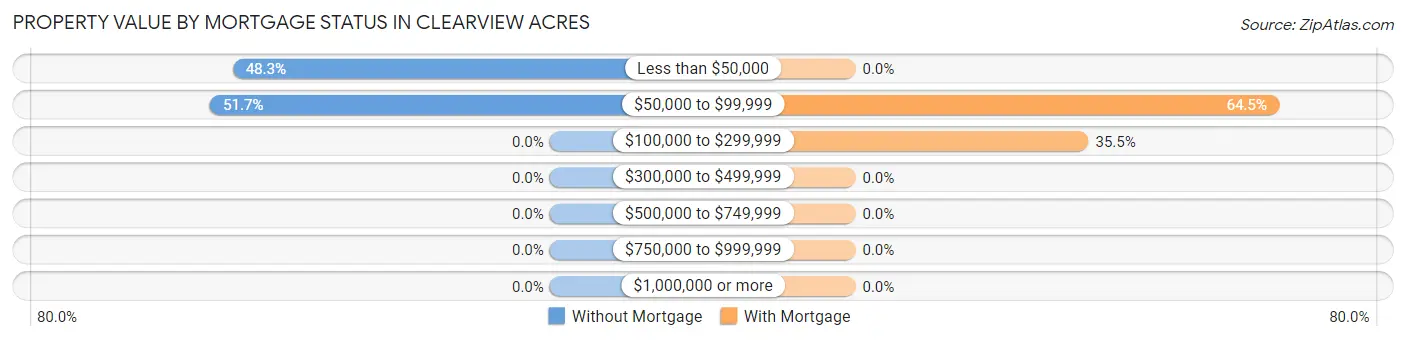
| Property Value | Without Mortgage | With Mortgage |
| Less than $50,000 | 14 (48.3%) | 0 (0.0%) |
| $50,000 to $99,999 | 15 (51.7%) | 69 (64.5%) |
| $100,000 to $299,999 | 0 (0.0%) | 38 (35.5%) |
| $300,000 to $499,999 | 0 (0.0%) | 0 (0.0%) |
| $500,000 to $749,999 | 0 (0.0%) | 0 (0.0%) |
| $750,000 to $999,999 | 0 (0.0%) | 0 (0.0%) |
| $1,000,000 or more | 0 (0.0%) | 0 (0.0%) |
| Total | 29 (100.0%) | 107 (100.0%) |
Household Income by Mortgage Status in Clearview Acres
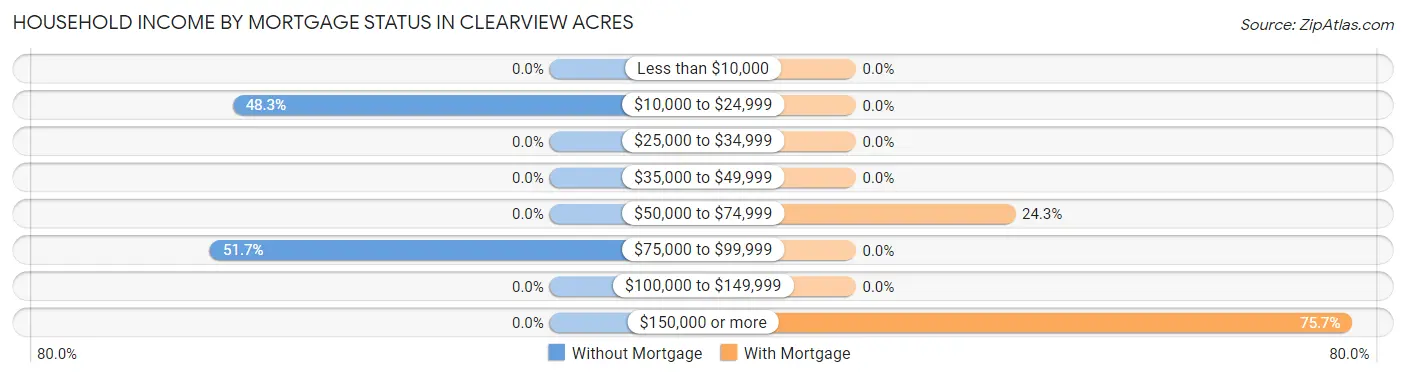
| Household Income | Without Mortgage | With Mortgage |
| Less than $10,000 | 0 (0.0%) | 0 (0.0%) |
| $10,000 to $24,999 | 14 (48.3%) | 0 (0.0%) |
| $25,000 to $34,999 | 0 (0.0%) | 0 (0.0%) |
| $35,000 to $49,999 | 0 (0.0%) | 0 (0.0%) |
| $50,000 to $74,999 | 0 (0.0%) | 26 (24.3%) |
| $75,000 to $99,999 | 15 (51.7%) | 0 (0.0%) |
| $100,000 to $149,999 | 0 (0.0%) | 0 (0.0%) |
| $150,000 or more | 0 (0.0%) | 81 (75.7%) |
| Total | 29 (100.0%) | 107 (100.0%) |
Property Value to Household Income Ratio in Clearview Acres
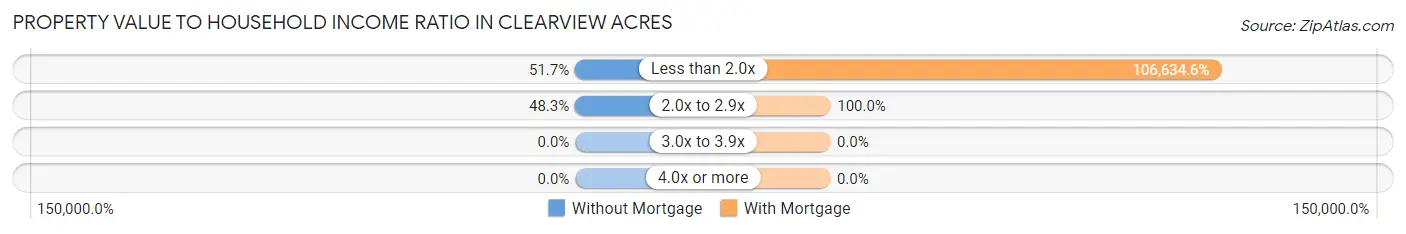
| Value-to-Income Ratio | Without Mortgage | With Mortgage |
| Less than 2.0x | 15 (51.7%) | 114,099 (106,634.6%) |
| 2.0x to 2.9x | 14 (48.3%) | 107 (100.0%) |
| 3.0x to 3.9x | 0 (0.0%) | 0 (0.0%) |
| 4.0x or more | 0 (0.0%) | 0 (0.0%) |
| Total | 29 (100.0%) | 107 (100.0%) |
Real Estate Taxes by Mortgage Status in Clearview Acres
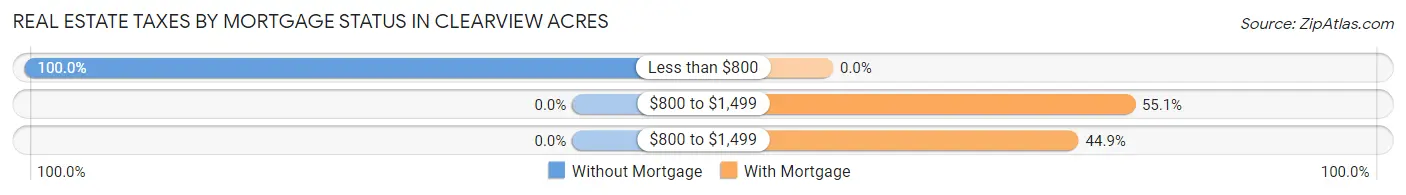
| Property Taxes | Without Mortgage | With Mortgage |
| Less than $800 | 29 (100.0%) | 0 (0.0%) |
| $800 to $1,499 | 0 (0.0%) | 59 (55.1%) |
| $800 to $1,499 | 0 (0.0%) | 48 (44.9%) |
| Total | 29 (100.0%) | 107 (100.0%) |
Health & Disability in Clearview Acres
Health Insurance Coverage by Age in Clearview Acres
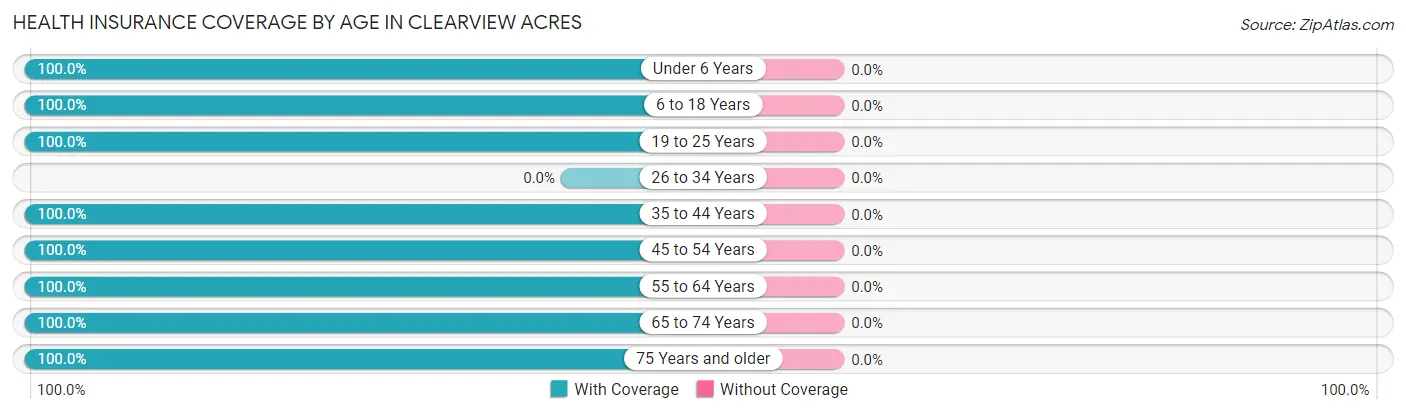
| Age Bracket | With Coverage | Without Coverage |
| Under 6 Years | 3 (100.0%) | 0 (0.0%) |
| 6 to 18 Years | 169 (100.0%) | 0 (0.0%) |
| 19 to 25 Years | 92 (100.0%) | 0 (0.0%) |
| 26 to 34 Years | 0 (0.0%) | 0 (0.0%) |
| 35 to 44 Years | 31 (100.0%) | 0 (0.0%) |
| 45 to 54 Years | 105 (100.0%) | 0 (0.0%) |
| 55 to 64 Years | 55 (100.0%) | 0 (0.0%) |
| 65 to 74 Years | 26 (100.0%) | 0 (0.0%) |
| 75 Years and older | 14 (100.0%) | 0 (0.0%) |
| Total | 495 (100.0%) | 0 (0.0%) |
Health Insurance Coverage by Citizenship Status in Clearview Acres
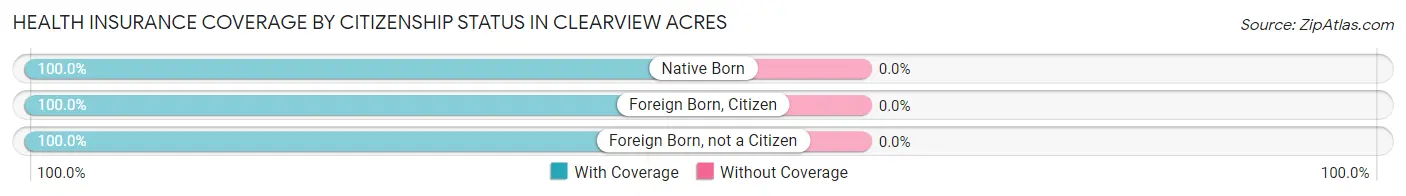
| Citizenship Status | With Coverage | Without Coverage |
| Native Born | 3 (100.0%) | 0 (0.0%) |
| Foreign Born, Citizen | 169 (100.0%) | 0 (0.0%) |
| Foreign Born, not a Citizen | 92 (100.0%) | 0 (0.0%) |
Health Insurance Coverage by Household Income in Clearview Acres
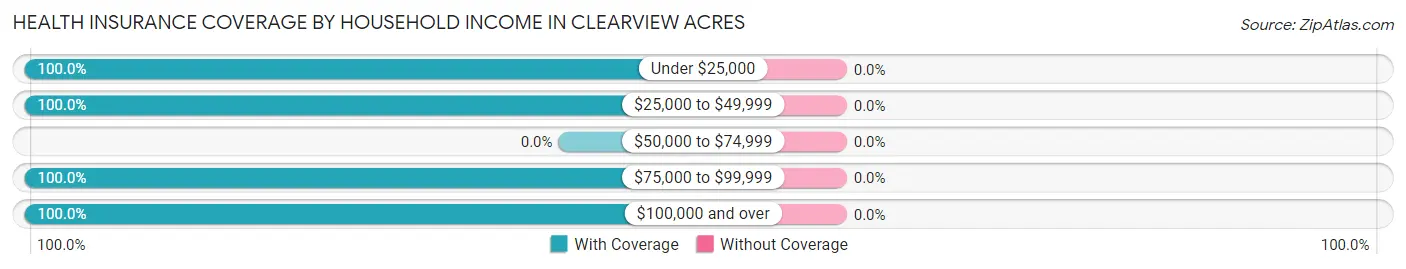
| Household Income | With Coverage | Without Coverage |
| Under $25,000 | 14 (100.0%) | 0 (0.0%) |
| $25,000 to $49,999 | 83 (100.0%) | 0 (0.0%) |
| $50,000 to $74,999 | 0 (0.0%) | 0 (0.0%) |
| $75,000 to $99,999 | 39 (100.0%) | 0 (0.0%) |
| $100,000 and over | 359 (100.0%) | 0 (0.0%) |
Public vs Private Health Insurance Coverage by Age in Clearview Acres
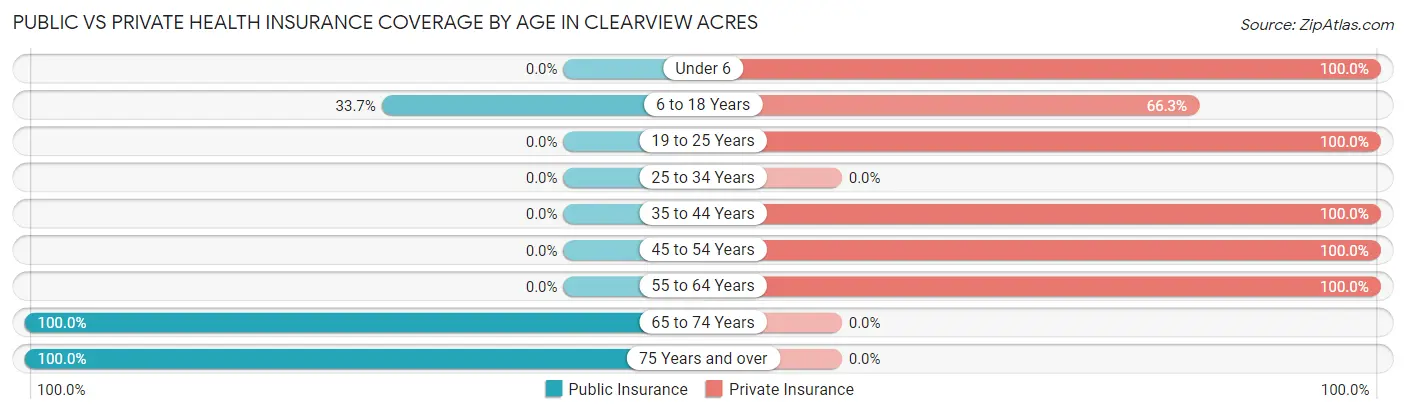
| Age Bracket | Public Insurance | Private Insurance |
| Under 6 | 0 (0.0%) | 3 (100.0%) |
| 6 to 18 Years | 57 (33.7%) | 112 (66.3%) |
| 19 to 25 Years | 0 (0.0%) | 92 (100.0%) |
| 25 to 34 Years | 0 (0.0%) | 0 (0.0%) |
| 35 to 44 Years | 0 (0.0%) | 31 (100.0%) |
| 45 to 54 Years | 0 (0.0%) | 105 (100.0%) |
| 55 to 64 Years | 0 (0.0%) | 55 (100.0%) |
| 65 to 74 Years | 26 (100.0%) | 0 (0.0%) |
| 75 Years and over | 14 (100.0%) | 0 (0.0%) |
| Total | 97 (19.6%) | 398 (80.4%) |
Disability Status by Sex by Age in Clearview Acres
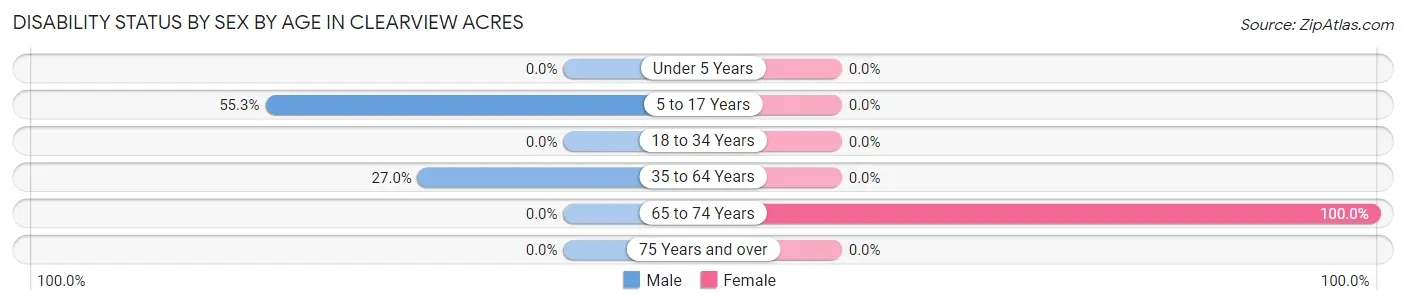
| Age Bracket | Male | Female |
| Under 5 Years | 0 (0.0%) | 0 (0.0%) |
| 5 to 17 Years | 57 (55.3%) | 0 (0.0%) |
| 18 to 34 Years | 0 (0.0%) | 0 (0.0%) |
| 35 to 64 Years | 43 (27.0%) | 0 (0.0%) |
| 65 to 74 Years | 0 (0.0%) | 26 (100.0%) |
| 75 Years and over | 0 (0.0%) | 0 (0.0%) |
Disability Class by Sex by Age in Clearview Acres
Disability Class: Hearing Difficulty
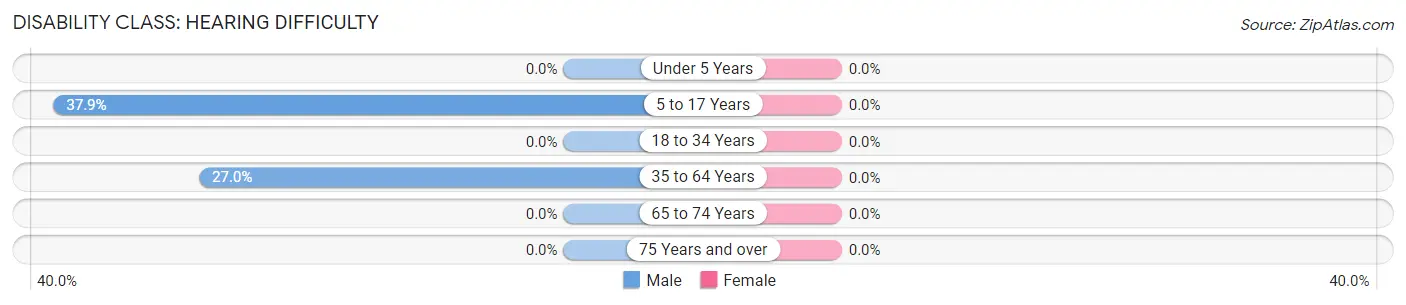
| Age Bracket | Male | Female |
| Under 5 Years | 0 (0.0%) | 0 (0.0%) |
| 5 to 17 Years | 39 (37.9%) | 0 (0.0%) |
| 18 to 34 Years | 0 (0.0%) | 0 (0.0%) |
| 35 to 64 Years | 43 (27.0%) | 0 (0.0%) |
| 65 to 74 Years | 0 (0.0%) | 0 (0.0%) |
| 75 Years and over | 0 (0.0%) | 0 (0.0%) |
Disability Class: Vision Difficulty
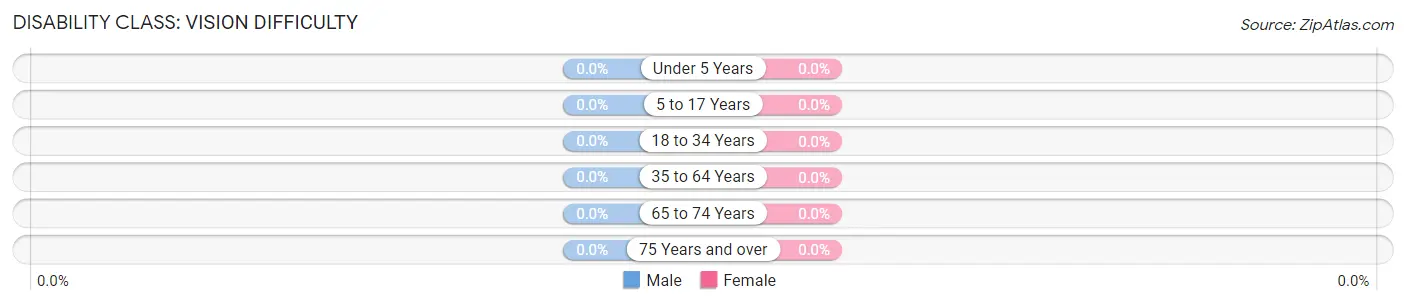
| Age Bracket | Male | Female |
| Under 5 Years | 0 (0.0%) | 0 (0.0%) |
| 5 to 17 Years | 0 (0.0%) | 0 (0.0%) |
| 18 to 34 Years | 0 (0.0%) | 0 (0.0%) |
| 35 to 64 Years | 0 (0.0%) | 0 (0.0%) |
| 65 to 74 Years | 0 (0.0%) | 0 (0.0%) |
| 75 Years and over | 0 (0.0%) | 0 (0.0%) |
Disability Class: Cognitive Difficulty
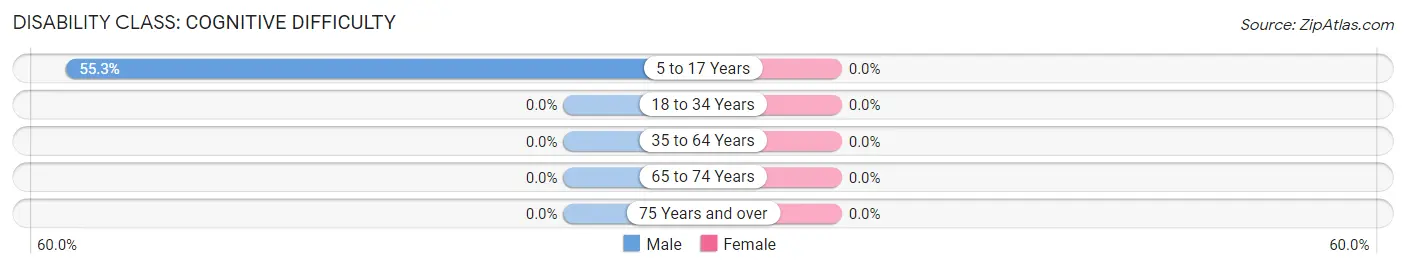
| Age Bracket | Male | Female |
| 5 to 17 Years | 57 (55.3%) | 0 (0.0%) |
| 18 to 34 Years | 0 (0.0%) | 0 (0.0%) |
| 35 to 64 Years | 0 (0.0%) | 0 (0.0%) |
| 65 to 74 Years | 0 (0.0%) | 0 (0.0%) |
| 75 Years and over | 0 (0.0%) | 0 (0.0%) |
Disability Class: Ambulatory Difficulty
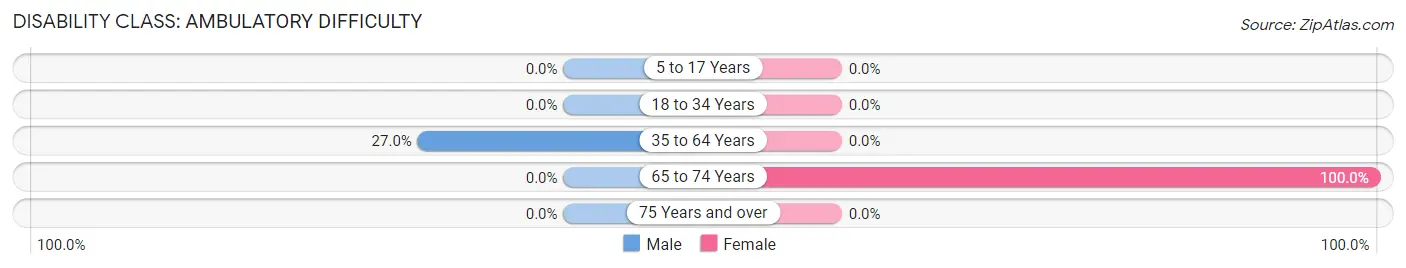
| Age Bracket | Male | Female |
| 5 to 17 Years | 0 (0.0%) | 0 (0.0%) |
| 18 to 34 Years | 0 (0.0%) | 0 (0.0%) |
| 35 to 64 Years | 43 (27.0%) | 0 (0.0%) |
| 65 to 74 Years | 0 (0.0%) | 26 (100.0%) |
| 75 Years and over | 0 (0.0%) | 0 (0.0%) |
Disability Class: Self-Care Difficulty
| Age Bracket | Male | Female |
| 5 to 17 Years | 0 (0.0%) | 0 (0.0%) |
| 18 to 34 Years | 0 (0.0%) | 0 (0.0%) |
| 35 to 64 Years | 0 (0.0%) | 0 (0.0%) |
| 65 to 74 Years | 0 (0.0%) | 0 (0.0%) |
| 75 Years and over | 0 (0.0%) | 0 (0.0%) |
Technology Access in Clearview Acres
Computing Device Access in Clearview Acres
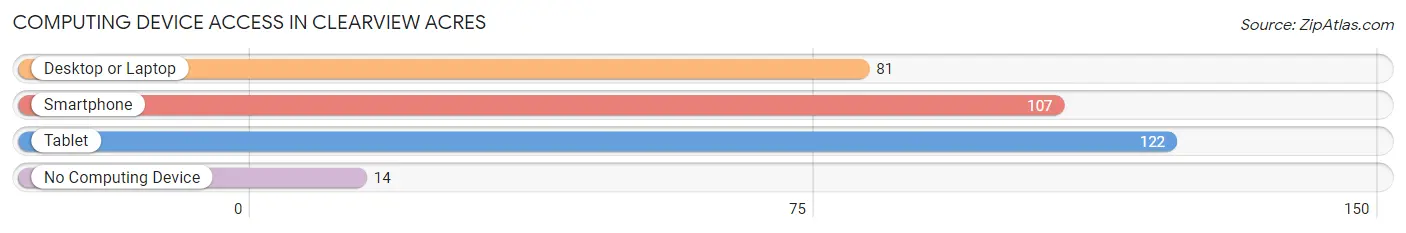
| Device Type | # Households | % Households |
| Desktop or Laptop | 81 | 59.6% |
| Smartphone | 107 | 78.7% |
| Tablet | 122 | 89.7% |
| No Computing Device | 14 | 10.3% |
| Total | 136 | 100.0% |
Internet Access in Clearview Acres
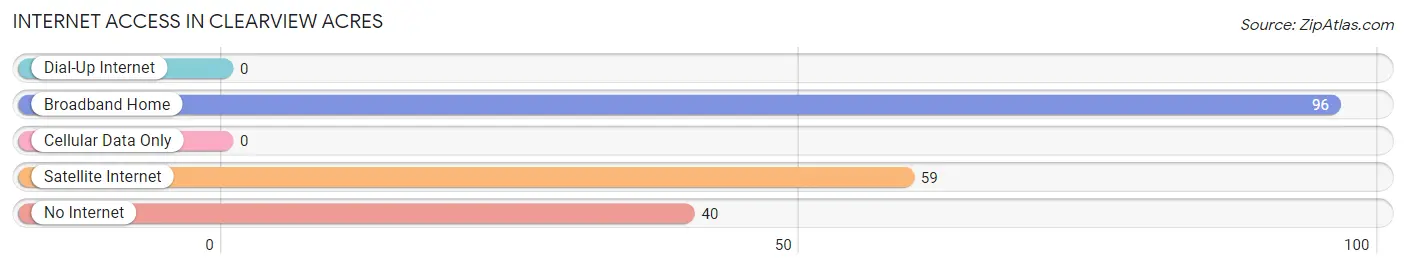
| Internet Type | # Households | % Households |
| Dial-Up Internet | 0 | 0.0% |
| Broadband Home | 96 | 70.6% |
| Cellular Data Only | 0 | 0.0% |
| Satellite Internet | 59 | 43.4% |
| No Internet | 40 | 29.4% |
| Total | 136 | 100.0% |
Clearview Acres Summary
Clearview Acres is a small unincorporated community located in the southeastern corner of Wyoming, in the United States. It is situated in the foothills of the Laramie Mountains, approximately 25 miles south of Cheyenne, the state capital. The community is located in Laramie County, and is part of the Cheyenne Metropolitan Statistical Area.
History
Clearview Acres was founded in the late 1800s by a group of homesteaders who were looking for a place to settle and raise their families. The area was originally known as Clearview, but the name was changed to Clearview Acres in the early 1900s. The community was officially incorporated in 1909.
The town was originally a farming and ranching community, but in the early 1900s, the area began to attract tourists who were looking for a place to relax and enjoy the outdoors. The town was also known for its mineral springs, which were believed to have healing properties.
In the 1950s, the town began to experience a population decline as many of the residents moved away in search of better economic opportunities. However, the town has experienced a resurgence in recent years, as more people have moved to the area in search of a rural lifestyle.
Geography
Clearview Acres is located in the southeastern corner of Wyoming, in the foothills of the Laramie Mountains. The town is situated at an elevation of 6,000 feet, and is surrounded by rolling hills and grasslands. The town is located approximately 25 miles south of Cheyenne, the state capital.
The town is located in Laramie County, and is part of the Cheyenne Metropolitan Statistical Area. The town is located near the intersection of Interstate 80 and US Highway 85.
Economy
The economy of Clearview Acres is largely based on agriculture and tourism. The town is home to several small farms and ranches, which produce a variety of crops and livestock. The town is also home to several tourist attractions, including the Clearview Acres Mineral Springs, which are believed to have healing properties.
The town is also home to several small businesses, including restaurants, shops, and other services. The town is also home to a small airport, which serves the local area.
Demographics
As of the 2010 census, the population of Clearview Acres was 1,093. The town has a total area of 1.2 square miles, all of which is land. The town has a population density of 890.7 people per square mile.
The racial makeup of the town is 97.2% White, 0.7% Native American, 0.3% Asian, 0.2% from other races, and 1.6% from two or more races. The median age of the town is 44.2 years, and the median household income is $50,000.
Conclusion
Clearview Acres is a small unincorporated community located in the southeastern corner of Wyoming. The town was founded in the late 1800s by a group of homesteaders, and has since become a popular tourist destination. The town is largely based on agriculture and tourism, and is home to several small businesses. The population of Clearview Acres is 1,093, and the median age is 44.2 years.
Common Questions
What is Per Capita Income in Clearview Acres?
Per Capita income in Clearview Acres is $27,551.
What is the Median Family Income in Clearview Acres?
Median Family Income in Clearview Acres is $72,035.
What is the Median Household income in Clearview Acres?
Median Household Income in Clearview Acres is $113,256.
What is Income or Wage Gap in Clearview Acres?
Income or Wage Gap in Clearview Acres is 52.2%.
Women in Clearview Acres earn 47.8 cents for every dollar earned by a man.
What is Inequality or Gini Index in Clearview Acres?
Inequality or Gini Index in Clearview Acres is 0.23.
What is the Total Population of Clearview Acres?
Total Population of Clearview Acres is 495.
What is the Total Male Population of Clearview Acres?
Total Male Population of Clearview Acres is 368.
What is the Total Female Population of Clearview Acres?
Total Female Population of Clearview Acres is 127.
What is the Ratio of Males per 100 Females in Clearview Acres?
There are 289.76 Males per 100 Females in Clearview Acres.
What is the Ratio of Females per 100 Males in Clearview Acres?
There are 34.51 Females per 100 Males in Clearview Acres.
What is the Median Population Age in Clearview Acres?
Median Population Age in Clearview Acres is 19.8 Years.
What is the Average Family Size in Clearview Acres
Average Family Size in Clearview Acres is 3.4 People.
What is the Average Household Size in Clearview Acres
Average Household Size in Clearview Acres is 3.6 People.
How Large is the Labor Force in Clearview Acres?
There are 340 People in the Labor Forcein in Clearview Acres.
What is the Percentage of People in the Labor Force in Clearview Acres?
89.5% of People are in the Labor Force in Clearview Acres.