Bessemer Bend, WY Map & Demographics
Bessemer Bend Map
Bessemer Bend Overview
$100,520
PER CAPITA INCOME
$153,158
AVG FAMILY INCOME
$153,618
AVG HOUSEHOLD INCOME
0.30
INEQUALITY / GINI INDEX
118
TOTAL POPULATION
78
MALE POPULATION
40
FEMALE POPULATION
195.00
MALES / 100 FEMALES
51.28
FEMALES / 100 MALES
66.9
MEDIAN AGE
2.3
AVG FAMILY SIZE
1.8
AVG HOUSEHOLD SIZE
67
LABOR FORCE [ PEOPLE ]
56.8%
PERCENT IN LABOR FORCE
Income in Bessemer Bend
Income Overview in Bessemer Bend
Per Capita Income in Bessemer Bend is $100,520, while median incomes of families and households are $153,158 and $153,618 respectively.
| Characteristic | Number | Measure |
| Per Capita Income | 118 | $100,520 |
| Median Family Income | 40 | $153,158 |
| Mean Family Income | 40 | $131,630 |
| Median Household Income | 65 | $153,618 |
| Mean Household Income | 65 | $172,198 |
| Income Deficit | 40 | $0 |
| Wage / Income Gap (%) | 118 | 0.00% |
| Wage / Income Gap ($) | 118 | 100.00¢ per $1 |
| Gini / Inequality Index | 118 | 0.30 |
Earnings by Sex in Bessemer Bend
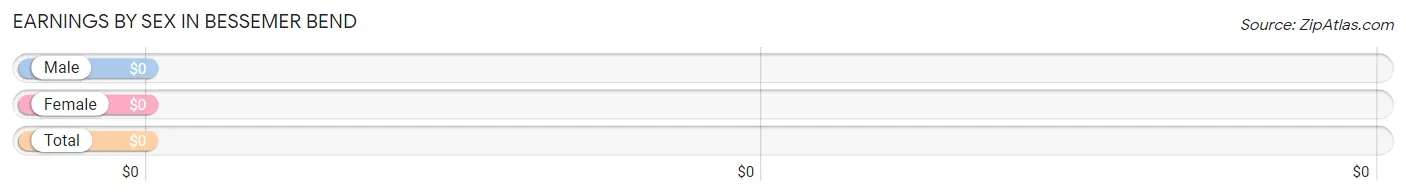
| Sex | Number | Average Earnings |
| Male | 61 (74.4%) | $0 |
| Female | 21 (25.6%) | $0 |
| Total | 82 (100.0%) | $0 |
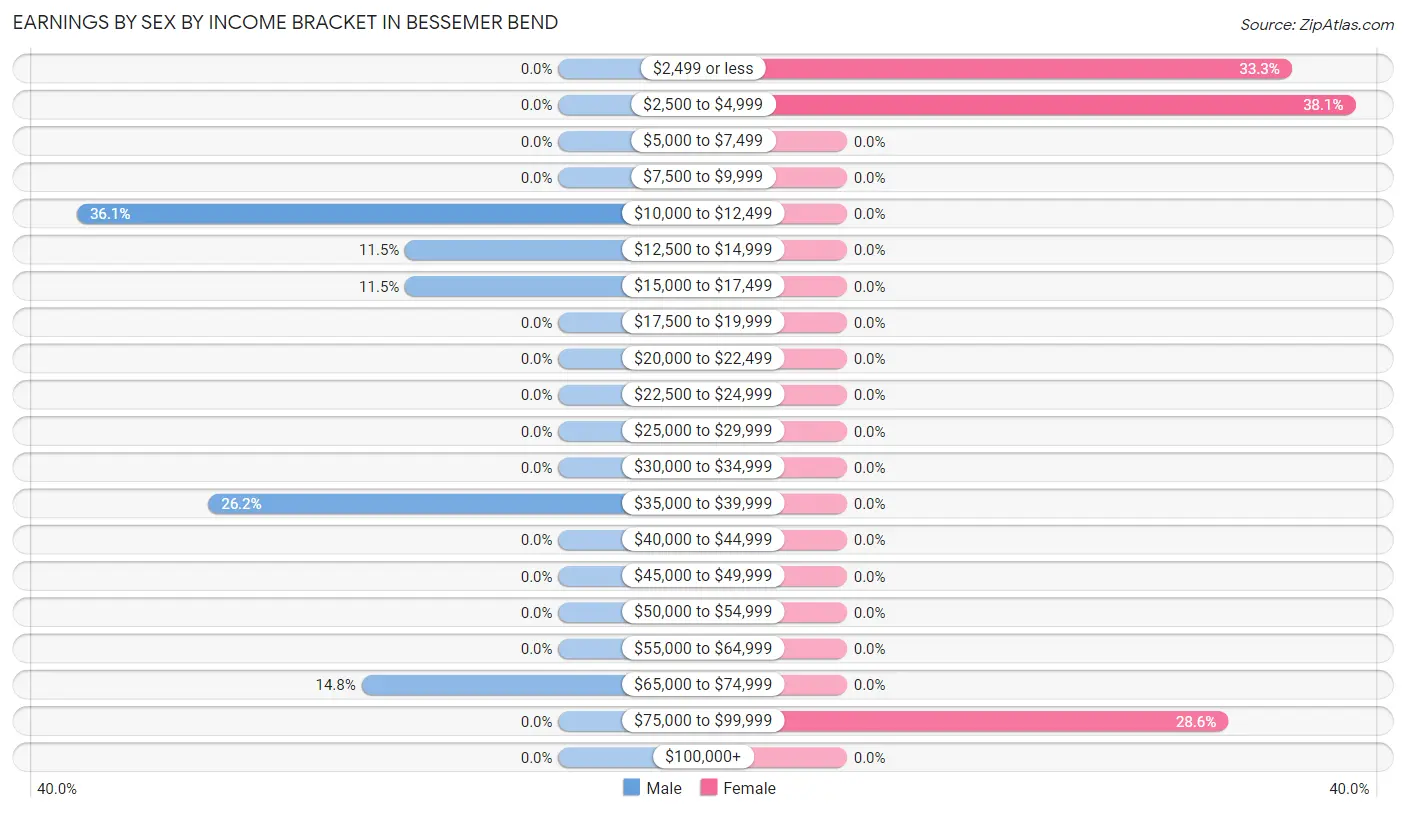
Earnings by Sex by Income Bracket in Bessemer Bend
The most common earnings brackets in Bessemer Bend are $10,000 to $12,499 for men (22 | 36.1%) and $2,500 to $4,999 for women (8 | 38.1%).
| Income | Male | Female |
| $2,499 or less | 0 (0.0%) | 7 (33.3%) |
| $2,500 to $4,999 | 0 (0.0%) | 8 (38.1%) |
| $5,000 to $7,499 | 0 (0.0%) | 0 (0.0%) |
| $7,500 to $9,999 | 0 (0.0%) | 0 (0.0%) |
| $10,000 to $12,499 | 22 (36.1%) | 0 (0.0%) |
| $12,500 to $14,999 | 7 (11.5%) | 0 (0.0%) |
| $15,000 to $17,499 | 7 (11.5%) | 0 (0.0%) |
| $17,500 to $19,999 | 0 (0.0%) | 0 (0.0%) |
| $20,000 to $22,499 | 0 (0.0%) | 0 (0.0%) |
| $22,500 to $24,999 | 0 (0.0%) | 0 (0.0%) |
| $25,000 to $29,999 | 0 (0.0%) | 0 (0.0%) |
| $30,000 to $34,999 | 0 (0.0%) | 0 (0.0%) |
| $35,000 to $39,999 | 16 (26.2%) | 0 (0.0%) |
| $40,000 to $44,999 | 0 (0.0%) | 0 (0.0%) |
| $45,000 to $49,999 | 0 (0.0%) | 0 (0.0%) |
| $50,000 to $54,999 | 0 (0.0%) | 0 (0.0%) |
| $55,000 to $64,999 | 0 (0.0%) | 0 (0.0%) |
| $65,000 to $74,999 | 9 (14.7%) | 0 (0.0%) |
| $75,000 to $99,999 | 0 (0.0%) | 6 (28.6%) |
| $100,000+ | 0 (0.0%) | 0 (0.0%) |
| Total | 61 (100.0%) | 21 (100.0%) |
Earnings by Sex by Educational Attainment in Bessemer Bend
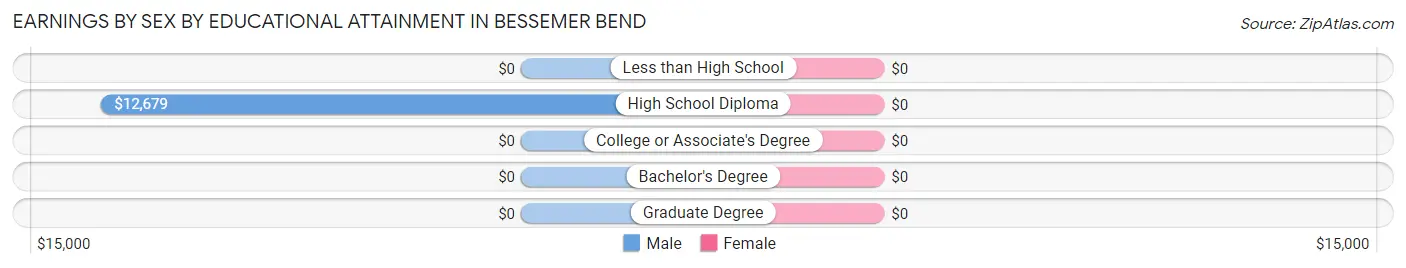
| Educational Attainment | Male Income | Female Income |
| Less than High School | - | - |
| High School Diploma | $12,679 | $0 |
| College or Associate's Degree | - | - |
| Bachelor's Degree | - | - |
| Graduate Degree | - | - |
| Total | - | - |
Family Income in Bessemer Bend
Family Income Brackets in Bessemer Bend
According to the Bessemer Bend family income data, there are 25 families falling into the $150,000 to $199,999 income range, which is the most common income bracket and makes up 62.5% of all families.
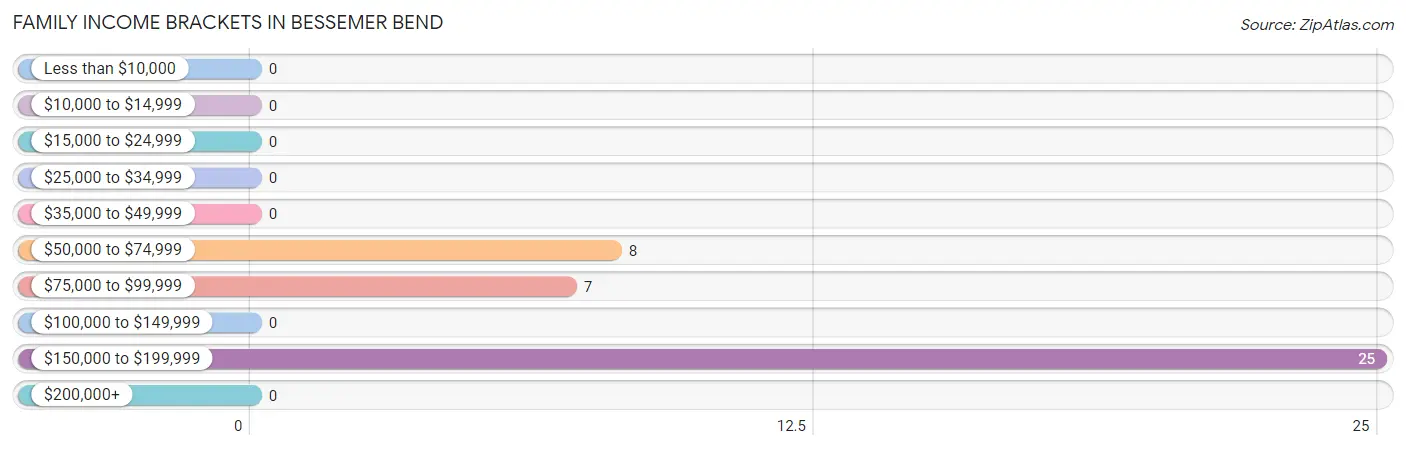
| Income Bracket | # Families | % Families |
| Less than $10,000 | 0 | 0.0% |
| $10,000 to $14,999 | 0 | 0.0% |
| $15,000 to $24,999 | 0 | 0.0% |
| $25,000 to $34,999 | 0 | 0.0% |
| $35,000 to $49,999 | 0 | 0.0% |
| $50,000 to $74,999 | 8 | 20.0% |
| $75,000 to $99,999 | 7 | 17.5% |
| $100,000 to $149,999 | 0 | 0.0% |
| $150,000 to $199,999 | 25 | 62.5% |
| $200,000+ | 0 | 0.0% |
Family Income by Famaliy Size in Bessemer Bend
2-person families (34 | 85.0%) account for the highest median family income in Bessemer Bend with $152,763 per family, while 2-person families (34 | 85.0%) have the highest median income of $76,382 per family member.
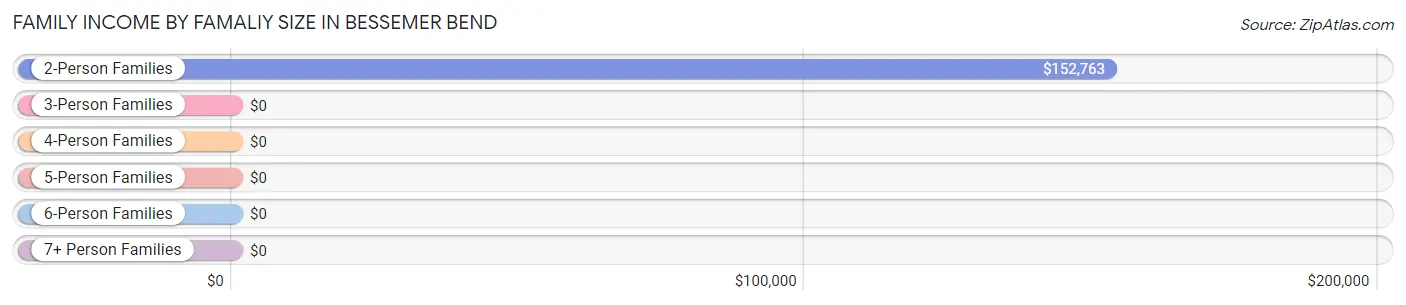
| Income Bracket | # Families | Median Income |
| 2-Person Families | 34 (85.0%) | $152,763 |
| 3-Person Families | 6 (15.0%) | $0 |
| 4-Person Families | 0 (0.0%) | $0 |
| 5-Person Families | 0 (0.0%) | $0 |
| 6-Person Families | 0 (0.0%) | $0 |
| 7+ Person Families | 0 (0.0%) | $0 |
| Total | 40 (100.0%) | $153,158 |
Family Income by Number of Earners in Bessemer Bend
| Number of Earners | # Families | Median Income |
| No Earners | 0 (0.0%) | $0 |
| 1 Earner | 27 (67.5%) | $0 |
| 2 Earners | 7 (17.5%) | $0 |
| 3+ Earners | 6 (15.0%) | $0 |
| Total | 40 (100.0%) | $153,158 |
Household Income in Bessemer Bend
Household Income Brackets in Bessemer Bend
With 25 households falling in the category, the $150,000 to $199,999 income range is the most frequent in Bessemer Bend, accounting for 38.5% of all households.
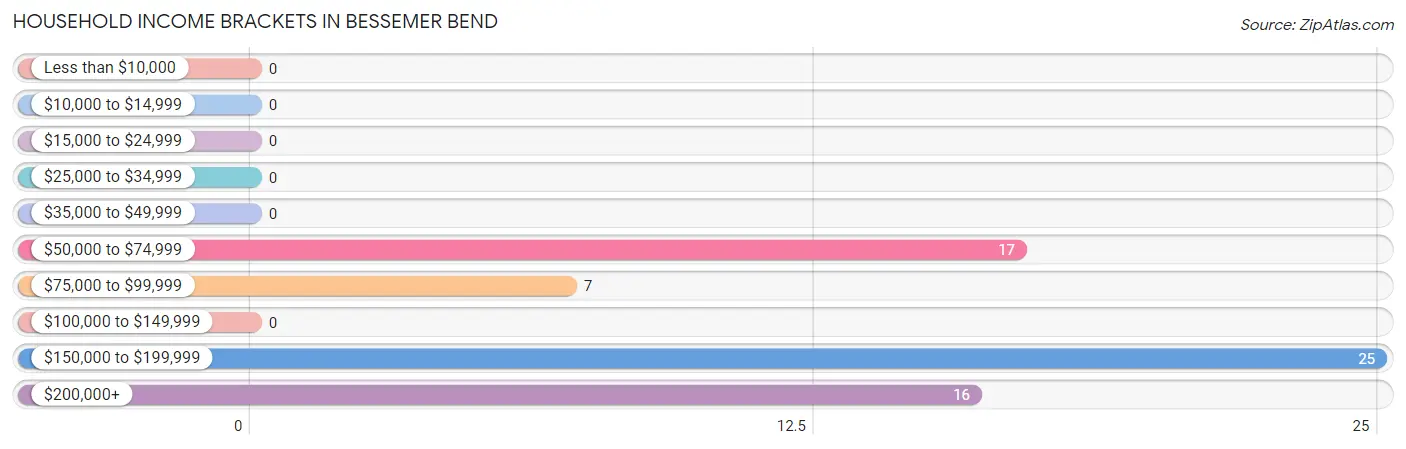
| Income Bracket | # Households | % Households |
| Less than $10,000 | 0 | 0.0% |
| $10,000 to $14,999 | 0 | 0.0% |
| $15,000 to $24,999 | 0 | 0.0% |
| $25,000 to $34,999 | 0 | 0.0% |
| $35,000 to $49,999 | 0 | 0.0% |
| $50,000 to $74,999 | 17 | 26.2% |
| $75,000 to $99,999 | 7 | 10.8% |
| $100,000 to $149,999 | 0 | 0.0% |
| $150,000 to $199,999 | 25 | 38.5% |
| $200,000+ | 16 | 24.6% |
Household Income by Householder Age in Bessemer Bend
The median household income in Bessemer Bend is $153,618, with the highest median household income of $153,224 found in the 65+ years age bracket for the primary householder. A total of 59 households (90.8%) fall into this category.
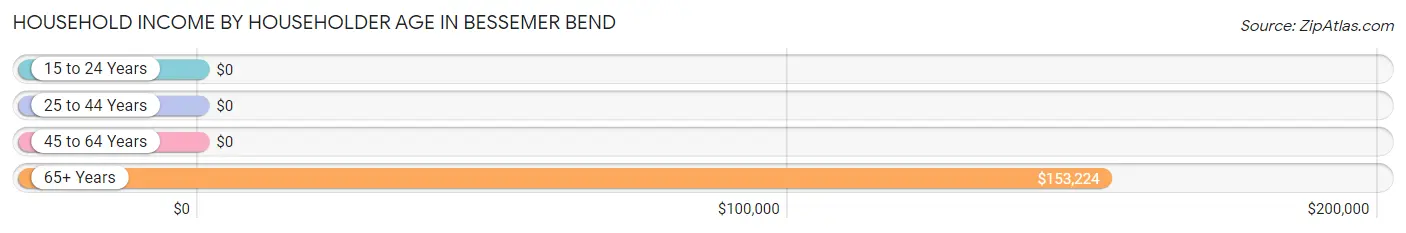
| Income Bracket | # Households | Median Income |
| 15 to 24 Years | 0 (0.0%) | $0 |
| 25 to 44 Years | 0 (0.0%) | $0 |
| 45 to 64 Years | 6 (9.2%) | $0 |
| 65+ Years | 59 (90.8%) | $153,224 |
| Total | 65 (100.0%) | $153,618 |
Poverty in Bessemer Bend
Income Below Poverty by Sex and Age in Bessemer Bend
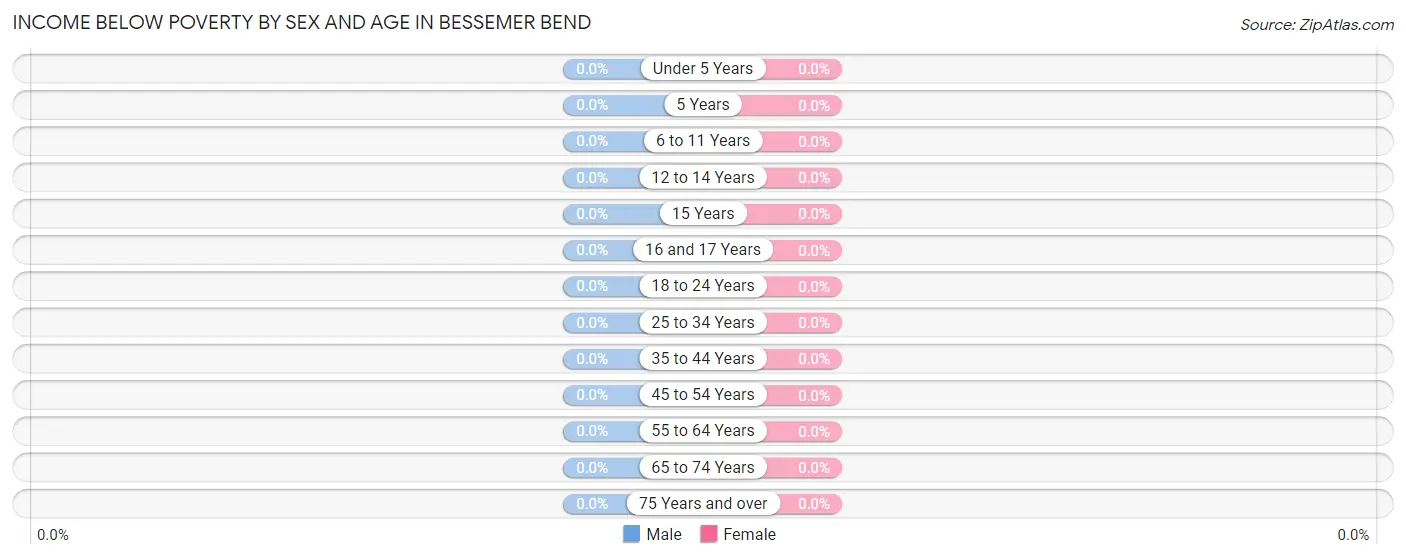
| Age Bracket | Male | Female |
| Under 5 Years | 0 (0.0%) | 0 (0.0%) |
| 5 Years | 0 (0.0%) | 0 (0.0%) |
| 6 to 11 Years | 0 (0.0%) | 0 (0.0%) |
| 12 to 14 Years | 0 (0.0%) | 0 (0.0%) |
| 15 Years | 0 (0.0%) | 0 (0.0%) |
| 16 and 17 Years | 0 (0.0%) | 0 (0.0%) |
| 18 to 24 Years | 0 (0.0%) | 0 (0.0%) |
| 25 to 34 Years | 0 (0.0%) | 0 (0.0%) |
| 35 to 44 Years | 0 (0.0%) | 0 (0.0%) |
| 45 to 54 Years | 0 (0.0%) | 0 (0.0%) |
| 55 to 64 Years | 0 (0.0%) | 0 (0.0%) |
| 65 to 74 Years | 0 (0.0%) | 0 (0.0%) |
| 75 Years and over | 0 (0.0%) | 0 (0.0%) |
| Total | 0 (0.0%) | 0 (0.0%) |
Income Above Poverty by Sex and Age in Bessemer Bend
According to the poverty statistics in Bessemer Bend, males aged 25 to 34 years and females aged 45 to 54 years are the age groups that are most secure financially, with 100.0% of males and 100.0% of females in these age groups living above the poverty line.
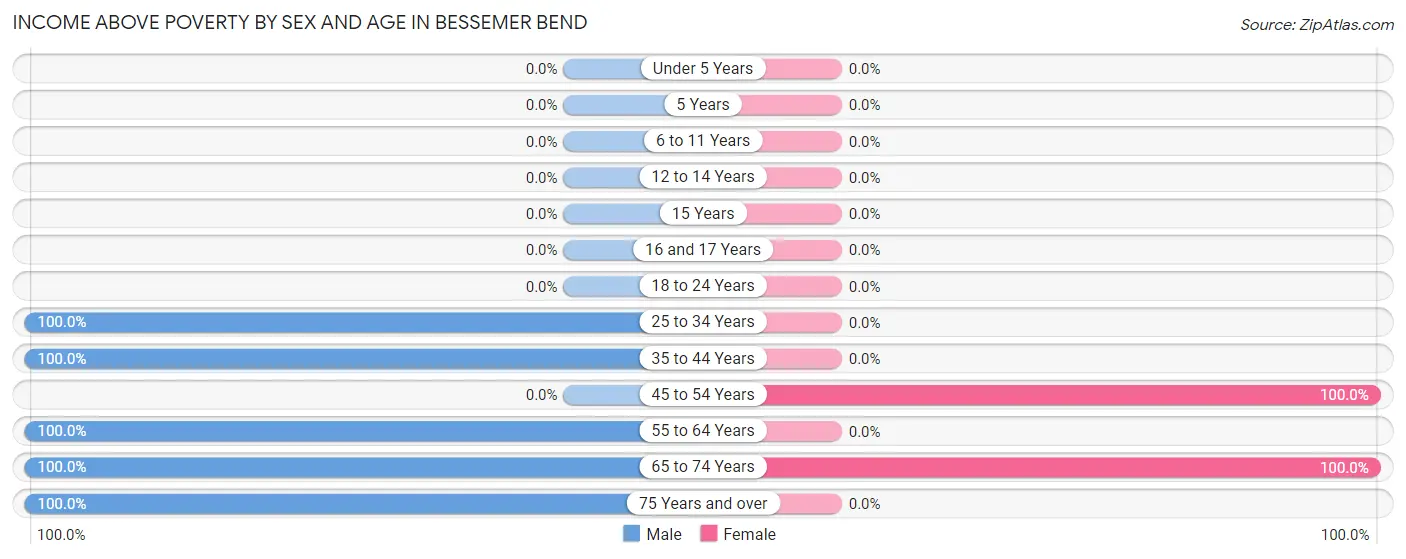
| Age Bracket | Male | Female |
| Under 5 Years | 0 (0.0%) | 0 (0.0%) |
| 5 Years | 0 (0.0%) | 0 (0.0%) |
| 6 to 11 Years | 0 (0.0%) | 0 (0.0%) |
| 12 to 14 Years | 0 (0.0%) | 0 (0.0%) |
| 15 Years | 0 (0.0%) | 0 (0.0%) |
| 16 and 17 Years | 0 (0.0%) | 0 (0.0%) |
| 18 to 24 Years | 0 (0.0%) | 0 (0.0%) |
| 25 to 34 Years | 7 (100.0%) | 0 (0.0%) |
| 35 to 44 Years | 9 (100.0%) | 0 (0.0%) |
| 45 to 54 Years | 0 (0.0%) | 6 (100.0%) |
| 55 to 64 Years | 22 (100.0%) | 0 (0.0%) |
| 65 to 74 Years | 17 (100.0%) | 34 (100.0%) |
| 75 Years and over | 23 (100.0%) | 0 (0.0%) |
| Total | 78 (100.0%) | 40 (100.0%) |
Income Below Poverty Among Married-Couple Families in Bessemer Bend
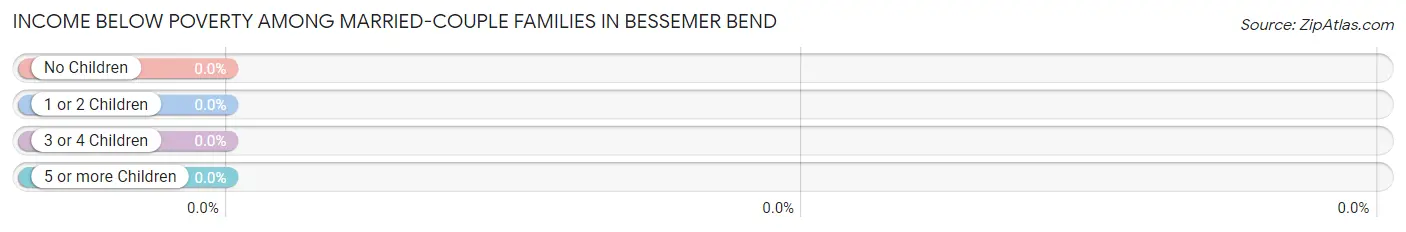
| Children | Above Poverty | Below Poverty |
| No Children | 40 (100.0%) | 0 (0.0%) |
| 1 or 2 Children | 0 (0.0%) | 0 (0.0%) |
| 3 or 4 Children | 0 (0.0%) | 0 (0.0%) |
| 5 or more Children | 0 (0.0%) | 0 (0.0%) |
| Total | 40 (100.0%) | 0 (0.0%) |
Income Below Poverty Among Single-Parent Households in Bessemer Bend
| Children | Single Father | Single Mother |
| No Children | 0 (0.0%) | 0 (0.0%) |
| 1 or 2 Children | 0 (0.0%) | 0 (0.0%) |
| 3 or 4 Children | 0 (0.0%) | 0 (0.0%) |
| 5 or more Children | 0 (0.0%) | 0 (0.0%) |
| Total | 0 (0.0%) | 0 (0.0%) |
Income Below Poverty Among Married-Couple vs Single-Parent Households in Bessemer Bend
| Children | Married-Couple Families | Single-Parent Households |
| No Children | 0 (0.0%) | 0 (0.0%) |
| 1 or 2 Children | 0 (0.0%) | 0 (0.0%) |
| 3 or 4 Children | 0 (0.0%) | 0 (0.0%) |
| 5 or more Children | 0 (0.0%) | 0 (0.0%) |
| Total | 0 (0.0%) | 0 (0.0%) |
Race in Bessemer Bend
The most populous races in Bessemer Bend are , and White / Caucasian (118 | 100.0%).
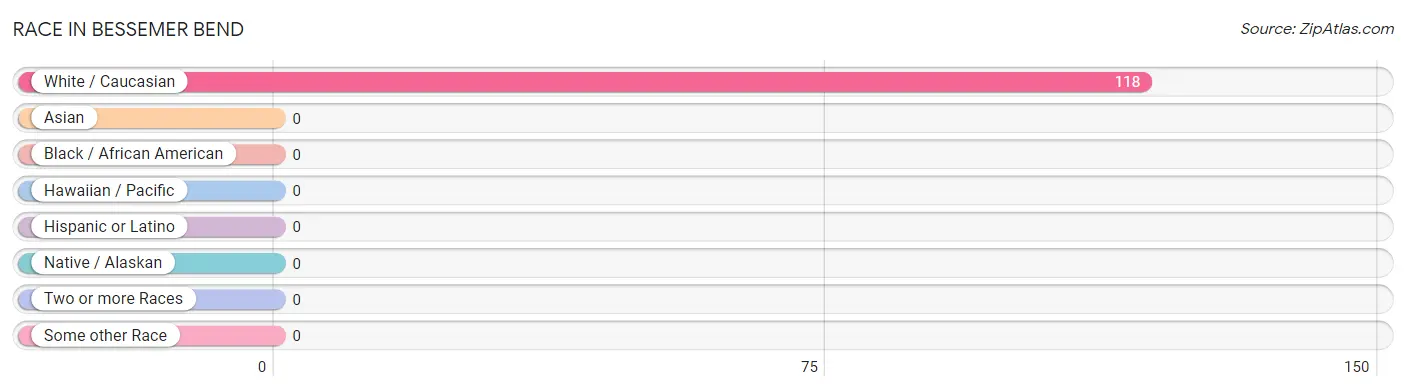
| Race | # Population | % Population |
| Asian | 0 | 0.0% |
| Black / African American | 0 | 0.0% |
| Hawaiian / Pacific | 0 | 0.0% |
| Hispanic or Latino | 0 | 0.0% |
| Native / Alaskan | 0 | 0.0% |
| White / Caucasian | 118 | 100.0% |
| Two or more Races | 0 | 0.0% |
| Some other Race | 0 | 0.0% |
| Total | 118 | 100.0% |
Ancestry in Bessemer Bend
The most populous ancestries reported in Bessemer Bend are Dutch (28 | 23.7%), Scottish (19 | 16.1%), American (16 | 13.6%), Scotch-Irish (16 | 13.6%), and German (14 | 11.9%), together accounting for 78.8% of all Bessemer Bend residents.
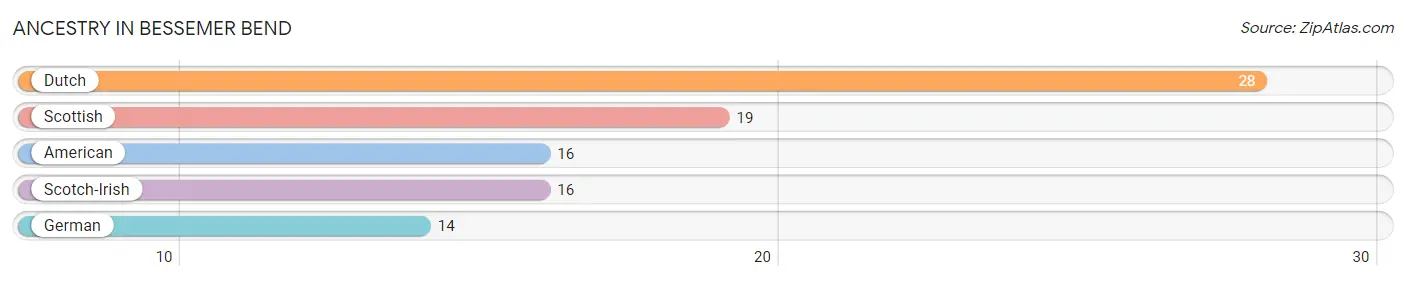
| Ancestry | # Population | % Population |
| American | 16 | 13.6% |
| Dutch | 28 | 23.7% |
| German | 14 | 11.9% |
| Scotch-Irish | 16 | 13.6% |
| Scottish | 19 | 16.1% | View All 5 Rows |
Immigrants in Bessemer Bend

| Immigration Origin | # Population | % Population | View All 0 Rows |
Sex and Age in Bessemer Bend
Sex and Age in Bessemer Bend
The most populous age groups in Bessemer Bend are 60 to 64 Years (22 | 28.2%) for men and 65 to 69 Years (27 | 67.5%) for women.
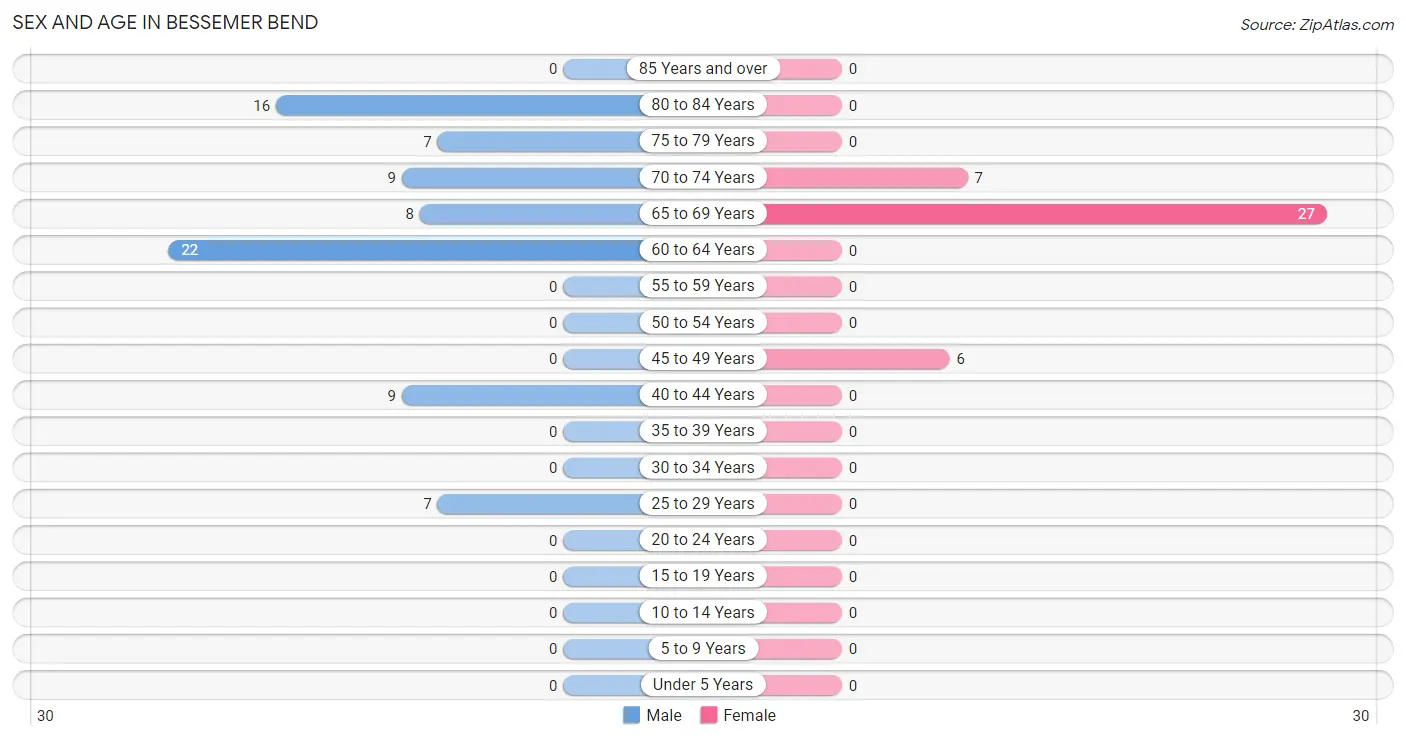
| Age Bracket | Male | Female |
| Under 5 Years | 0 (0.0%) | 0 (0.0%) |
| 5 to 9 Years | 0 (0.0%) | 0 (0.0%) |
| 10 to 14 Years | 0 (0.0%) | 0 (0.0%) |
| 15 to 19 Years | 0 (0.0%) | 0 (0.0%) |
| 20 to 24 Years | 0 (0.0%) | 0 (0.0%) |
| 25 to 29 Years | 7 (9.0%) | 0 (0.0%) |
| 30 to 34 Years | 0 (0.0%) | 0 (0.0%) |
| 35 to 39 Years | 0 (0.0%) | 0 (0.0%) |
| 40 to 44 Years | 9 (11.5%) | 0 (0.0%) |
| 45 to 49 Years | 0 (0.0%) | 6 (15.0%) |
| 50 to 54 Years | 0 (0.0%) | 0 (0.0%) |
| 55 to 59 Years | 0 (0.0%) | 0 (0.0%) |
| 60 to 64 Years | 22 (28.2%) | 0 (0.0%) |
| 65 to 69 Years | 8 (10.3%) | 27 (67.5%) |
| 70 to 74 Years | 9 (11.5%) | 7 (17.5%) |
| 75 to 79 Years | 7 (9.0%) | 0 (0.0%) |
| 80 to 84 Years | 16 (20.5%) | 0 (0.0%) |
| 85 Years and over | 0 (0.0%) | 0 (0.0%) |
| Total | 78 (100.0%) | 40 (100.0%) |
Families and Households in Bessemer Bend
Median Family Size in Bessemer Bend
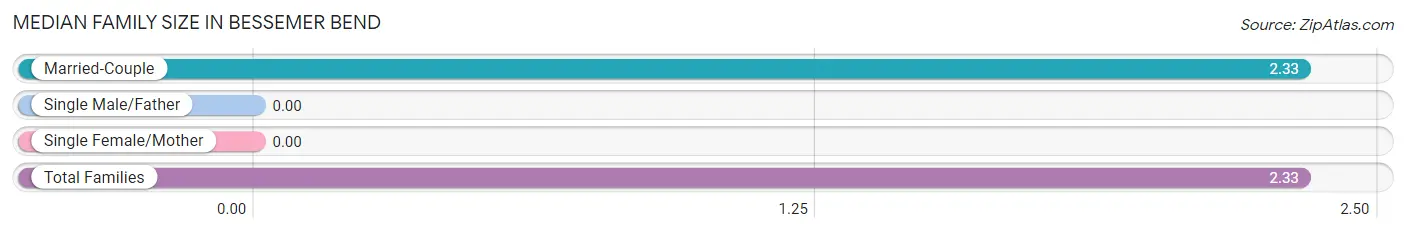
| Family Type | # Families | Family Size |
| Married-Couple | 40 (100.0%) | 2.33 |
| Single Male/Father | 0 (0.0%) | - |
| Single Female/Mother | 0 (0.0%) | - |
| Total Families | 40 (100.0%) | 2.33 |
Median Household Size in Bessemer Bend
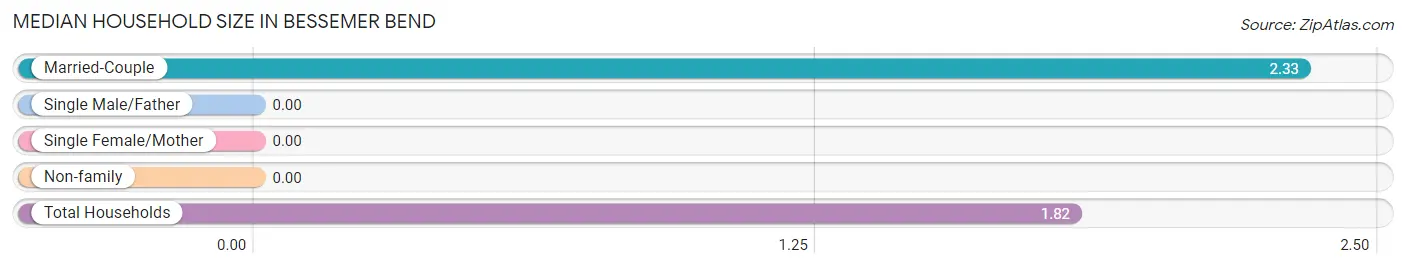
| Household Type | # Households | Household Size |
| Married-Couple | 40 (61.5%) | 2.33 |
| Single Male/Father | 0 (0.0%) | - |
| Single Female/Mother | 0 (0.0%) | - |
| Non-family | 25 (38.5%) | - |
| Total Households | 65 (100.0%) | 1.82 |
Household Size by Marriage Status in Bessemer Bend
Out of a total of 65 households in Bessemer Bend, 40 (61.5%) are family households, while 25 (38.5%) are nonfamily households. The most numerous type of family households are 2-person households, comprising 34, and the most common type of nonfamily households are 1-person households, comprising 25.
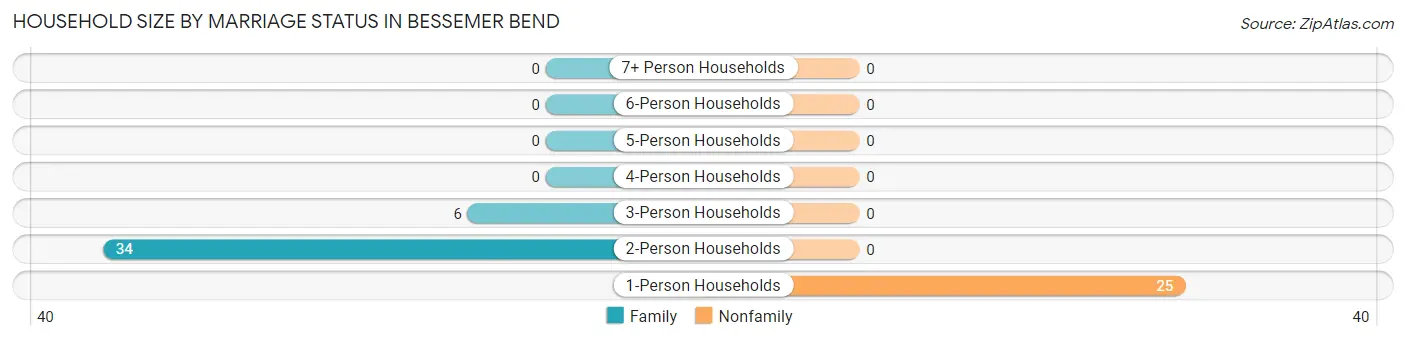
| Household Size | Family Households | Nonfamily Households |
| 1-Person Households | - | 25 (38.5%) |
| 2-Person Households | 34 (52.3%) | 0 (0.0%) |
| 3-Person Households | 6 (9.2%) | 0 (0.0%) |
| 4-Person Households | 0 (0.0%) | 0 (0.0%) |
| 5-Person Households | 0 (0.0%) | 0 (0.0%) |
| 6-Person Households | 0 (0.0%) | 0 (0.0%) |
| 7+ Person Households | 0 (0.0%) | 0 (0.0%) |
| Total | 40 (61.5%) | 25 (38.5%) |
Female Fertility in Bessemer Bend
Fertility by Age in Bessemer Bend
| Age Bracket | Women with Births | Births / 1,000 Women |
| 15 to 19 years | 0 (0.0%) | 0.0 |
| 20 to 34 years | 0 (0.0%) | 0.0 |
| 35 to 50 years | 0 (0.0%) | 0.0 |
| Total | 0 (0.0%) | 0.0 |
Fertility by Age by Marriage Status in Bessemer Bend
| Age Bracket | Married | Unmarried |
| 15 to 19 years | 0 (0.0%) | 0 (0.0%) |
| 20 to 34 years | 0 (0.0%) | 0 (0.0%) |
| 35 to 50 years | 0 (0.0%) | 0 (0.0%) |
| Total | 0 (0.0%) | 0 (0.0%) |
Fertility by Education in Bessemer Bend
| Educational Attainment | Women with Births | Births / 1,000 Women |
| Less than High School | 0 (0.0%) | 0.0 |
| High School Diploma | 0 (0.0%) | 0.0 |
| College or Associate's Degree | 0 (0.0%) | 0.0 |
| Bachelor's Degree | 0 (0.0%) | 0.0 |
| Graduate Degree | 0 (0.0%) | 0.0 |
| Total | 0 (0.0%) | 0.0 |
Fertility by Education by Marriage Status in Bessemer Bend
| Educational Attainment | Married | Unmarried |
| Less than High School | 0 (0.0%) | 0 (0.0%) |
| High School Diploma | 0 (0.0%) | 0 (0.0%) |
| College or Associate's Degree | 0 (0.0%) | 0 (0.0%) |
| Bachelor's Degree | 0 (0.0%) | 0 (0.0%) |
| Graduate Degree | 0 (0.0%) | 0 (0.0%) |
| Total | 0 (0.0%) | 0 (0.0%) |
Employment Characteristics in Bessemer Bend
Employment by Class of Employer in Bessemer Bend
Among the 67 employed individuals in Bessemer Bend, private company employees (51 | 76.1%), and self-employed (incorporated) (16 | 23.9%) make up the most common classes of employment.
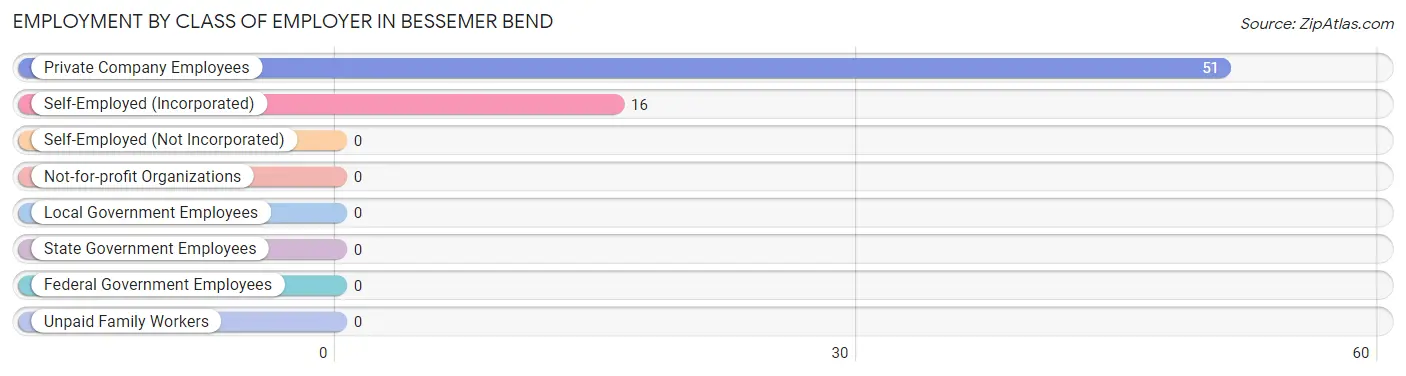
| Employer Class | # Employees | % Employees |
| Private Company Employees | 51 | 76.1% |
| Self-Employed (Incorporated) | 16 | 23.9% |
| Self-Employed (Not Incorporated) | 0 | 0.0% |
| Not-for-profit Organizations | 0 | 0.0% |
| Local Government Employees | 0 | 0.0% |
| State Government Employees | 0 | 0.0% |
| Federal Government Employees | 0 | 0.0% |
| Unpaid Family Workers | 0 | 0.0% |
| Total | 67 | 100.0% |
Employment Status by Age in Bessemer Bend
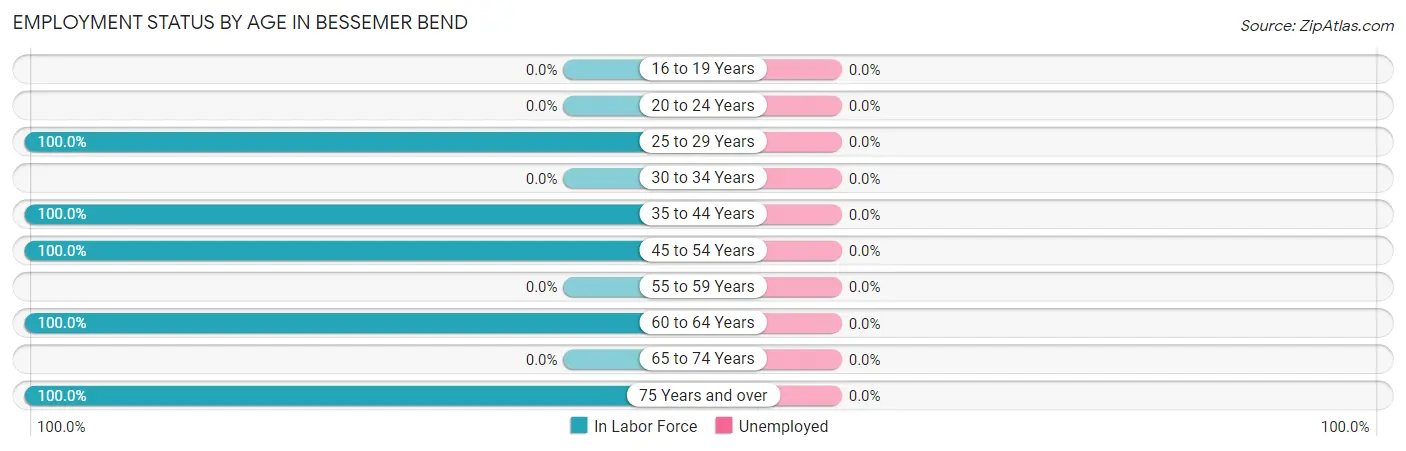
| Age Bracket | In Labor Force | Unemployed |
| 16 to 19 Years | 0 (0.0%) | 0 (0.0%) |
| 20 to 24 Years | 0 (0.0%) | 0 (0.0%) |
| 25 to 29 Years | 7 (100.0%) | 0 (0.0%) |
| 30 to 34 Years | 0 (0.0%) | 0 (0.0%) |
| 35 to 44 Years | 9 (100.0%) | 0 (0.0%) |
| 45 to 54 Years | 6 (100.0%) | 0 (0.0%) |
| 55 to 59 Years | 0 (0.0%) | 0 (0.0%) |
| 60 to 64 Years | 22 (100.0%) | 0 (0.0%) |
| 65 to 74 Years | 0 (0.0%) | 0 (0.0%) |
| 75 Years and over | 23 (100.0%) | 0 (0.0%) |
| Total | 67 (56.8%) | 0 (0.0%) |
Employment Status by Educational Attainment in Bessemer Bend
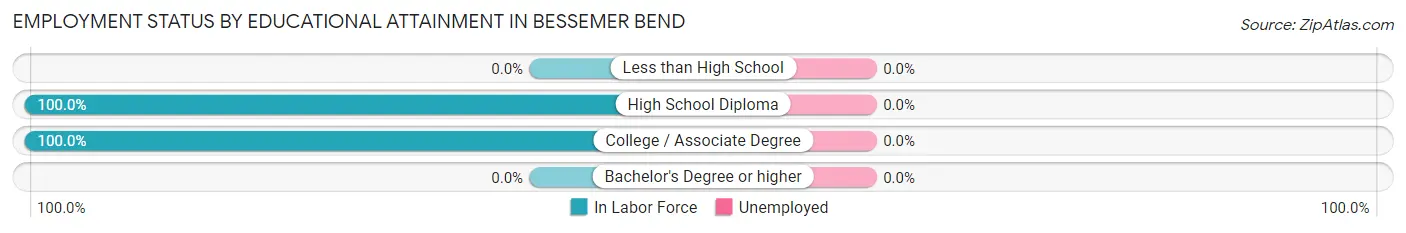
| Educational Attainment | In Labor Force | Unemployed |
| Less than High School | 0 (0.0%) | 0 (0.0%) |
| High School Diploma | 38 (100.0%) | 0 (0.0%) |
| College / Associate Degree | 6 (100.0%) | 0 (0.0%) |
| Bachelor's Degree or higher | 0 (0.0%) | 0 (0.0%) |
| Total | 44 (100.0%) | 0 (0.0%) |
Employment Occupations by Sex in Bessemer Bend
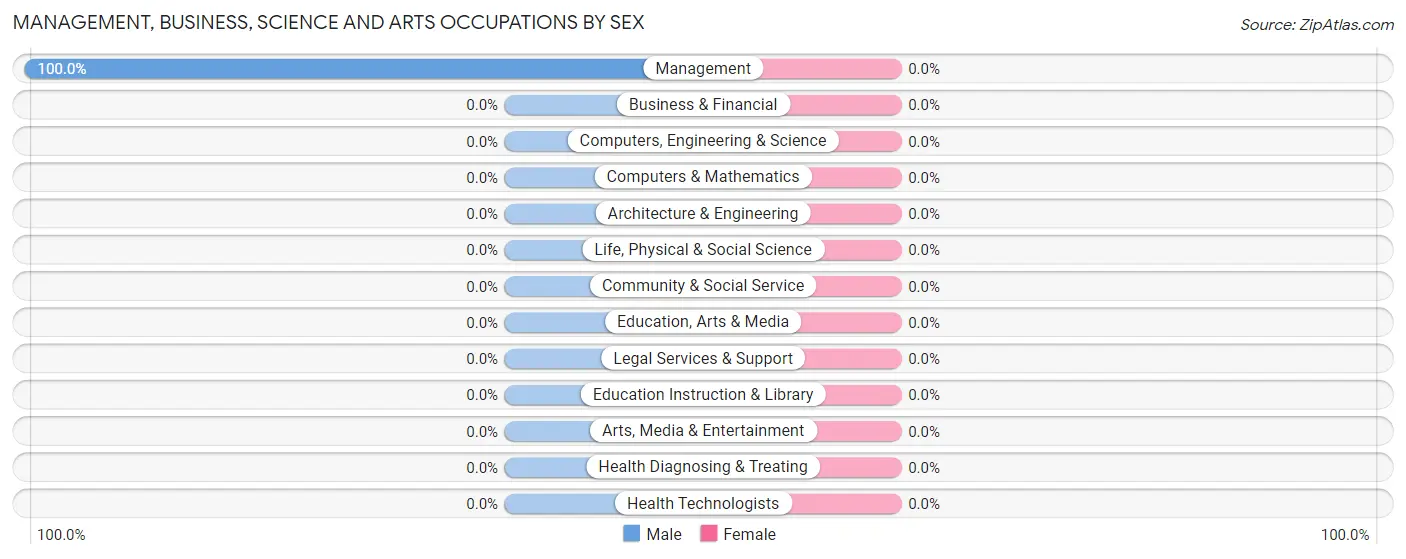
Management, Business, Science and Arts Occupations
The most common Management, Business, Science and Arts occupations in Bessemer Bend are , and Management (16 | 23.9%).
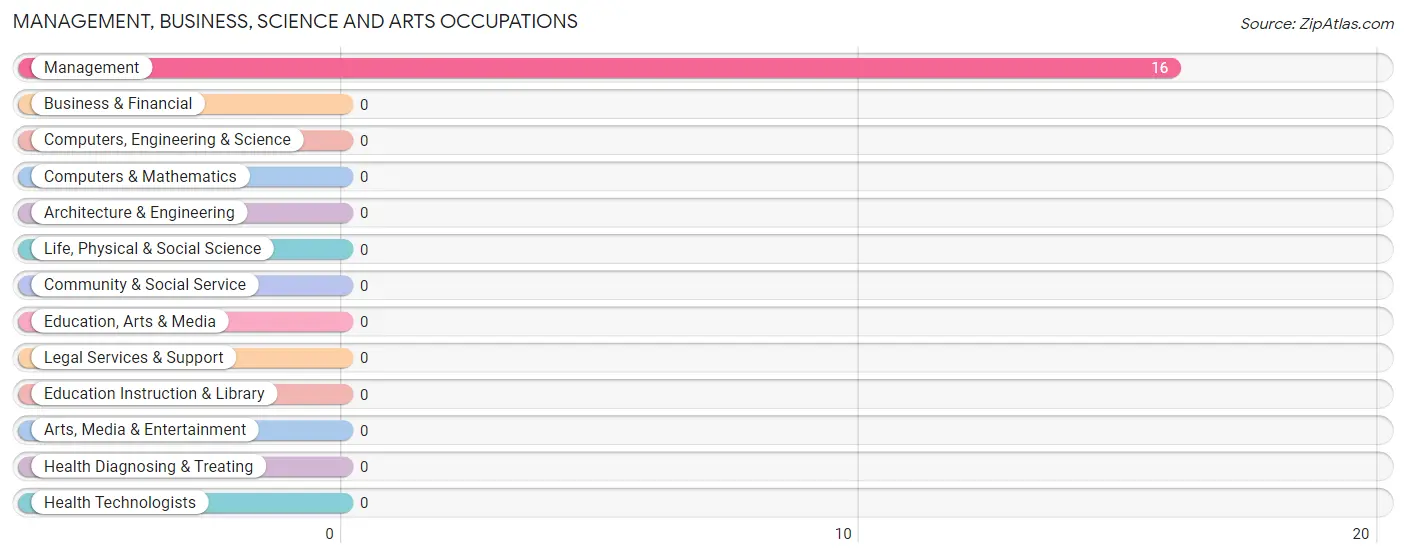
Management, Business, Science and Arts Occupations by Sex
| Occupation | Male | Female |
| Management | 16 (100.0%) | 0 (0.0%) |
| Business & Financial | 0 (0.0%) | 0 (0.0%) |
| Computers, Engineering & Science | 0 (0.0%) | 0 (0.0%) |
| Computers & Mathematics | 0 (0.0%) | 0 (0.0%) |
| Architecture & Engineering | 0 (0.0%) | 0 (0.0%) |
| Life, Physical & Social Science | 0 (0.0%) | 0 (0.0%) |
| Community & Social Service | 0 (0.0%) | 0 (0.0%) |
| Education, Arts & Media | 0 (0.0%) | 0 (0.0%) |
| Legal Services & Support | 0 (0.0%) | 0 (0.0%) |
| Education Instruction & Library | 0 (0.0%) | 0 (0.0%) |
| Arts, Media & Entertainment | 0 (0.0%) | 0 (0.0%) |
| Health Diagnosing & Treating | 0 (0.0%) | 0 (0.0%) |
| Health Technologists | 0 (0.0%) | 0 (0.0%) |
| Total (Category) | 16 (100.0%) | 0 (0.0%) |
| Total (Overall) | 61 (91.0%) | 6 (9.0%) |
Services Occupations
Services Occupations by Sex
| Occupation | Male | Female |
| Healthcare Support | 0 (0.0%) | 0 (0.0%) |
| Security & Protection | 0 (0.0%) | 0 (0.0%) |
| Firefighting & Prevention | 0 (0.0%) | 0 (0.0%) |
| Law Enforcement | 0 (0.0%) | 0 (0.0%) |
| Food Preparation & Serving | 0 (0.0%) | 0 (0.0%) |
| Cleaning & Maintenance | 0 (0.0%) | 0 (0.0%) |
| Personal Care & Service | 0 (0.0%) | 0 (0.0%) |
| Total (Category) | 0 (0.0%) | 0 (0.0%) |
| Total (Overall) | 61 (91.0%) | 6 (9.0%) |
Sales and Office Occupations
The most common Sales and Office occupations in Bessemer Bend are , and Sales & Related (37 | 55.2%).
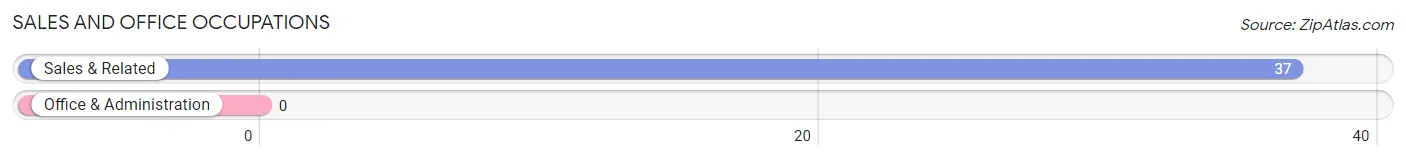
Sales and Office Occupations by Sex
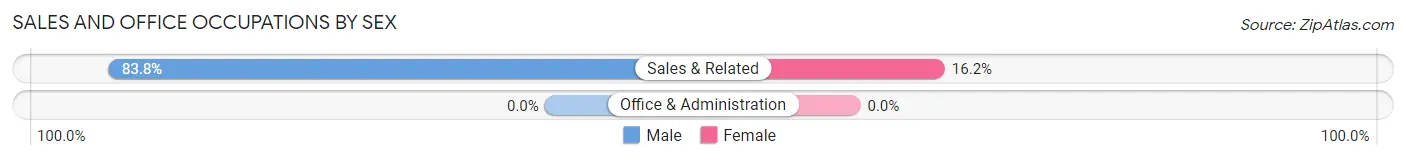
| Occupation | Male | Female |
| Sales & Related | 31 (83.8%) | 6 (16.2%) |
| Office & Administration | 0 (0.0%) | 0 (0.0%) |
| Total (Category) | 31 (83.8%) | 6 (16.2%) |
| Total (Overall) | 61 (91.0%) | 6 (9.0%) |
Natural Resources, Construction and Maintenance Occupations
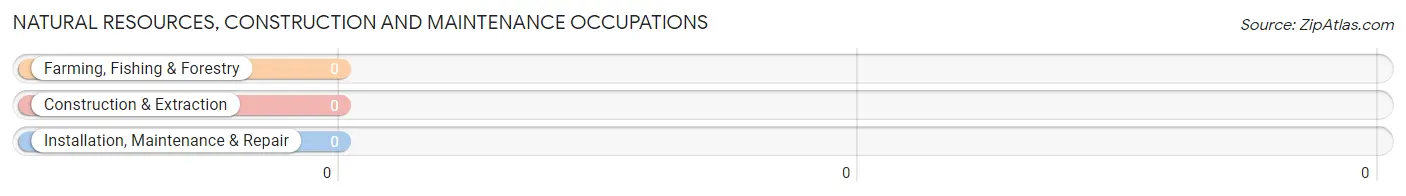
Natural Resources, Construction and Maintenance Occupations by Sex
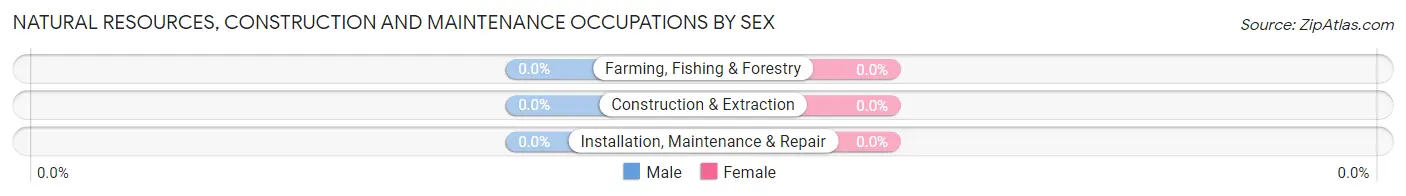
| Occupation | Male | Female |
| Farming, Fishing & Forestry | 0 (0.0%) | 0 (0.0%) |
| Construction & Extraction | 0 (0.0%) | 0 (0.0%) |
| Installation, Maintenance & Repair | 0 (0.0%) | 0 (0.0%) |
| Total (Category) | 0 (0.0%) | 0 (0.0%) |
| Total (Overall) | 61 (91.0%) | 6 (9.0%) |
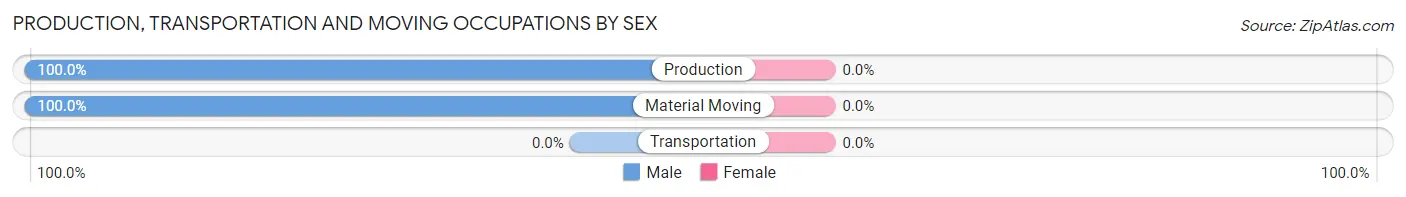
Production, Transportation and Moving Occupations
The most common Production, Transportation and Moving occupations in Bessemer Bend are Production (7 | 10.4%), and Material Moving (7 | 10.4%).
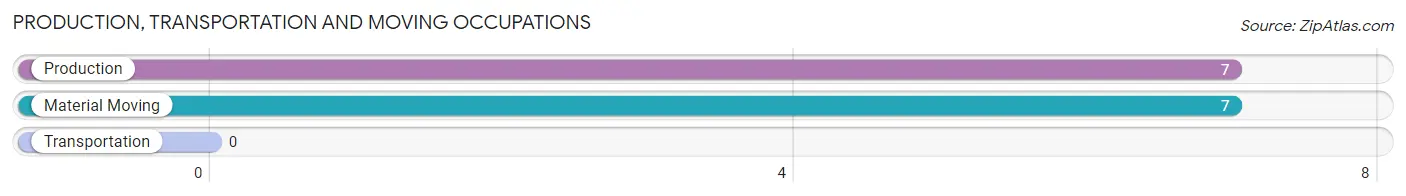
Production, Transportation and Moving Occupations by Sex
| Occupation | Male | Female |
| Production | 7 (100.0%) | 0 (0.0%) |
| Transportation | 0 (0.0%) | 0 (0.0%) |
| Material Moving | 7 (100.0%) | 0 (0.0%) |
| Total (Category) | 14 (100.0%) | 0 (0.0%) |
| Total (Overall) | 61 (91.0%) | 6 (9.0%) |
Employment Industries by Sex in Bessemer Bend
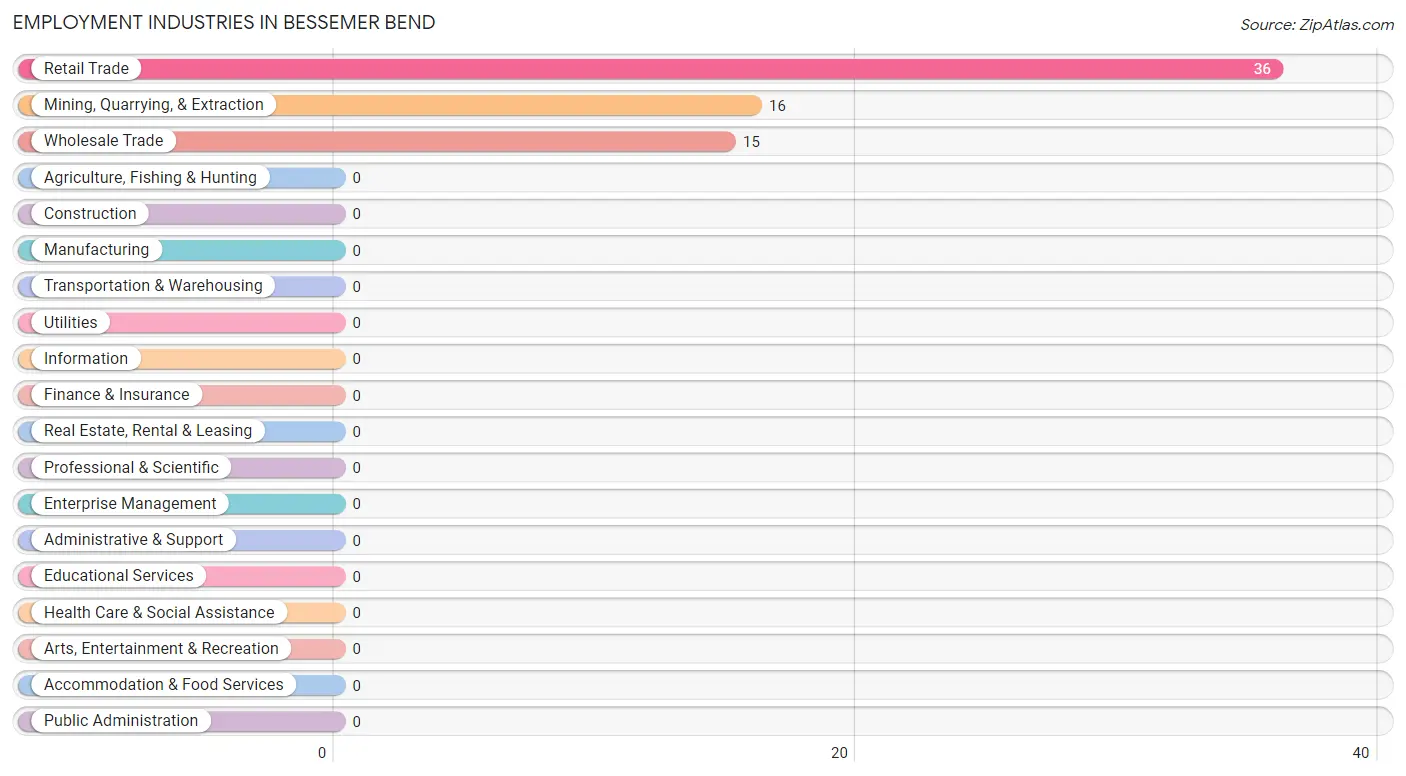
Employment Industries in Bessemer Bend
The major employment industries in Bessemer Bend include Retail Trade (36 | 53.7%), Mining, Quarrying, & Extraction (16 | 23.9%), and Wholesale Trade (15 | 22.4%).
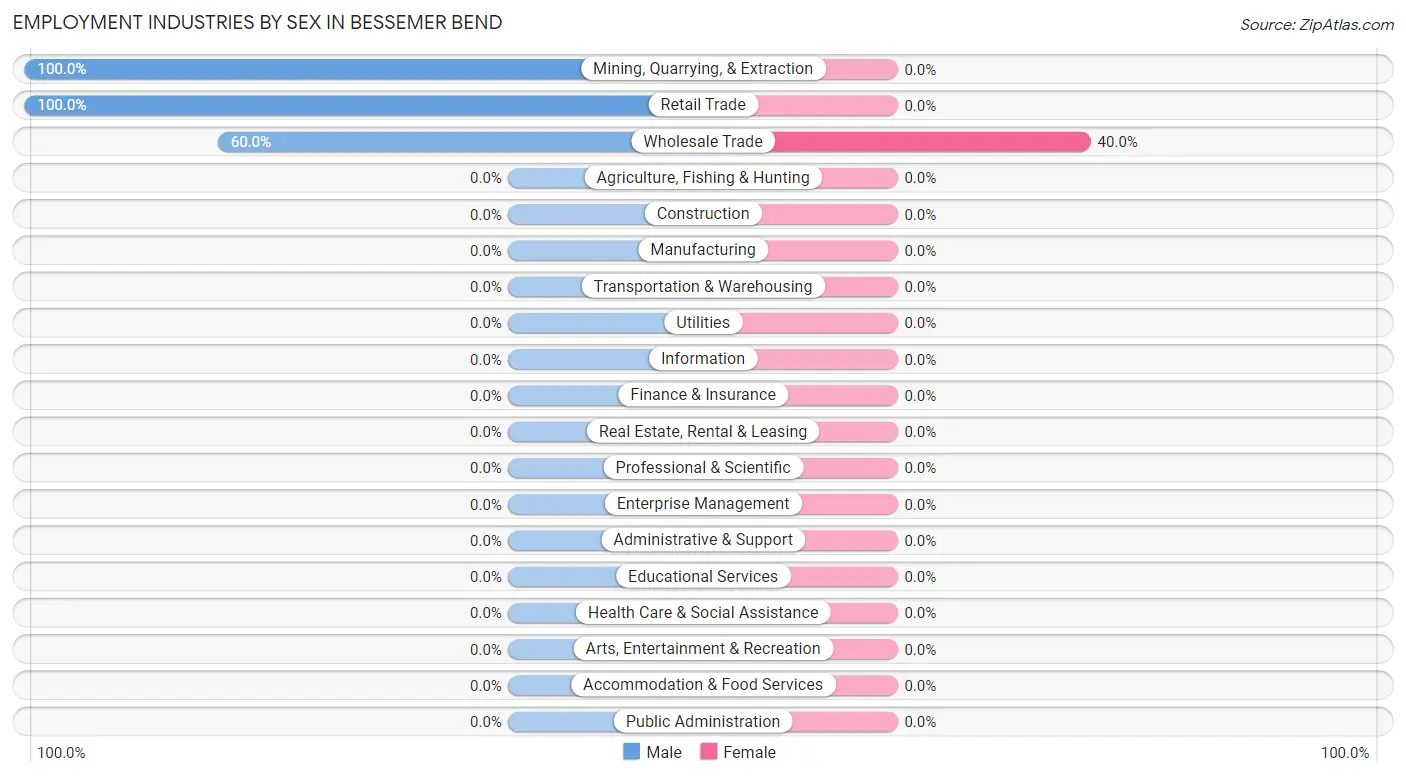
Employment Industries by Sex in Bessemer Bend
| Industry | Male | Female |
| Agriculture, Fishing & Hunting | 0 (0.0%) | 0 (0.0%) |
| Mining, Quarrying, & Extraction | 16 (100.0%) | 0 (0.0%) |
| Construction | 0 (0.0%) | 0 (0.0%) |
| Manufacturing | 0 (0.0%) | 0 (0.0%) |
| Wholesale Trade | 9 (60.0%) | 6 (40.0%) |
| Retail Trade | 36 (100.0%) | 0 (0.0%) |
| Transportation & Warehousing | 0 (0.0%) | 0 (0.0%) |
| Utilities | 0 (0.0%) | 0 (0.0%) |
| Information | 0 (0.0%) | 0 (0.0%) |
| Finance & Insurance | 0 (0.0%) | 0 (0.0%) |
| Real Estate, Rental & Leasing | 0 (0.0%) | 0 (0.0%) |
| Professional & Scientific | 0 (0.0%) | 0 (0.0%) |
| Enterprise Management | 0 (0.0%) | 0 (0.0%) |
| Administrative & Support | 0 (0.0%) | 0 (0.0%) |
| Educational Services | 0 (0.0%) | 0 (0.0%) |
| Health Care & Social Assistance | 0 (0.0%) | 0 (0.0%) |
| Arts, Entertainment & Recreation | 0 (0.0%) | 0 (0.0%) |
| Accommodation & Food Services | 0 (0.0%) | 0 (0.0%) |
| Public Administration | 0 (0.0%) | 0 (0.0%) |
| Total | 61 (91.0%) | 6 (9.0%) |
Education in Bessemer Bend
School Enrollment in Bessemer Bend
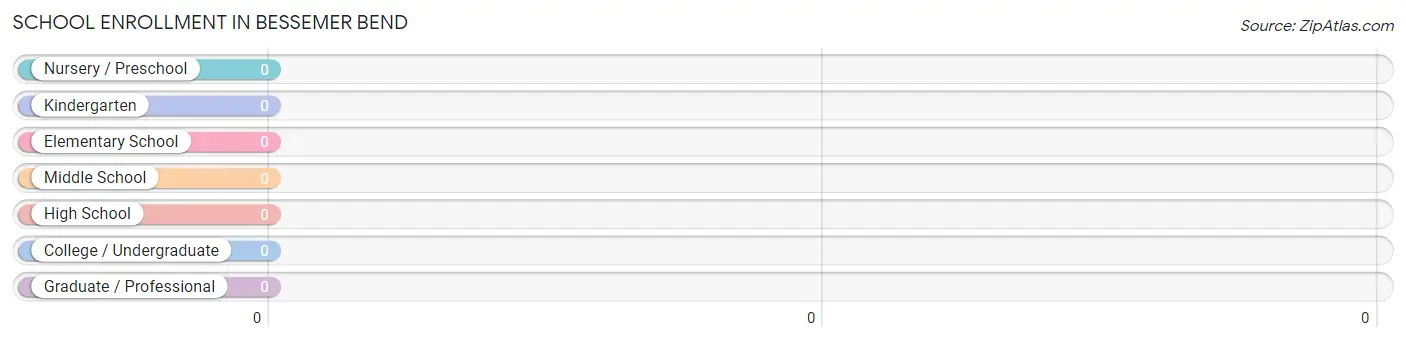
| School Level | # Students | % Students |
| Nursery / Preschool | 0 | 0.0% |
| Kindergarten | 0 | 0.0% |
| Elementary School | 0 | 0.0% |
| Middle School | 0 | 0.0% |
| High School | 0 | 0.0% |
| College / Undergraduate | 0 | 0.0% |
| Graduate / Professional | 0 | 0.0% |
| Total | 0 | 0.0% |
School Enrollment by Age by Funding Source in Bessemer Bend
| Age Bracket | Public School | Private School |
| 3 to 4 Year Olds | 0 (0.0%) | 0 (0.0%) |
| 5 to 9 Year Old | 0 (0.0%) | 0 (0.0%) |
| 10 to 14 Year Olds | 0 (0.0%) | 0 (0.0%) |
| 15 to 17 Year Olds | 0 (0.0%) | 0 (0.0%) |
| 18 to 19 Year Olds | 0 (0.0%) | 0 (0.0%) |
| 20 to 24 Year Olds | 0 (0.0%) | 0 (0.0%) |
| 25 to 34 Year Olds | 0 (0.0%) | 0 (0.0%) |
| 35 Years and over | 0 (0.0%) | 0 (0.0%) |
| Total | 0 (0.0%) | 0 (0.0%) |
Educational Attainment by Field of Study in Bessemer Bend
Business (16 | 64.0%), and physical & health sciences (9 | 36.0%) are the most common fields of study among 25 individuals in Bessemer Bend who have obtained a bachelor's degree or higher.
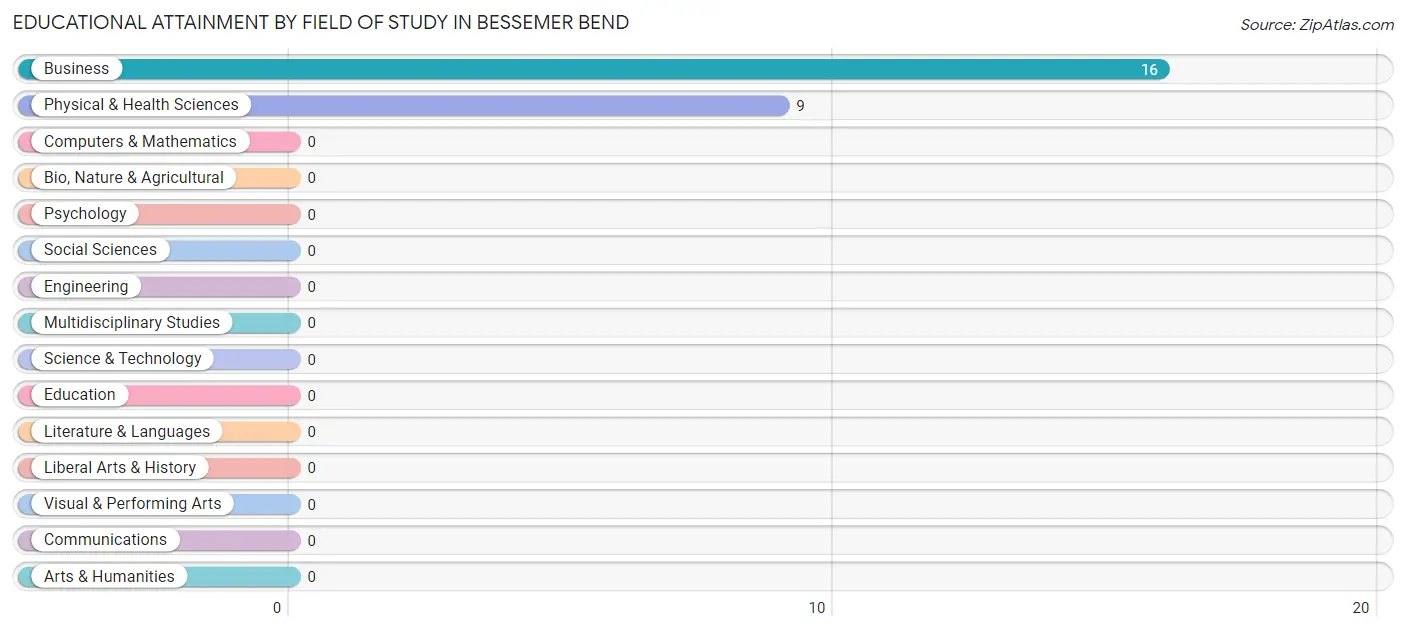
| Field of Study | # Graduates | % Graduates |
| Computers & Mathematics | 0 | 0.0% |
| Bio, Nature & Agricultural | 0 | 0.0% |
| Physical & Health Sciences | 9 | 36.0% |
| Psychology | 0 | 0.0% |
| Social Sciences | 0 | 0.0% |
| Engineering | 0 | 0.0% |
| Multidisciplinary Studies | 0 | 0.0% |
| Science & Technology | 0 | 0.0% |
| Business | 16 | 64.0% |
| Education | 0 | 0.0% |
| Literature & Languages | 0 | 0.0% |
| Liberal Arts & History | 0 | 0.0% |
| Visual & Performing Arts | 0 | 0.0% |
| Communications | 0 | 0.0% |
| Arts & Humanities | 0 | 0.0% |
| Total | 25 | 100.0% |
Transportation & Commute in Bessemer Bend
Vehicle Availability by Sex in Bessemer Bend
The most prevalent vehicle ownership categories in Bessemer Bend are males with 2 vehicles (38, accounting for 62.3%) and females with 2 vehicles (0, making up 633.3%).
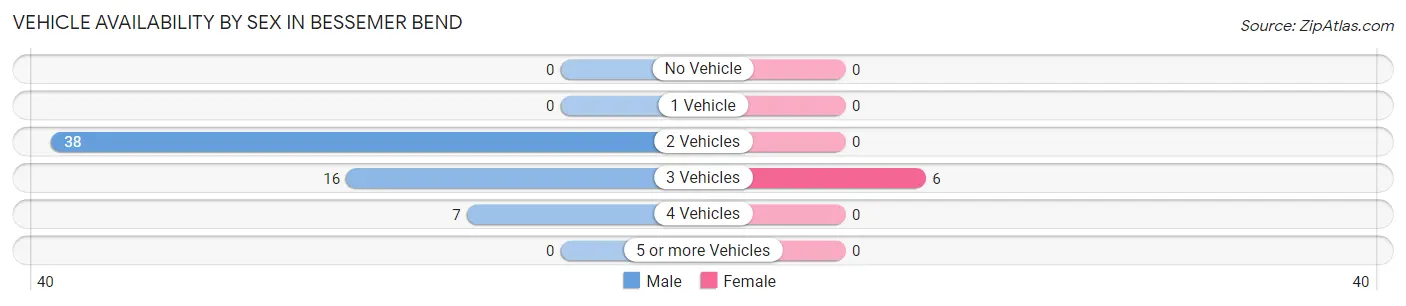
| Vehicles Available | Male | Female |
| No Vehicle | 0 (0.0%) | 0 (0.0%) |
| 1 Vehicle | 0 (0.0%) | 0 (0.0%) |
| 2 Vehicles | 38 (62.3%) | 0 (0.0%) |
| 3 Vehicles | 16 (26.2%) | 6 (100.0%) |
| 4 Vehicles | 7 (11.5%) | 0 (0.0%) |
| 5 or more Vehicles | 0 (0.0%) | 0 (0.0%) |
| Total | 61 (100.0%) | 6 (100.0%) |
Commute Time in Bessemer Bend
The most frequently occuring commute durations in Bessemer Bend are 25 to 29 minutes (22 commuters, 32.8%), 20 to 24 minutes (16 commuters, 23.9%), and 30 to 34 minutes (14 commuters, 20.9%).
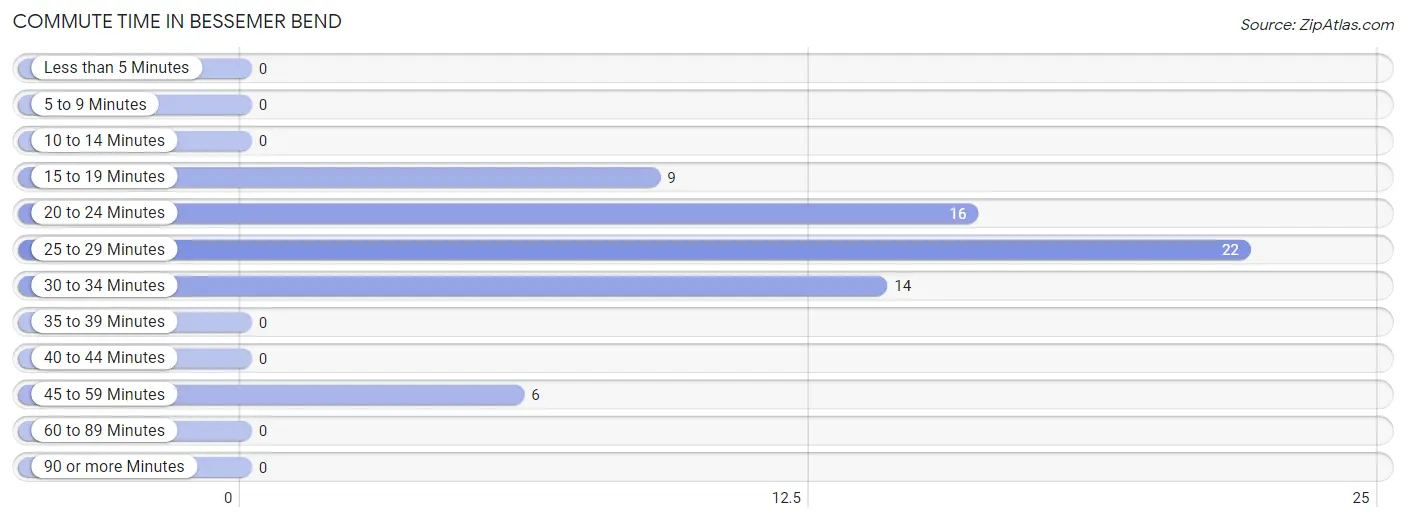
| Commute Time | # Commuters | % Commuters |
| Less than 5 Minutes | 0 | 0.0% |
| 5 to 9 Minutes | 0 | 0.0% |
| 10 to 14 Minutes | 0 | 0.0% |
| 15 to 19 Minutes | 9 | 13.4% |
| 20 to 24 Minutes | 16 | 23.9% |
| 25 to 29 Minutes | 22 | 32.8% |
| 30 to 34 Minutes | 14 | 20.9% |
| 35 to 39 Minutes | 0 | 0.0% |
| 40 to 44 Minutes | 0 | 0.0% |
| 45 to 59 Minutes | 6 | 9.0% |
| 60 to 89 Minutes | 0 | 0.0% |
| 90 or more Minutes | 0 | 0.0% |
Commute Time by Sex in Bessemer Bend
The most common commute times in Bessemer Bend are 25 to 29 minutes (22 commuters, 36.1%) for males and 45 to 59 minutes (6 commuters, 100.0%) for females.
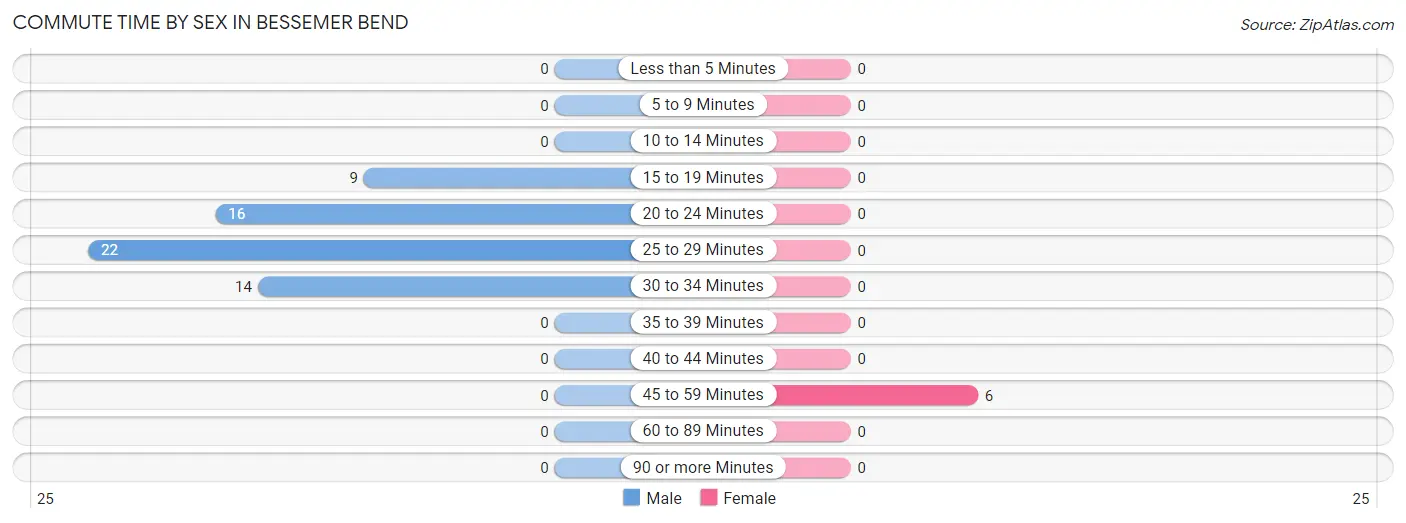
| Commute Time | Male | Female |
| Less than 5 Minutes | 0 (0.0%) | 0 (0.0%) |
| 5 to 9 Minutes | 0 (0.0%) | 0 (0.0%) |
| 10 to 14 Minutes | 0 (0.0%) | 0 (0.0%) |
| 15 to 19 Minutes | 9 (14.7%) | 0 (0.0%) |
| 20 to 24 Minutes | 16 (26.2%) | 0 (0.0%) |
| 25 to 29 Minutes | 22 (36.1%) | 0 (0.0%) |
| 30 to 34 Minutes | 14 (23.0%) | 0 (0.0%) |
| 35 to 39 Minutes | 0 (0.0%) | 0 (0.0%) |
| 40 to 44 Minutes | 0 (0.0%) | 0 (0.0%) |
| 45 to 59 Minutes | 0 (0.0%) | 6 (100.0%) |
| 60 to 89 Minutes | 0 (0.0%) | 0 (0.0%) |
| 90 or more Minutes | 0 (0.0%) | 0 (0.0%) |
Time of Departure to Work by Sex in Bessemer Bend
The most frequent times of departure to work in Bessemer Bend are 7:30 AM to 7:59 AM (45, 73.8%) for males and 7:00 AM to 7:29 AM (6, 100.0%) for females.
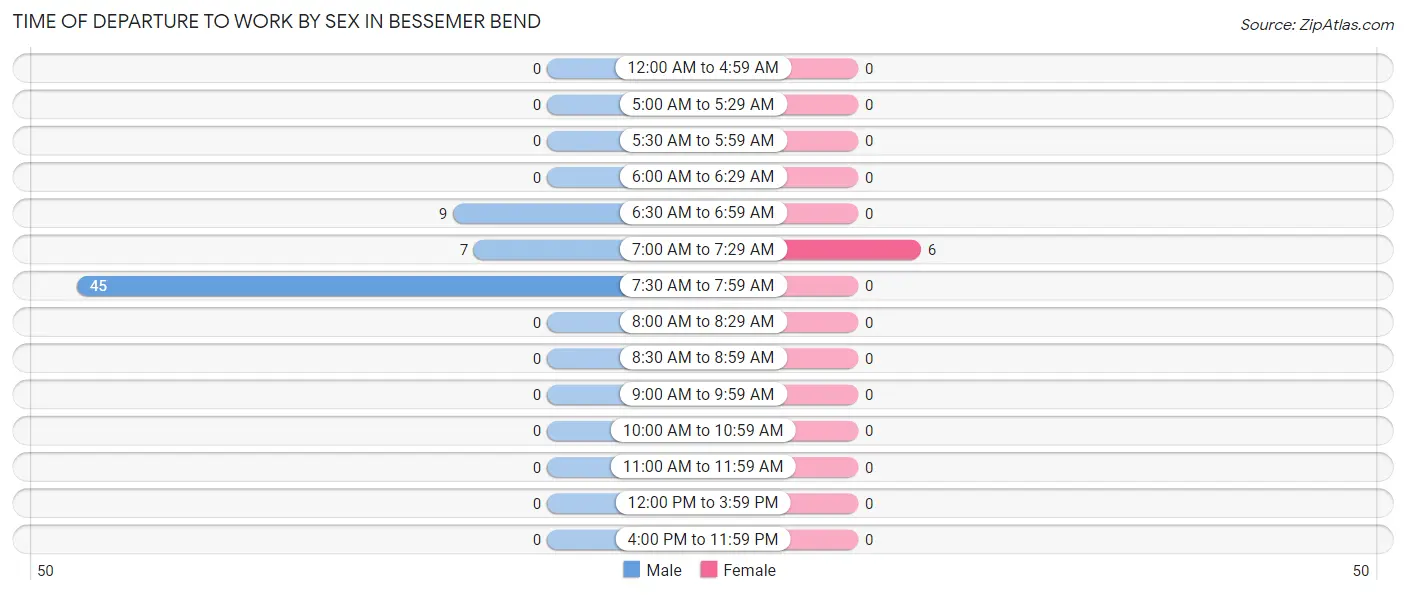
| Time of Departure | Male | Female |
| 12:00 AM to 4:59 AM | 0 (0.0%) | 0 (0.0%) |
| 5:00 AM to 5:29 AM | 0 (0.0%) | 0 (0.0%) |
| 5:30 AM to 5:59 AM | 0 (0.0%) | 0 (0.0%) |
| 6:00 AM to 6:29 AM | 0 (0.0%) | 0 (0.0%) |
| 6:30 AM to 6:59 AM | 9 (14.7%) | 0 (0.0%) |
| 7:00 AM to 7:29 AM | 7 (11.5%) | 6 (100.0%) |
| 7:30 AM to 7:59 AM | 45 (73.8%) | 0 (0.0%) |
| 8:00 AM to 8:29 AM | 0 (0.0%) | 0 (0.0%) |
| 8:30 AM to 8:59 AM | 0 (0.0%) | 0 (0.0%) |
| 9:00 AM to 9:59 AM | 0 (0.0%) | 0 (0.0%) |
| 10:00 AM to 10:59 AM | 0 (0.0%) | 0 (0.0%) |
| 11:00 AM to 11:59 AM | 0 (0.0%) | 0 (0.0%) |
| 12:00 PM to 3:59 PM | 0 (0.0%) | 0 (0.0%) |
| 4:00 PM to 11:59 PM | 0 (0.0%) | 0 (0.0%) |
| Total | 61 (100.0%) | 6 (100.0%) |
Housing Occupancy in Bessemer Bend
Occupancy by Ownership in Bessemer Bend
Of the total 65 dwellings in Bessemer Bend, owner-occupied units account for 65 (100.0%), while renter-occupied units make up 0 (0.0%).
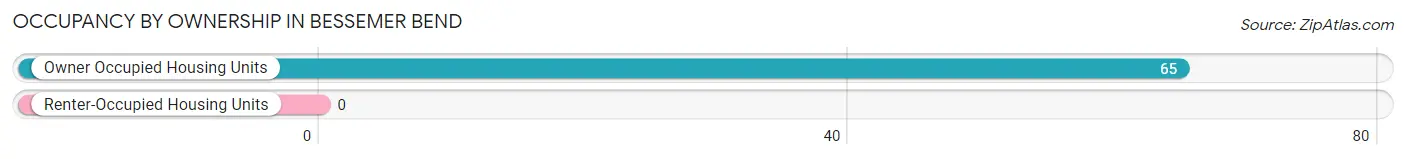
| Occupancy | # Housing Units | % Housing Units |
| Owner Occupied Housing Units | 65 | 100.0% |
| Renter-Occupied Housing Units | 0 | 0.0% |
| Total Occupied Housing Units | 65 | 100.0% |
Occupancy by Household Size in Bessemer Bend
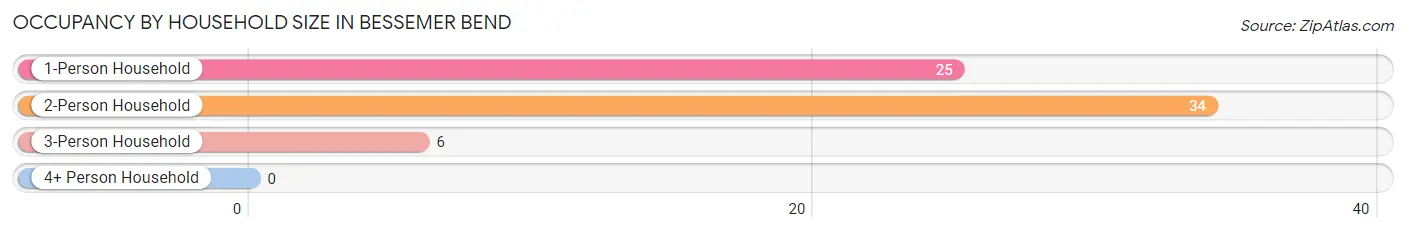
| Household Size | # Housing Units | % Housing Units |
| 1-Person Household | 25 | 38.5% |
| 2-Person Household | 34 | 52.3% |
| 3-Person Household | 6 | 9.2% |
| 4+ Person Household | 0 | 0.0% |
| Total Housing Units | 65 | 100.0% |
Occupancy by Ownership by Household Size in Bessemer Bend
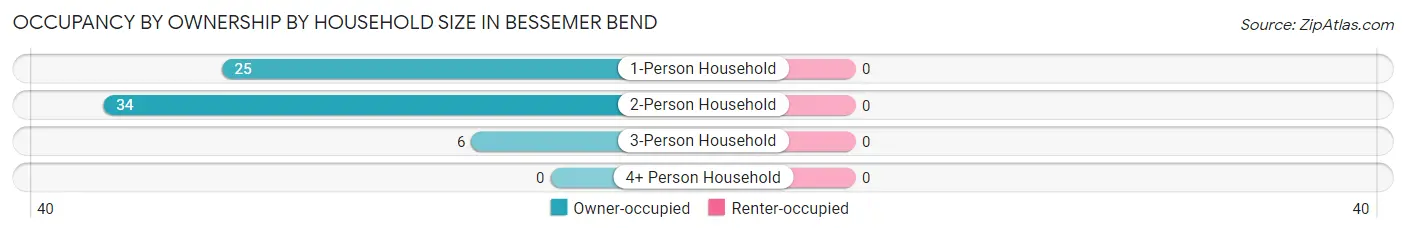
| Household Size | Owner-occupied | Renter-occupied |
| 1-Person Household | 25 (100.0%) | 0 (0.0%) |
| 2-Person Household | 34 (100.0%) | 0 (0.0%) |
| 3-Person Household | 6 (100.0%) | 0 (0.0%) |
| 4+ Person Household | 0 (0.0%) | 0 (0.0%) |
| Total Housing Units | 65 (100.0%) | 0 (0.0%) |
Occupancy by Educational Attainment in Bessemer Bend
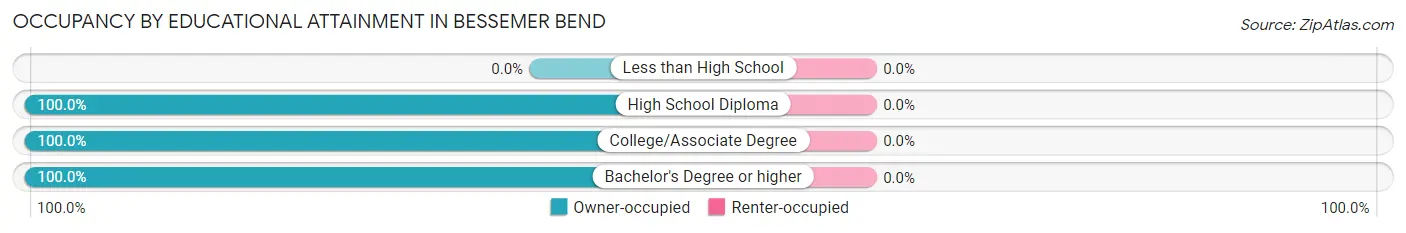
| Household Size | Owner-occupied | Renter-occupied |
| Less than High School | 0 (0.0%) | 0 (0.0%) |
| High School Diploma | 34 (100.0%) | 0 (0.0%) |
| College/Associate Degree | 6 (100.0%) | 0 (0.0%) |
| Bachelor's Degree or higher | 25 (100.0%) | 0 (0.0%) |
Occupancy by Age of Householder in Bessemer Bend
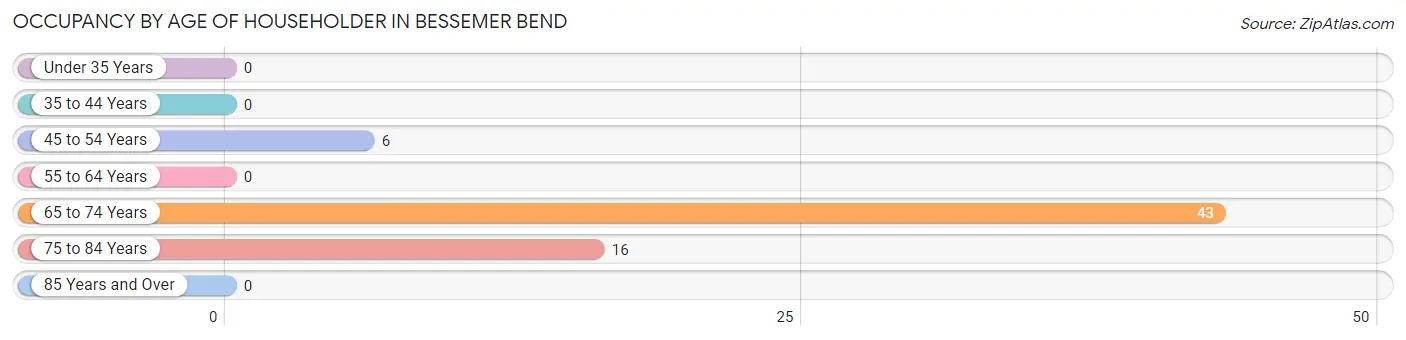
| Age Bracket | # Households | % Households |
| Under 35 Years | 0 | 0.0% |
| 35 to 44 Years | 0 | 0.0% |
| 45 to 54 Years | 6 | 9.2% |
| 55 to 64 Years | 0 | 0.0% |
| 65 to 74 Years | 43 | 66.1% |
| 75 to 84 Years | 16 | 24.6% |
| 85 Years and Over | 0 | 0.0% |
| Total | 65 | 100.0% |
Housing Finances in Bessemer Bend
Median Income by Occupancy in Bessemer Bend
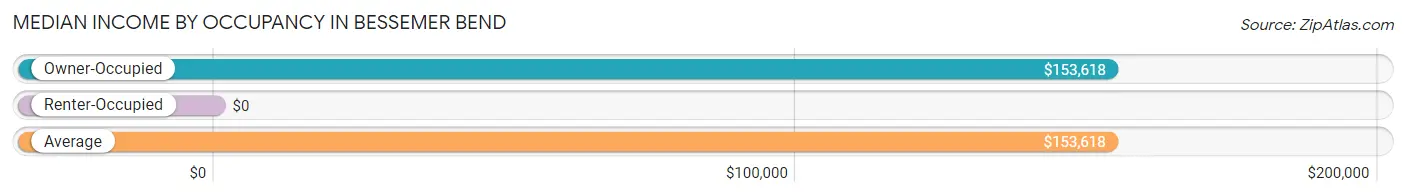
| Occupancy Type | # Households | Median Income |
| Owner-Occupied | 65 (100.0%) | $153,618 |
| Renter-Occupied | 0 (0.0%) | $0 |
| Average | 65 (100.0%) | $153,618 |
Occupancy by Householder Income Bracket in Bessemer Bend
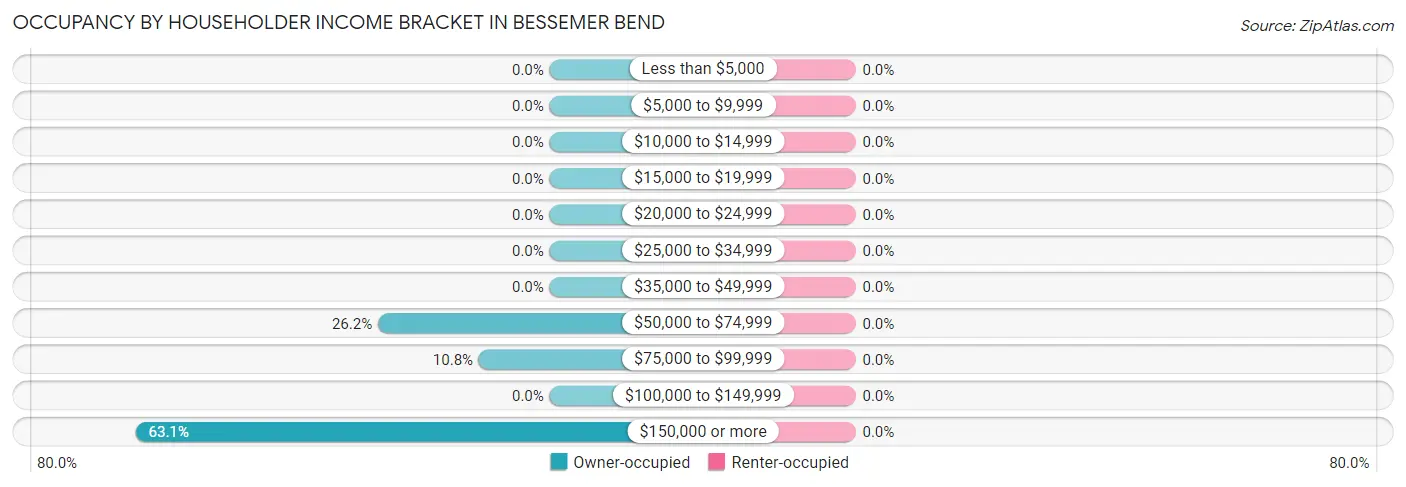
| Income Bracket | Owner-occupied | Renter-occupied |
| Less than $5,000 | 0 (0.0%) | 0 (0.0%) |
| $5,000 to $9,999 | 0 (0.0%) | 0 (0.0%) |
| $10,000 to $14,999 | 0 (0.0%) | 0 (0.0%) |
| $15,000 to $19,999 | 0 (0.0%) | 0 (0.0%) |
| $20,000 to $24,999 | 0 (0.0%) | 0 (0.0%) |
| $25,000 to $34,999 | 0 (0.0%) | 0 (0.0%) |
| $35,000 to $49,999 | 0 (0.0%) | 0 (0.0%) |
| $50,000 to $74,999 | 17 (26.2%) | 0 (0.0%) |
| $75,000 to $99,999 | 7 (10.8%) | 0 (0.0%) |
| $100,000 to $149,999 | 0 (0.0%) | 0 (0.0%) |
| $150,000 or more | 41 (63.1%) | 0 (0.0%) |
| Total | 65 (100.0%) | 0 (0.0%) |
Monthly Housing Cost Tiers in Bessemer Bend
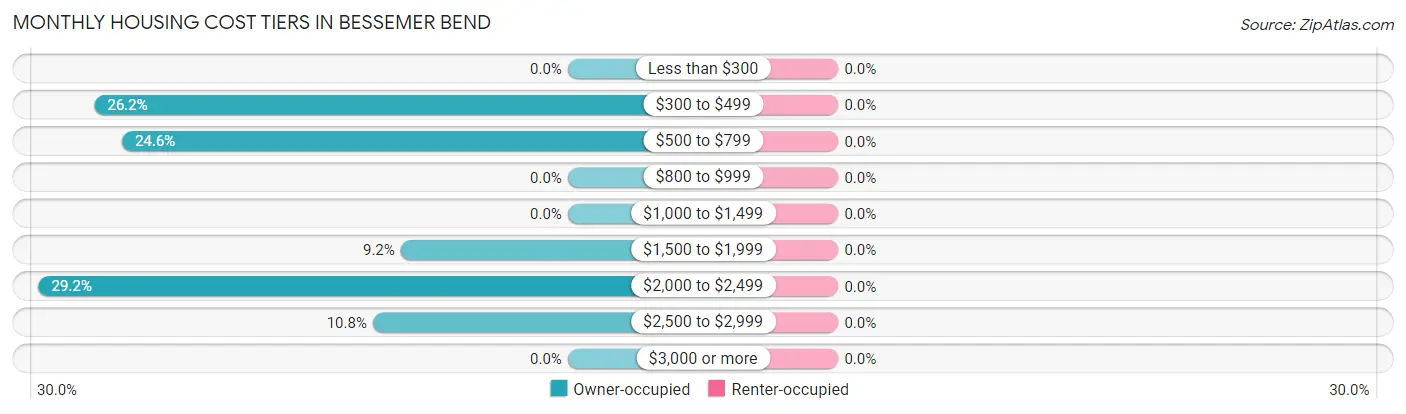
| Monthly Cost | Owner-occupied | Renter-occupied |
| Less than $300 | 0 (0.0%) | 0 (0.0%) |
| $300 to $499 | 17 (26.2%) | 0 (0.0%) |
| $500 to $799 | 16 (24.6%) | 0 (0.0%) |
| $800 to $999 | 0 (0.0%) | 0 (0.0%) |
| $1,000 to $1,499 | 0 (0.0%) | 0 (0.0%) |
| $1,500 to $1,999 | 6 (9.2%) | 0 (0.0%) |
| $2,000 to $2,499 | 19 (29.2%) | 0 (0.0%) |
| $2,500 to $2,999 | 7 (10.8%) | 0 (0.0%) |
| $3,000 or more | 0 (0.0%) | 0 (0.0%) |
| Total | 65 (100.0%) | 0 (0.0%) |
Physical Housing Characteristics in Bessemer Bend
Housing Structures in Bessemer Bend
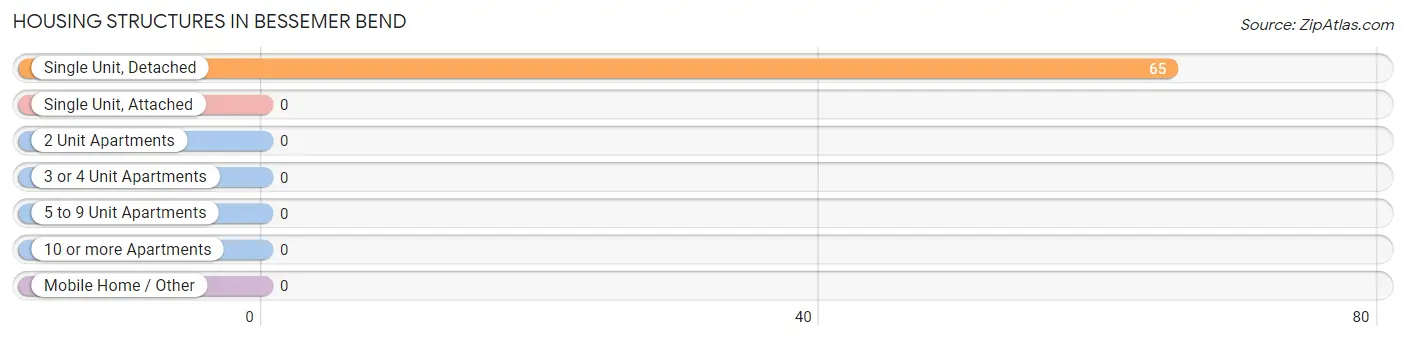
| Structure Type | # Housing Units | % Housing Units |
| Single Unit, Detached | 65 | 100.0% |
| Single Unit, Attached | 0 | 0.0% |
| 2 Unit Apartments | 0 | 0.0% |
| 3 or 4 Unit Apartments | 0 | 0.0% |
| 5 to 9 Unit Apartments | 0 | 0.0% |
| 10 or more Apartments | 0 | 0.0% |
| Mobile Home / Other | 0 | 0.0% |
| Total | 65 | 100.0% |
Housing Structures by Occupancy in Bessemer Bend
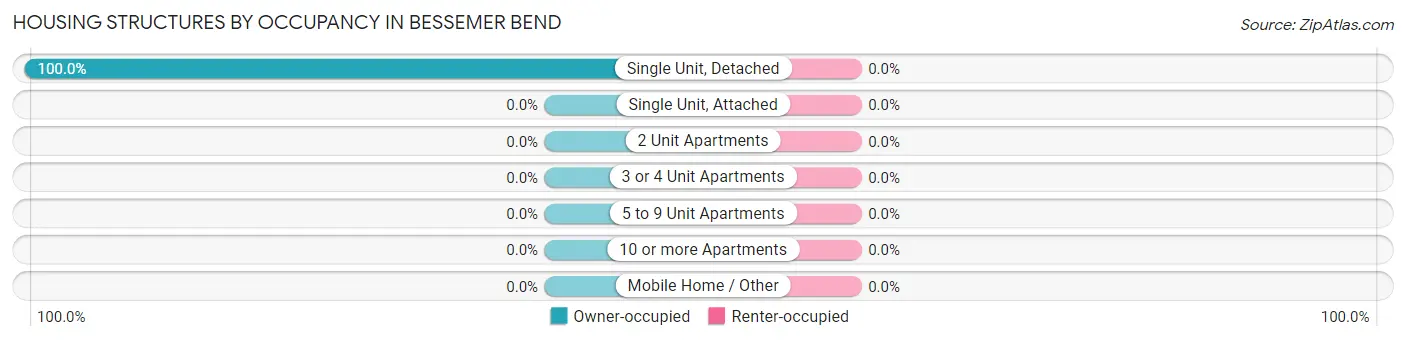
| Structure Type | Owner-occupied | Renter-occupied |
| Single Unit, Detached | 65 (100.0%) | 0 (0.0%) |
| Single Unit, Attached | 0 (0.0%) | 0 (0.0%) |
| 2 Unit Apartments | 0 (0.0%) | 0 (0.0%) |
| 3 or 4 Unit Apartments | 0 (0.0%) | 0 (0.0%) |
| 5 to 9 Unit Apartments | 0 (0.0%) | 0 (0.0%) |
| 10 or more Apartments | 0 (0.0%) | 0 (0.0%) |
| Mobile Home / Other | 0 (0.0%) | 0 (0.0%) |
| Total | 65 (100.0%) | 0 (0.0%) |
Housing Structures by Number of Rooms in Bessemer Bend
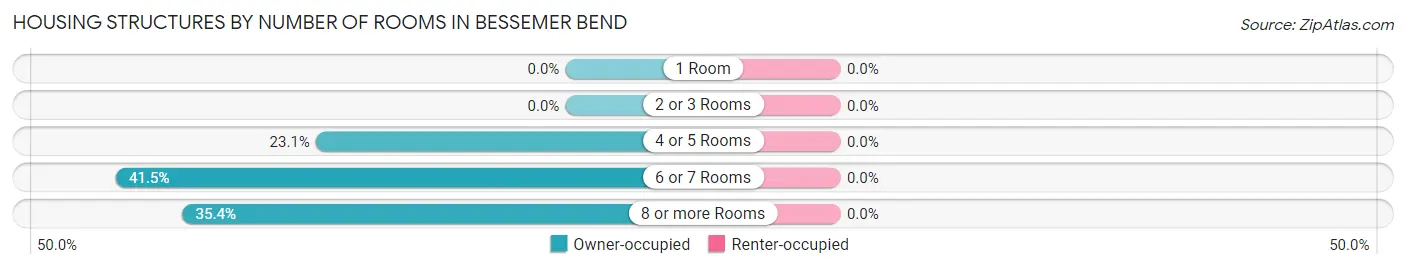
| Number of Rooms | Owner-occupied | Renter-occupied |
| 1 Room | 0 (0.0%) | 0 (0.0%) |
| 2 or 3 Rooms | 0 (0.0%) | 0 (0.0%) |
| 4 or 5 Rooms | 15 (23.1%) | 0 (0.0%) |
| 6 or 7 Rooms | 27 (41.5%) | 0 (0.0%) |
| 8 or more Rooms | 23 (35.4%) | 0 (0.0%) |
| Total | 65 (100.0%) | 0 (0.0%) |
Housing Structure by Heating Type in Bessemer Bend
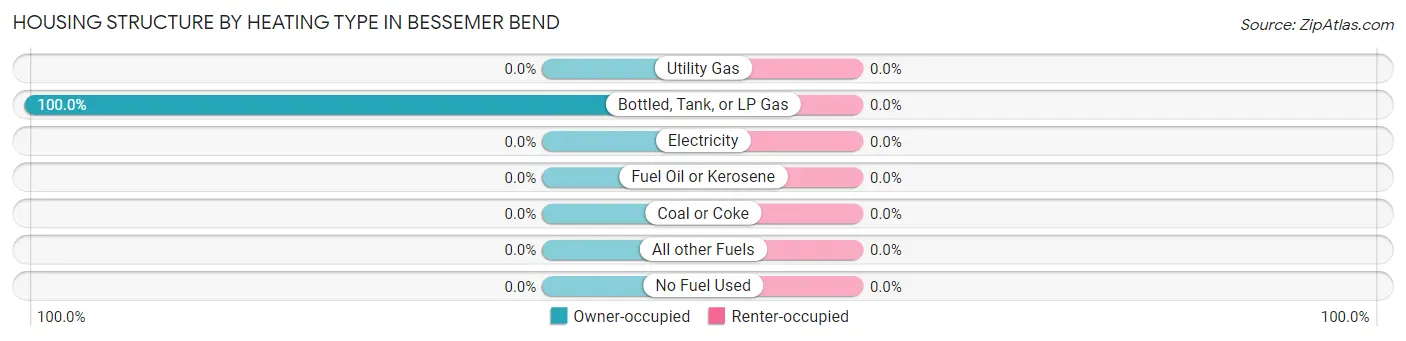
| Heating Type | Owner-occupied | Renter-occupied |
| Utility Gas | 0 (0.0%) | 0 (0.0%) |
| Bottled, Tank, or LP Gas | 65 (100.0%) | 0 (0.0%) |
| Electricity | 0 (0.0%) | 0 (0.0%) |
| Fuel Oil or Kerosene | 0 (0.0%) | 0 (0.0%) |
| Coal or Coke | 0 (0.0%) | 0 (0.0%) |
| All other Fuels | 0 (0.0%) | 0 (0.0%) |
| No Fuel Used | 0 (0.0%) | 0 (0.0%) |
| Total | 65 (100.0%) | 0 (0.0%) |
Household Vehicle Usage in Bessemer Bend
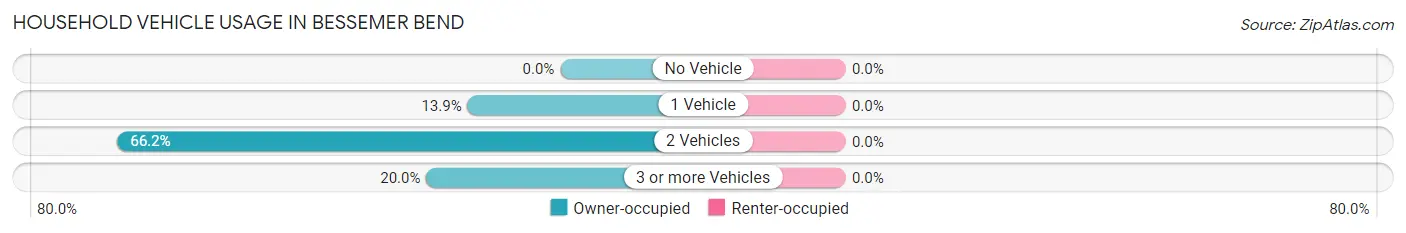
| Vehicles per Household | Owner-occupied | Renter-occupied |
| No Vehicle | 0 (0.0%) | 0 (0.0%) |
| 1 Vehicle | 9 (13.9%) | 0 (0.0%) |
| 2 Vehicles | 43 (66.1%) | 0 (0.0%) |
| 3 or more Vehicles | 13 (20.0%) | 0 (0.0%) |
| Total | 65 (100.0%) | 0 (0.0%) |
Real Estate & Mortgages in Bessemer Bend
Real Estate and Mortgage Overview in Bessemer Bend
| Characteristic | Without Mortgage | With Mortgage |
| Housing Units | 33 | 32 |
| Median Property Value | $431,300 | $352,600 |
| Median Household Income | - | - |
| Monthly Housing Costs | $497 | $0 |
| Real Estate Taxes | $2,313 | $0 |
Property Value by Mortgage Status in Bessemer Bend
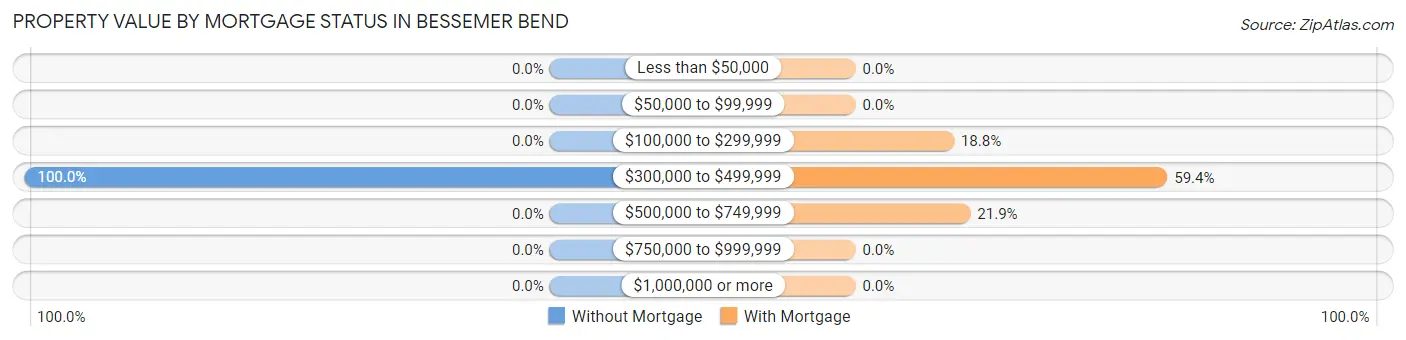
| Property Value | Without Mortgage | With Mortgage |
| Less than $50,000 | 0 (0.0%) | 0 (0.0%) |
| $50,000 to $99,999 | 0 (0.0%) | 0 (0.0%) |
| $100,000 to $299,999 | 0 (0.0%) | 6 (18.8%) |
| $300,000 to $499,999 | 33 (100.0%) | 19 (59.4%) |
| $500,000 to $749,999 | 0 (0.0%) | 7 (21.9%) |
| $750,000 to $999,999 | 0 (0.0%) | 0 (0.0%) |
| $1,000,000 or more | 0 (0.0%) | 0 (0.0%) |
| Total | 33 (100.0%) | 32 (100.0%) |
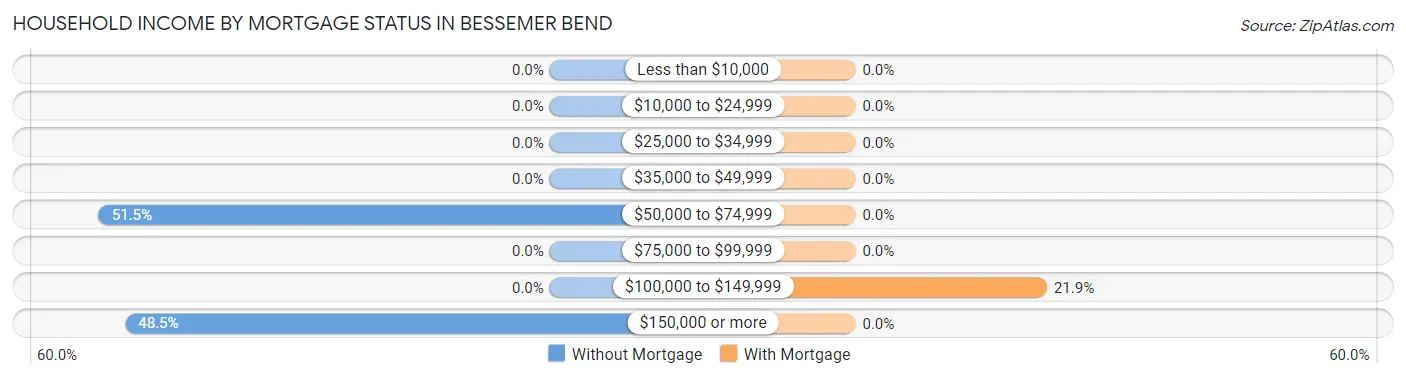
Household Income by Mortgage Status in Bessemer Bend
| Household Income | Without Mortgage | With Mortgage |
| Less than $10,000 | 0 (0.0%) | 0 (0.0%) |
| $10,000 to $24,999 | 0 (0.0%) | 0 (0.0%) |
| $25,000 to $34,999 | 0 (0.0%) | 0 (0.0%) |
| $35,000 to $49,999 | 0 (0.0%) | 0 (0.0%) |
| $50,000 to $74,999 | 17 (51.5%) | 0 (0.0%) |
| $75,000 to $99,999 | 0 (0.0%) | 0 (0.0%) |
| $100,000 to $149,999 | 0 (0.0%) | 7 (21.9%) |
| $150,000 or more | 16 (48.5%) | 0 (0.0%) |
| Total | 33 (100.0%) | 32 (100.0%) |
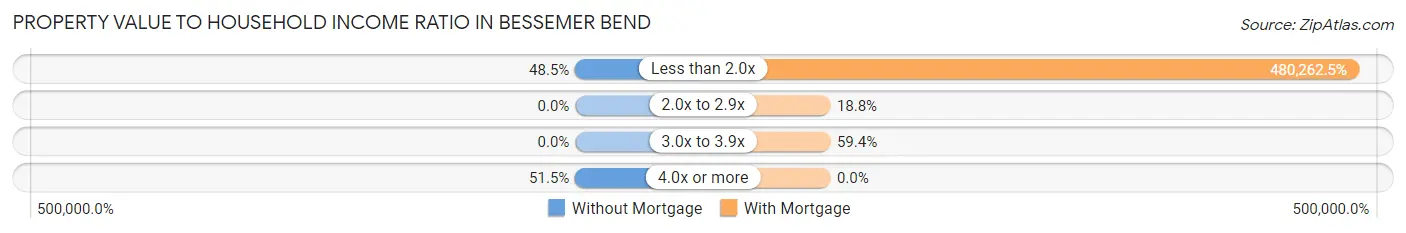
Property Value to Household Income Ratio in Bessemer Bend
| Value-to-Income Ratio | Without Mortgage | With Mortgage |
| Less than 2.0x | 16 (48.5%) | 153,684 (480,262.5%) |
| 2.0x to 2.9x | 0 (0.0%) | 6 (18.8%) |
| 3.0x to 3.9x | 0 (0.0%) | 19 (59.4%) |
| 4.0x or more | 17 (51.5%) | 0 (0.0%) |
| Total | 33 (100.0%) | 32 (100.0%) |
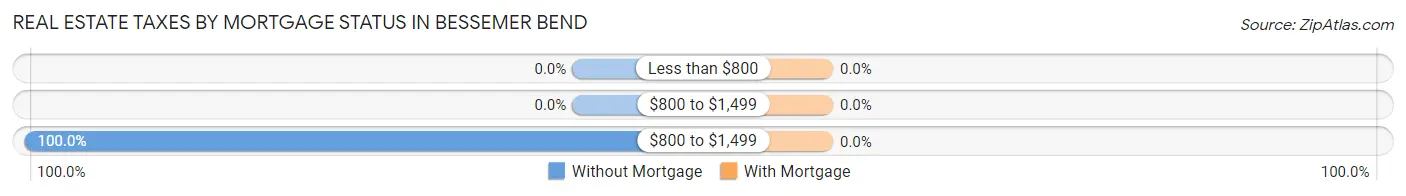
Real Estate Taxes by Mortgage Status in Bessemer Bend
| Property Taxes | Without Mortgage | With Mortgage |
| Less than $800 | 0 (0.0%) | 0 (0.0%) |
| $800 to $1,499 | 0 (0.0%) | 0 (0.0%) |
| $800 to $1,499 | 33 (100.0%) | 0 (0.0%) |
| Total | 33 (100.0%) | 32 (100.0%) |
Health & Disability in Bessemer Bend
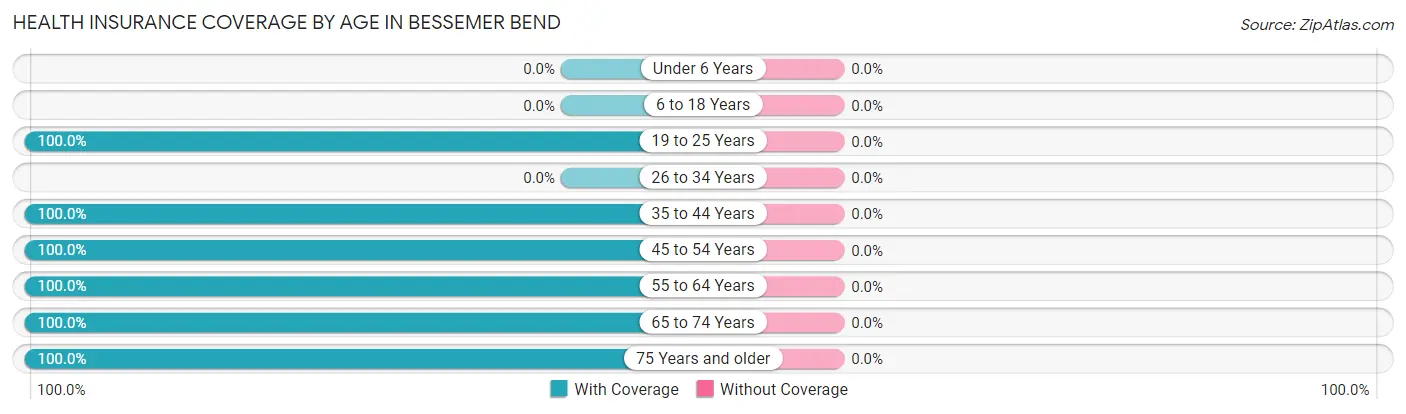
Health Insurance Coverage by Age in Bessemer Bend
| Age Bracket | With Coverage | Without Coverage |
| Under 6 Years | 0 (0.0%) | 0 (0.0%) |
| 6 to 18 Years | 0 (0.0%) | 0 (0.0%) |
| 19 to 25 Years | 7 (100.0%) | 0 (0.0%) |
| 26 to 34 Years | 0 (0.0%) | 0 (0.0%) |
| 35 to 44 Years | 9 (100.0%) | 0 (0.0%) |
| 45 to 54 Years | 6 (100.0%) | 0 (0.0%) |
| 55 to 64 Years | 22 (100.0%) | 0 (0.0%) |
| 65 to 74 Years | 51 (100.0%) | 0 (0.0%) |
| 75 Years and older | 23 (100.0%) | 0 (0.0%) |
| Total | 118 (100.0%) | 0 (0.0%) |
Health Insurance Coverage by Citizenship Status in Bessemer Bend
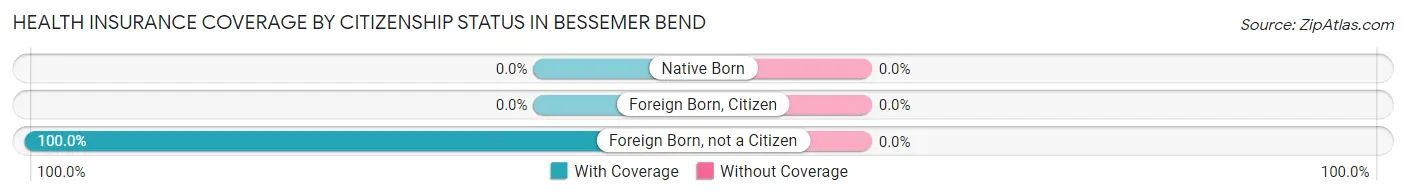
| Citizenship Status | With Coverage | Without Coverage |
| Native Born | 0 (0.0%) | 0 (0.0%) |
| Foreign Born, Citizen | 0 (0.0%) | 0 (0.0%) |
| Foreign Born, not a Citizen | 7 (100.0%) | 0 (0.0%) |
Health Insurance Coverage by Household Income in Bessemer Bend
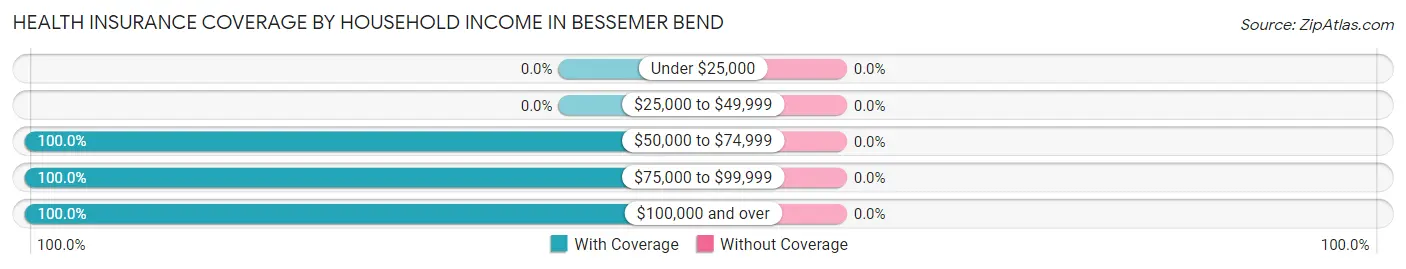
| Household Income | With Coverage | Without Coverage |
| Under $25,000 | 0 (0.0%) | 0 (0.0%) |
| $25,000 to $49,999 | 0 (0.0%) | 0 (0.0%) |
| $50,000 to $74,999 | 25 (100.0%) | 0 (0.0%) |
| $75,000 to $99,999 | 14 (100.0%) | 0 (0.0%) |
| $100,000 and over | 79 (100.0%) | 0 (0.0%) |
Public vs Private Health Insurance Coverage by Age in Bessemer Bend
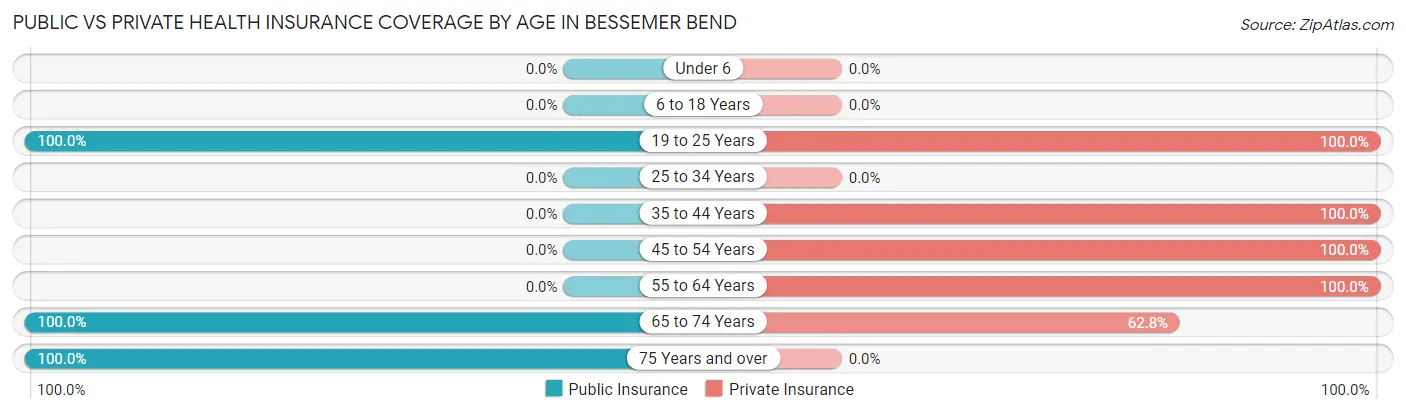
| Age Bracket | Public Insurance | Private Insurance |
| Under 6 | 0 (0.0%) | 0 (0.0%) |
| 6 to 18 Years | 0 (0.0%) | 0 (0.0%) |
| 19 to 25 Years | 7 (100.0%) | 7 (100.0%) |
| 25 to 34 Years | 0 (0.0%) | 0 (0.0%) |
| 35 to 44 Years | 0 (0.0%) | 9 (100.0%) |
| 45 to 54 Years | 0 (0.0%) | 6 (100.0%) |
| 55 to 64 Years | 0 (0.0%) | 22 (100.0%) |
| 65 to 74 Years | 51 (100.0%) | 32 (62.7%) |
| 75 Years and over | 23 (100.0%) | 0 (0.0%) |
| Total | 81 (68.6%) | 76 (64.4%) |
Disability Status by Sex by Age in Bessemer Bend
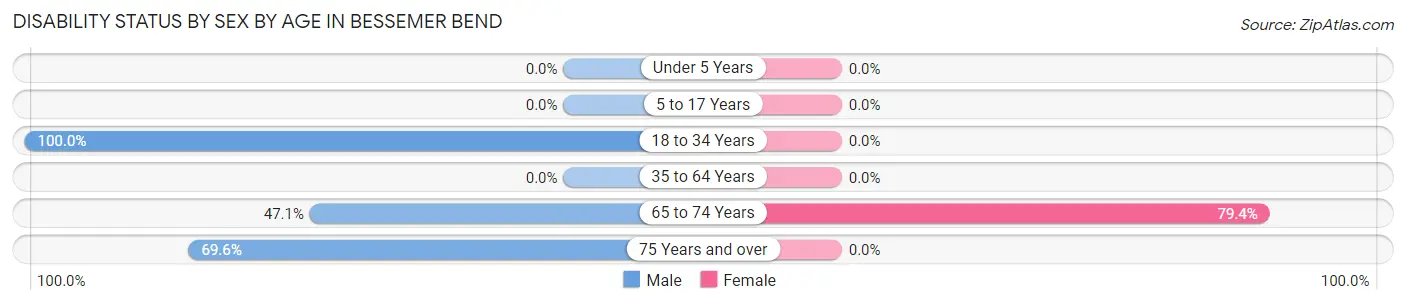
| Age Bracket | Male | Female |
| Under 5 Years | 0 (0.0%) | 0 (0.0%) |
| 5 to 17 Years | 0 (0.0%) | 0 (0.0%) |
| 18 to 34 Years | 7 (100.0%) | 0 (0.0%) |
| 35 to 64 Years | 0 (0.0%) | 0 (0.0%) |
| 65 to 74 Years | 8 (47.1%) | 27 (79.4%) |
| 75 Years and over | 16 (69.6%) | 0 (0.0%) |
Disability Class by Sex by Age in Bessemer Bend
Disability Class: Hearing Difficulty
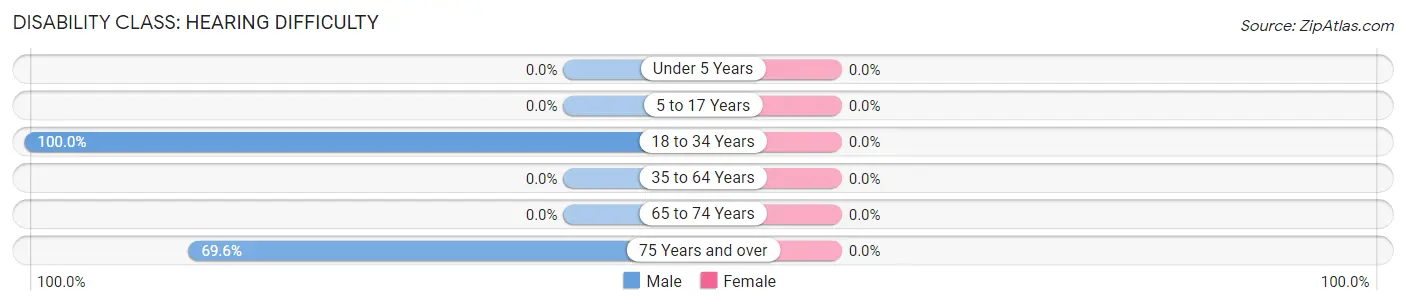
| Age Bracket | Male | Female |
| Under 5 Years | 0 (0.0%) | 0 (0.0%) |
| 5 to 17 Years | 0 (0.0%) | 0 (0.0%) |
| 18 to 34 Years | 7 (100.0%) | 0 (0.0%) |
| 35 to 64 Years | 0 (0.0%) | 0 (0.0%) |
| 65 to 74 Years | 0 (0.0%) | 0 (0.0%) |
| 75 Years and over | 16 (69.6%) | 0 (0.0%) |
Disability Class: Vision Difficulty
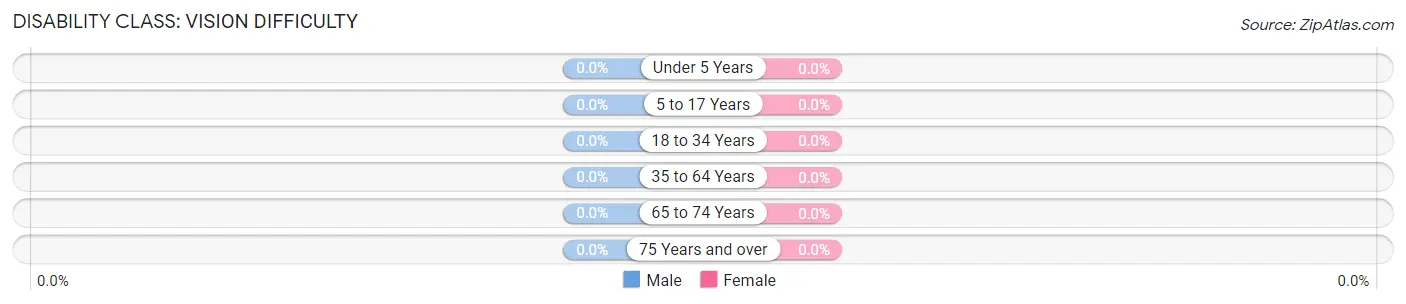
| Age Bracket | Male | Female |
| Under 5 Years | 0 (0.0%) | 0 (0.0%) |
| 5 to 17 Years | 0 (0.0%) | 0 (0.0%) |
| 18 to 34 Years | 0 (0.0%) | 0 (0.0%) |
| 35 to 64 Years | 0 (0.0%) | 0 (0.0%) |
| 65 to 74 Years | 0 (0.0%) | 0 (0.0%) |
| 75 Years and over | 0 (0.0%) | 0 (0.0%) |
Disability Class: Cognitive Difficulty
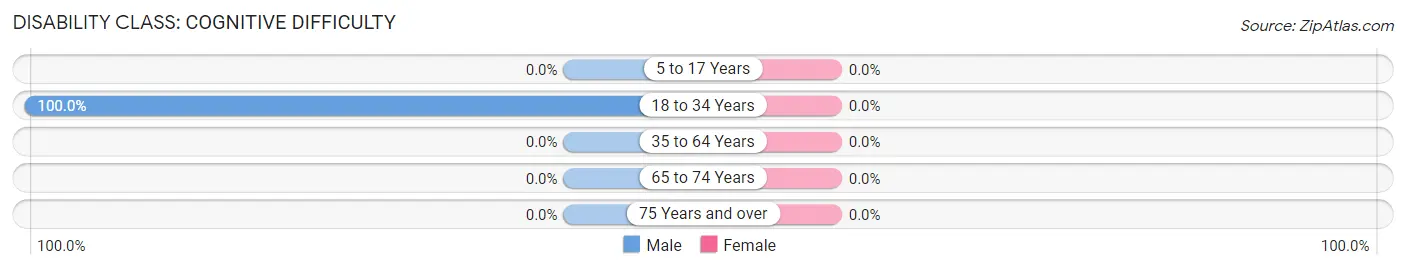
| Age Bracket | Male | Female |
| 5 to 17 Years | 0 (0.0%) | 0 (0.0%) |
| 18 to 34 Years | 7 (100.0%) | 0 (0.0%) |
| 35 to 64 Years | 0 (0.0%) | 0 (0.0%) |
| 65 to 74 Years | 0 (0.0%) | 0 (0.0%) |
| 75 Years and over | 0 (0.0%) | 0 (0.0%) |
Disability Class: Ambulatory Difficulty
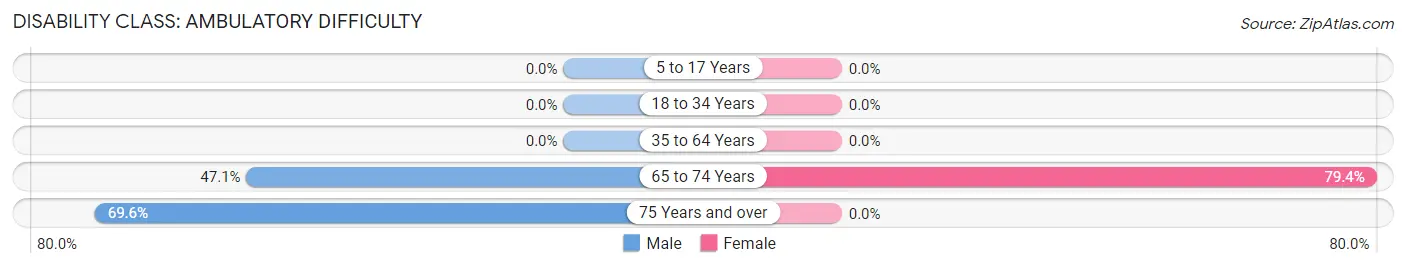
| Age Bracket | Male | Female |
| 5 to 17 Years | 0 (0.0%) | 0 (0.0%) |
| 18 to 34 Years | 0 (0.0%) | 0 (0.0%) |
| 35 to 64 Years | 0 (0.0%) | 0 (0.0%) |
| 65 to 74 Years | 8 (47.1%) | 27 (79.4%) |
| 75 Years and over | 16 (69.6%) | 0 (0.0%) |
Disability Class: Self-Care Difficulty
| Age Bracket | Male | Female |
| 5 to 17 Years | 0 (0.0%) | 0 (0.0%) |
| 18 to 34 Years | 0 (0.0%) | 0 (0.0%) |
| 35 to 64 Years | 0 (0.0%) | 0 (0.0%) |
| 65 to 74 Years | 0 (0.0%) | 0 (0.0%) |
| 75 Years and over | 0 (0.0%) | 0 (0.0%) |
Technology Access in Bessemer Bend
Computing Device Access in Bessemer Bend
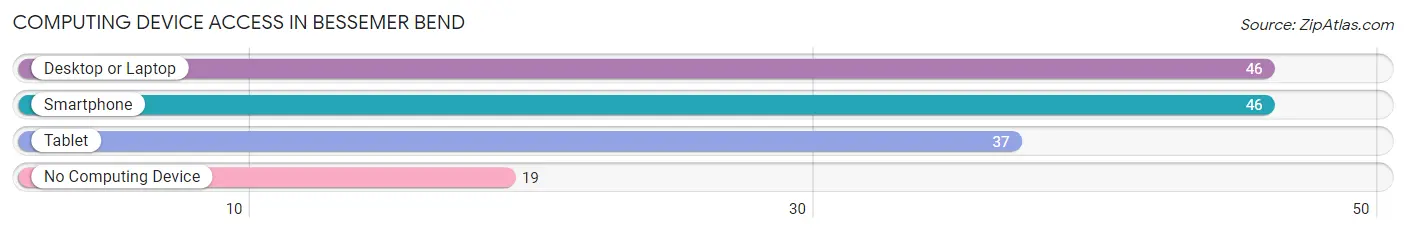
| Device Type | # Households | % Households |
| Desktop or Laptop | 46 | 70.8% |
| Smartphone | 46 | 70.8% |
| Tablet | 37 | 56.9% |
| No Computing Device | 19 | 29.2% |
| Total | 65 | 100.0% |
Internet Access in Bessemer Bend
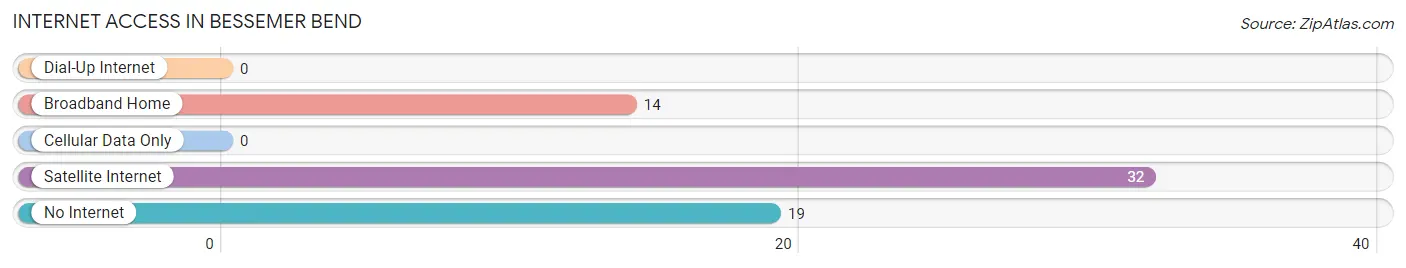
| Internet Type | # Households | % Households |
| Dial-Up Internet | 0 | 0.0% |
| Broadband Home | 14 | 21.5% |
| Cellular Data Only | 0 | 0.0% |
| Satellite Internet | 32 | 49.2% |
| No Internet | 19 | 29.2% |
| Total | 65 | 100.0% |
Bessemer Bend Summary
Bessemer Bend is an unincorporated community located in Natrona County, Wyoming, United States. It is situated along the North Platte River, approximately 10 miles (16 km) south of Casper. The community is named after the nearby Bessemer Bend, a meander of the North Platte River.
History
The area around Bessemer Bend was first inhabited by Native American tribes, including the Arapaho, Cheyenne, and Shoshone. The first European settlers arrived in the area in the late 19th century, and the community was established in the early 1900s. The town was named after the nearby Bessemer Bend, a meander of the North Platte River.
The town was originally a farming and ranching community, but in the early 20th century, it became a popular tourist destination. The area was known for its scenic beauty and abundant wildlife, and it was a popular spot for fishing, hunting, and camping.
In the 1950s, the town began to decline as the population shifted to larger cities. The town was eventually abandoned, and the buildings were left to decay. In the late 1990s, the town was revitalized and is now a popular destination for tourists and outdoor enthusiasts.
Geography
Bessemer Bend is located in Natrona County, Wyoming, approximately 10 miles (16 km) south of Casper. The town is situated along the North Platte River, and is surrounded by the North Platte River Valley. The area is known for its scenic beauty, and is home to a variety of wildlife, including deer, elk, and antelope.
The climate in Bessemer Bend is semi-arid, with hot summers and cold winters. The average annual temperature is 48°F (9°C), and the average annual precipitation is 12.5 inches (318 mm).
Economy
The economy of Bessemer Bend is largely based on tourism. The town is a popular destination for outdoor enthusiasts, and it is home to a variety of recreational activities, including fishing, hunting, camping, and hiking. The town is also home to several restaurants, bars, and lodging facilities.
Demographics
As of the 2010 census, the population of Bessemer Bend was 545. The racial makeup of the town was 97.3% White, 0.2% African American, 0.2% Native American, 0.2% Asian, 0.2% from other races, and 1.9% from two or more races. Hispanic or Latino of any race were 1.3% of the population.
The median income for a household in Bessemer Bend was $41,250, and the median income for a family was $45,000. The per capita income for the town was $19,945. About 11.2% of families and 13.2% of the population were below the poverty line, including 16.7% of those under age 18 and none of those age 65 or over.
Common Questions
What is Per Capita Income in Bessemer Bend?
Per Capita income in Bessemer Bend is $100,520.
What is the Median Family Income in Bessemer Bend?
Median Family Income in Bessemer Bend is $153,158.
What is the Median Household income in Bessemer Bend?
Median Household Income in Bessemer Bend is $153,618.
What is Inequality or Gini Index in Bessemer Bend?
Inequality or Gini Index in Bessemer Bend is 0.30.
What is the Total Population of Bessemer Bend?
Total Population of Bessemer Bend is 118.
What is the Total Male Population of Bessemer Bend?
Total Male Population of Bessemer Bend is 78.
What is the Total Female Population of Bessemer Bend?
Total Female Population of Bessemer Bend is 40.
What is the Ratio of Males per 100 Females in Bessemer Bend?
There are 195.00 Males per 100 Females in Bessemer Bend.
What is the Ratio of Females per 100 Males in Bessemer Bend?
There are 51.28 Females per 100 Males in Bessemer Bend.
What is the Median Population Age in Bessemer Bend?
Median Population Age in Bessemer Bend is 66.9 Years.
What is the Average Family Size in Bessemer Bend
Average Family Size in Bessemer Bend is 2.3 People.
What is the Average Household Size in Bessemer Bend
Average Household Size in Bessemer Bend is 1.8 People.
How Large is the Labor Force in Bessemer Bend?
There are 67 People in the Labor Forcein in Bessemer Bend.
What is the Percentage of People in the Labor Force in Bessemer Bend?
56.8% of People are in the Labor Force in Bessemer Bend.