Yugoslavian vs Irish 4 or more Vehicles in Household
COMPARE
Yugoslavian
Irish
4 or more Vehicles in Household
4 or more Vehicles in Household Comparison
Yugoslavians
Irish
6.3%
4 OR MORE VEHICLES IN HOUSEHOLD
41.1/ 100
METRIC RATING
181st/ 347
METRIC RANK
7.1%
4 OR MORE VEHICLES IN HOUSEHOLD
99.0/ 100
METRIC RATING
98th/ 347
METRIC RANK
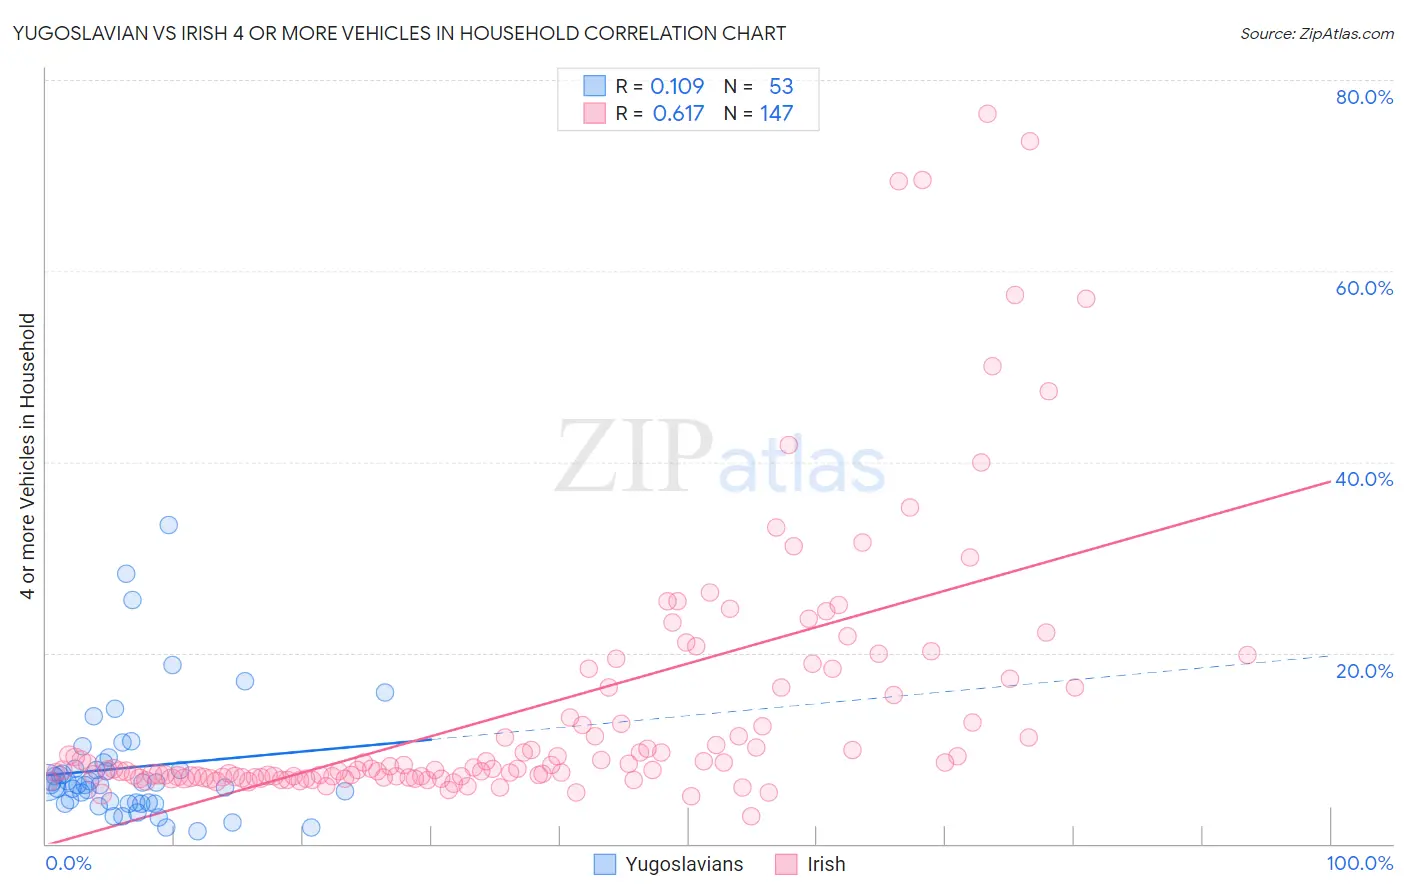
Yugoslavian vs Irish 4 or more Vehicles in Household Correlation Chart
The statistical analysis conducted on geographies consisting of 285,036,674 people shows a poor positive correlation between the proportion of Yugoslavians and percentage of households with 4 or more vehicles available in the United States with a correlation coefficient (R) of 0.109 and weighted average of 6.3%. Similarly, the statistical analysis conducted on geographies consisting of 576,295,994 people shows a significant positive correlation between the proportion of Irish and percentage of households with 4 or more vehicles available in the United States with a correlation coefficient (R) of 0.617 and weighted average of 7.1%, a difference of 12.6%.
4 or more Vehicles in Household Correlation Summary
| Measurement | Yugoslavian | Irish |
| Minimum | 1.3% | 2.8% |
| Maximum | 33.3% | 76.5% |
| Range | 32.1% | 73.6% |
| Mean | 8.0% | 14.2% |
| Median | 6.2% | 7.9% |
| Interquartile 25% (IQ1) | 4.3% | 7.0% |
| Interquartile 75% (IQ3) | 8.2% | 16.4% |
| Interquartile Range (IQR) | 3.9% | 9.4% |
| Standard Deviation (Sample) | 6.4% | 14.0% |
| Standard Deviation (Population) | 6.4% | 14.0% |
Similar Demographics by 4 or more Vehicles in Household
Demographics Similar to Yugoslavians by 4 or more Vehicles in Household
In terms of 4 or more vehicles in household, the demographic groups most similar to Yugoslavians are South American Indian (6.3%, a difference of 0.050%), Syrian (6.3%, a difference of 0.090%), Immigrants from Japan (6.3%, a difference of 0.20%), Belizean (6.3%, a difference of 0.35%), and Immigrants from Burma/Myanmar (6.2%, a difference of 0.39%).
| Demographics | Rating | Rank | 4 or more Vehicles in Household |
| Lithuanians | 50.0 /100 | #174 | Average 6.3% |
| Immigrants | Western Europe | 48.8 /100 | #175 | Average 6.3% |
| Ukrainians | 47.6 /100 | #176 | Average 6.3% |
| Slovaks | 46.9 /100 | #177 | Average 6.3% |
| Belizeans | 44.5 /100 | #178 | Average 6.3% |
| Immigrants | Japan | 43.1 /100 | #179 | Average 6.3% |
| Syrians | 42.0 /100 | #180 | Average 6.3% |
| Yugoslavians | 41.1 /100 | #181 | Average 6.3% |
| South American Indians | 40.7 /100 | #182 | Average 6.3% |
| Immigrants | Burma/Myanmar | 37.5 /100 | #183 | Fair 6.2% |
| Iraqis | 37.3 /100 | #184 | Fair 6.2% |
| Thais | 36.9 /100 | #185 | Fair 6.2% |
| Immigrants | Northern Europe | 36.8 /100 | #186 | Fair 6.2% |
| Immigrants | South Africa | 35.4 /100 | #187 | Fair 6.2% |
| Kiowa | 34.7 /100 | #188 | Fair 6.2% |
Demographics Similar to Irish by 4 or more Vehicles in Household
In terms of 4 or more vehicles in household, the demographic groups most similar to Irish are Celtic (7.1%, a difference of 0.42%), Seminole (7.0%, a difference of 0.44%), Taiwanese (7.0%, a difference of 0.52%), Pakistani (7.0%, a difference of 0.59%), and Asian (7.0%, a difference of 0.66%).
| Demographics | Rating | Rank | 4 or more Vehicles in Household |
| Assyrians/Chaldeans/Syriacs | 99.4 /100 | #91 | Exceptional 7.2% |
| Immigrants | Latin America | 99.4 /100 | #92 | Exceptional 7.1% |
| Immigrants | Afghanistan | 99.3 /100 | #93 | Exceptional 7.1% |
| Dutch West Indians | 99.3 /100 | #94 | Exceptional 7.1% |
| Czechoslovakians | 99.3 /100 | #95 | Exceptional 7.1% |
| Central Americans | 99.3 /100 | #96 | Exceptional 7.1% |
| Celtics | 99.1 /100 | #97 | Exceptional 7.1% |
| Irish | 99.0 /100 | #98 | Exceptional 7.1% |
| Seminole | 98.8 /100 | #99 | Exceptional 7.0% |
| Taiwanese | 98.7 /100 | #100 | Exceptional 7.0% |
| Pakistanis | 98.7 /100 | #101 | Exceptional 7.0% |
| Asians | 98.6 /100 | #102 | Exceptional 7.0% |
| Blackfeet | 98.6 /100 | #103 | Exceptional 7.0% |
| Hmong | 98.3 /100 | #104 | Exceptional 7.0% |
| German Russians | 98.3 /100 | #105 | Exceptional 7.0% |