Paiute vs Native/Alaskan 4 or more Vehicles in Household
COMPARE
Paiute
Native/Alaskan
4 or more Vehicles in Household
4 or more Vehicles in Household Comparison
Paiute
Natives/Alaskans
9.0%
4 OR MORE VEHICLES IN HOUSEHOLD
100.0/ 100
METRIC RATING
10th/ 347
METRIC RANK
8.2%
4 OR MORE VEHICLES IN HOUSEHOLD
100.0/ 100
METRIC RATING
31st/ 347
METRIC RANK
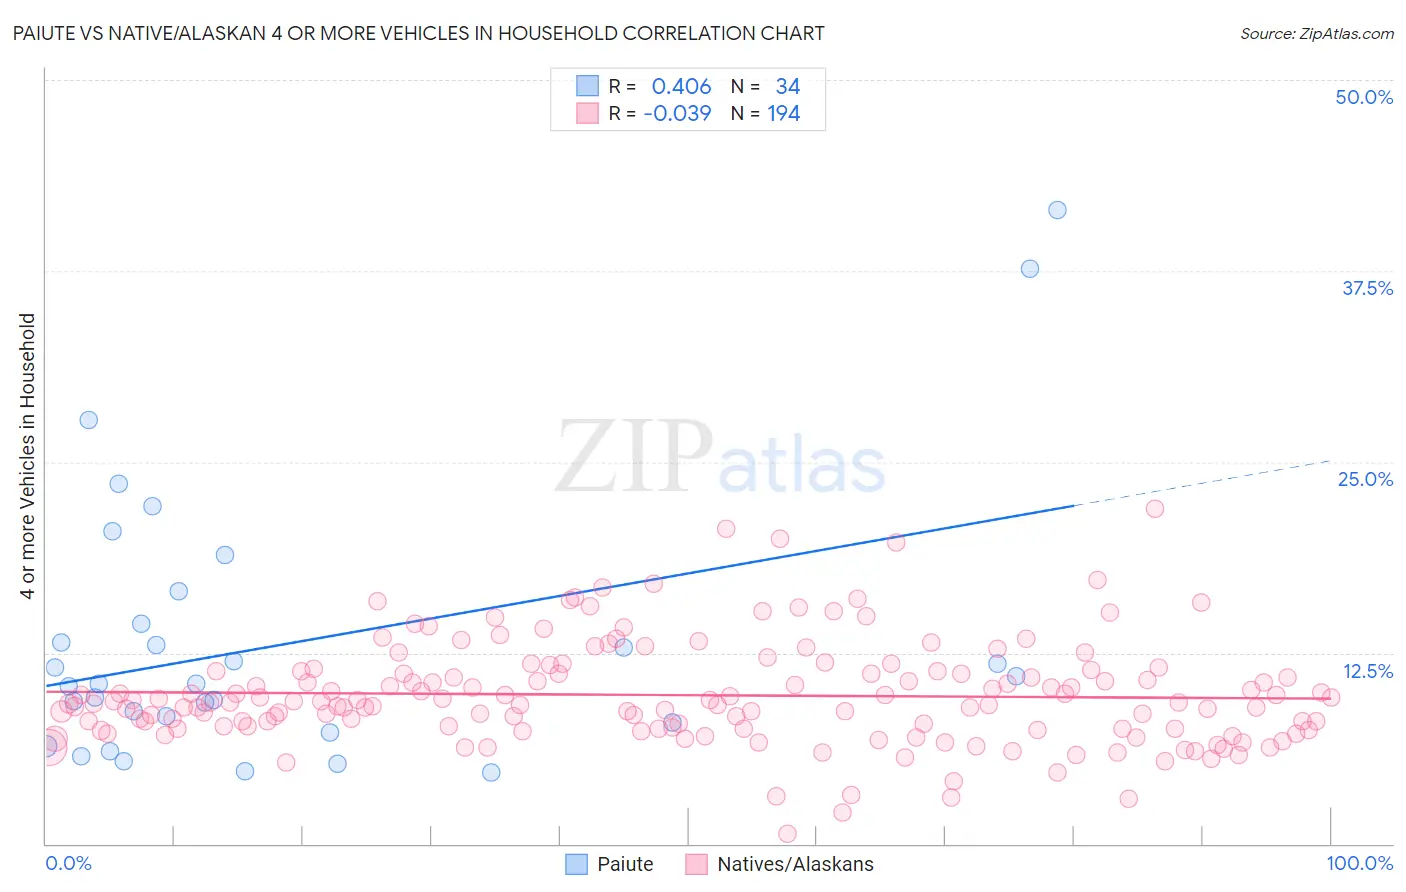
Paiute vs Native/Alaskan 4 or more Vehicles in Household Correlation Chart
The statistical analysis conducted on geographies consisting of 58,379,000 people shows a moderate positive correlation between the proportion of Paiute and percentage of households with 4 or more vehicles available in the United States with a correlation coefficient (R) of 0.406 and weighted average of 9.0%. Similarly, the statistical analysis conducted on geographies consisting of 510,504,827 people shows no correlation between the proportion of Natives/Alaskans and percentage of households with 4 or more vehicles available in the United States with a correlation coefficient (R) of -0.039 and weighted average of 8.2%, a difference of 10.0%.
4 or more Vehicles in Household Correlation Summary
| Measurement | Paiute | Native/Alaskan |
| Minimum | 4.7% | 0.68% |
| Maximum | 41.5% | 21.9% |
| Range | 36.8% | 21.2% |
| Mean | 13.2% | 9.7% |
| Median | 10.5% | 9.2% |
| Interquartile 25% (IQ1) | 7.9% | 7.5% |
| Interquartile 75% (IQ3) | 14.4% | 11.3% |
| Interquartile Range (IQR) | 6.5% | 3.7% |
| Standard Deviation (Sample) | 8.7% | 3.4% |
| Standard Deviation (Population) | 8.6% | 3.4% |
Similar Demographics by 4 or more Vehicles in Household
Demographics Similar to Paiute by 4 or more Vehicles in Household
In terms of 4 or more vehicles in household, the demographic groups most similar to Paiute are Immigrants from Mexico (9.0%, a difference of 0.12%), Mexican (8.9%, a difference of 0.80%), Hawaiian (8.9%, a difference of 0.81%), Chinese (8.8%, a difference of 1.8%), and Shoshone (8.8%, a difference of 1.8%).
| Demographics | Rating | Rank | 4 or more Vehicles in Household |
| Spanish American Indians | 100.0 /100 | #3 | Exceptional 10.8% |
| Tongans | 100.0 /100 | #4 | Exceptional 10.0% |
| Immigrants | Fiji | 100.0 /100 | #5 | Exceptional 9.6% |
| Puget Sound Salish | 100.0 /100 | #6 | Exceptional 9.4% |
| Native Hawaiians | 100.0 /100 | #7 | Exceptional 9.4% |
| Arapaho | 100.0 /100 | #8 | Exceptional 9.4% |
| Samoans | 100.0 /100 | #9 | Exceptional 9.2% |
| Paiute | 100.0 /100 | #10 | Exceptional 9.0% |
| Immigrants | Mexico | 100.0 /100 | #11 | Exceptional 9.0% |
| Mexicans | 100.0 /100 | #12 | Exceptional 8.9% |
| Hawaiians | 100.0 /100 | #13 | Exceptional 8.9% |
| Chinese | 100.0 /100 | #14 | Exceptional 8.8% |
| Shoshone | 100.0 /100 | #15 | Exceptional 8.8% |
| Lumbee | 100.0 /100 | #16 | Exceptional 8.8% |
| Ute | 100.0 /100 | #17 | Exceptional 8.8% |
Demographics Similar to Natives/Alaskans by 4 or more Vehicles in Household
In terms of 4 or more vehicles in household, the demographic groups most similar to Natives/Alaskans are Navajo (8.2%, a difference of 0.40%), Immigrants from South Eastern Asia (8.2%, a difference of 0.43%), Marshallese (8.1%, a difference of 0.53%), Yaqui (8.1%, a difference of 0.82%), and Cheyenne (8.3%, a difference of 1.1%).
| Demographics | Rating | Rank | 4 or more Vehicles in Household |
| Immigrants | Central America | 100.0 /100 | #24 | Exceptional 8.5% |
| Basques | 100.0 /100 | #25 | Exceptional 8.4% |
| Mexican American Indians | 100.0 /100 | #26 | Exceptional 8.4% |
| Sri Lankans | 100.0 /100 | #27 | Exceptional 8.4% |
| Cheyenne | 100.0 /100 | #28 | Exceptional 8.3% |
| Immigrants | South Eastern Asia | 100.0 /100 | #29 | Exceptional 8.2% |
| Navajo | 100.0 /100 | #30 | Exceptional 8.2% |
| Natives/Alaskans | 100.0 /100 | #31 | Exceptional 8.2% |
| Marshallese | 100.0 /100 | #32 | Exceptional 8.1% |
| Yaqui | 100.0 /100 | #33 | Exceptional 8.1% |
| Alaskan Athabascans | 100.0 /100 | #34 | Exceptional 8.1% |
| Guamanians/Chamorros | 100.0 /100 | #35 | Exceptional 8.1% |
| Norwegians | 100.0 /100 | #36 | Exceptional 8.0% |
| Scandinavians | 100.0 /100 | #37 | Exceptional 8.0% |
| Sioux | 100.0 /100 | #38 | Exceptional 8.0% |