Jamaican vs Afghan 4 or more Vehicles in Household
COMPARE
Jamaican
Afghan
4 or more Vehicles in Household
4 or more Vehicles in Household Comparison
Jamaicans
Afghans
4.6%
4 OR MORE VEHICLES IN HOUSEHOLD
0.0/ 100
METRIC RATING
318th/ 347
METRIC RANK
7.3%
4 OR MORE VEHICLES IN HOUSEHOLD
99.7/ 100
METRIC RATING
84th/ 347
METRIC RANK
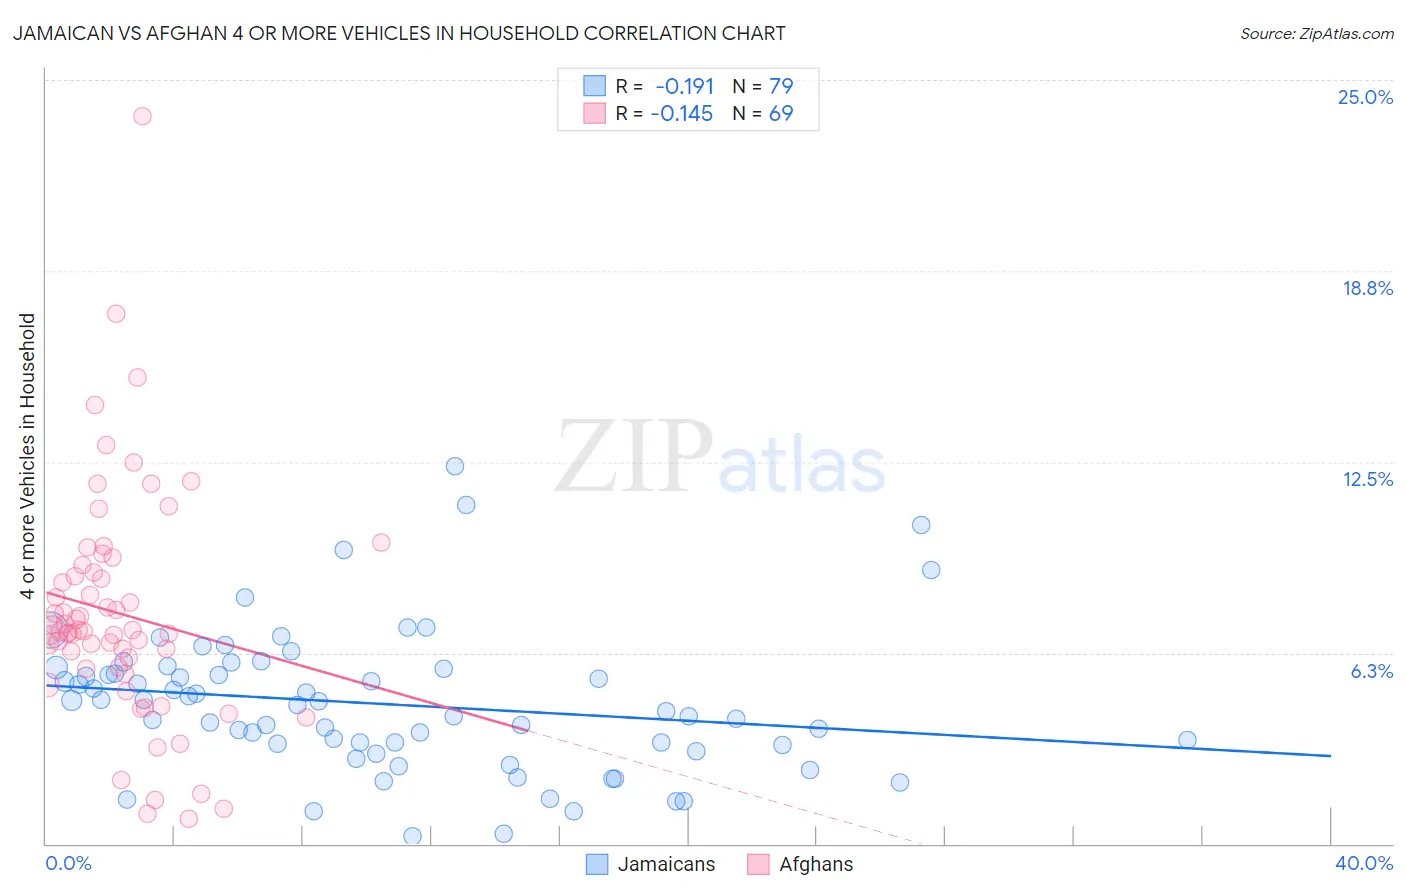
Jamaican vs Afghan 4 or more Vehicles in Household Correlation Chart
The statistical analysis conducted on geographies consisting of 366,007,173 people shows a poor negative correlation between the proportion of Jamaicans and percentage of households with 4 or more vehicles available in the United States with a correlation coefficient (R) of -0.191 and weighted average of 4.6%. Similarly, the statistical analysis conducted on geographies consisting of 148,454,289 people shows a poor negative correlation between the proportion of Afghans and percentage of households with 4 or more vehicles available in the United States with a correlation coefficient (R) of -0.145 and weighted average of 7.3%, a difference of 56.6%.
4 or more Vehicles in Household Correlation Summary
| Measurement | Jamaican | Afghan |
| Minimum | 0.24% | 0.82% |
| Maximum | 12.3% | 23.8% |
| Range | 12.1% | 23.0% |
| Mean | 4.6% | 7.5% |
| Median | 4.5% | 7.0% |
| Interquartile 25% (IQ1) | 3.2% | 5.8% |
| Interquartile 75% (IQ3) | 5.7% | 9.0% |
| Interquartile Range (IQR) | 2.5% | 3.2% |
| Standard Deviation (Sample) | 2.3% | 3.8% |
| Standard Deviation (Population) | 2.3% | 3.8% |
Similar Demographics by 4 or more Vehicles in Household
Demographics Similar to Jamaicans by 4 or more Vehicles in Household
In terms of 4 or more vehicles in household, the demographic groups most similar to Jamaicans are U.S. Virgin Islander (4.6%, a difference of 0.24%), Haitian (4.6%, a difference of 0.65%), Puerto Rican (4.7%, a difference of 1.9%), Immigrants from Belarus (4.7%, a difference of 2.4%), and Immigrants from West Indies (4.7%, a difference of 2.5%).
| Demographics | Rating | Rank | 4 or more Vehicles in Household |
| Houma | 0.0 /100 | #311 | Tragic 4.9% |
| Albanians | 0.0 /100 | #312 | Tragic 4.8% |
| Immigrants | Israel | 0.0 /100 | #313 | Tragic 4.8% |
| Immigrants | West Indies | 0.0 /100 | #314 | Tragic 4.7% |
| Immigrants | Belarus | 0.0 /100 | #315 | Tragic 4.7% |
| Puerto Ricans | 0.0 /100 | #316 | Tragic 4.7% |
| U.S. Virgin Islanders | 0.0 /100 | #317 | Tragic 4.6% |
| Jamaicans | 0.0 /100 | #318 | Tragic 4.6% |
| Haitians | 0.0 /100 | #319 | Tragic 4.6% |
| Immigrants | Haiti | 0.0 /100 | #320 | Tragic 4.5% |
| Ecuadorians | 0.0 /100 | #321 | Tragic 4.5% |
| Immigrants | Yemen | 0.0 /100 | #322 | Tragic 4.5% |
| Immigrants | Caribbean | 0.0 /100 | #323 | Tragic 4.4% |
| Soviet Union | 0.0 /100 | #324 | Tragic 4.4% |
| Immigrants | Jamaica | 0.0 /100 | #325 | Tragic 4.4% |
Demographics Similar to Afghans by 4 or more Vehicles in Household
In terms of 4 or more vehicles in household, the demographic groups most similar to Afghans are Cree (7.2%, a difference of 0.17%), Potawatomi (7.3%, a difference of 0.33%), Immigrants from Indonesia (7.2%, a difference of 0.35%), Delaware (7.2%, a difference of 0.41%), and Nonimmigrants (7.2%, a difference of 0.43%).
| Demographics | Rating | Rank | 4 or more Vehicles in Household |
| Apache | 99.9 /100 | #77 | Exceptional 7.4% |
| Whites/Caucasians | 99.8 /100 | #78 | Exceptional 7.4% |
| Czechs | 99.8 /100 | #79 | Exceptional 7.4% |
| Alaska Natives | 99.8 /100 | #80 | Exceptional 7.3% |
| Finns | 99.8 /100 | #81 | Exceptional 7.3% |
| Northern Europeans | 99.8 /100 | #82 | Exceptional 7.3% |
| Potawatomi | 99.7 /100 | #83 | Exceptional 7.3% |
| Afghans | 99.7 /100 | #84 | Exceptional 7.3% |
| Cree | 99.7 /100 | #85 | Exceptional 7.2% |
| Immigrants | Indonesia | 99.6 /100 | #86 | Exceptional 7.2% |
| Delaware | 99.6 /100 | #87 | Exceptional 7.2% |
| Immigrants | Nonimmigrants | 99.6 /100 | #88 | Exceptional 7.2% |
| British | 99.6 /100 | #89 | Exceptional 7.2% |
| Creek | 99.6 /100 | #90 | Exceptional 7.2% |
| Assyrians/Chaldeans/Syriacs | 99.4 /100 | #91 | Exceptional 7.2% |