Jamaican vs Iroquois 4 or more Vehicles in Household
COMPARE
Jamaican
Iroquois
4 or more Vehicles in Household
4 or more Vehicles in Household Comparison
Jamaicans
Iroquois
4.6%
4 OR MORE VEHICLES IN HOUSEHOLD
0.0/ 100
METRIC RATING
318th/ 347
METRIC RANK
6.5%
4 OR MORE VEHICLES IN HOUSEHOLD
70.4/ 100
METRIC RATING
155th/ 347
METRIC RANK
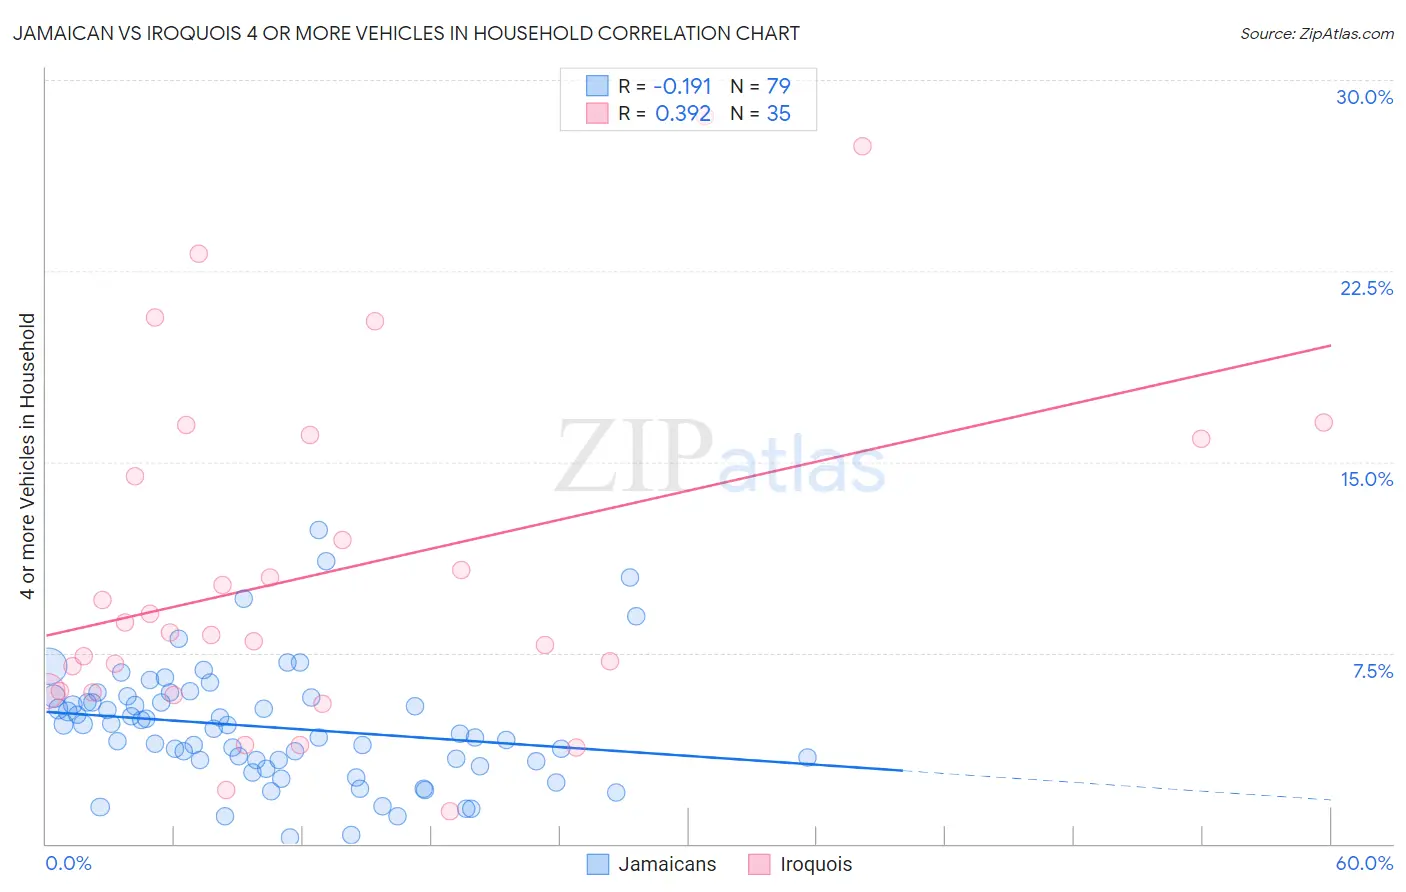
Jamaican vs Iroquois 4 or more Vehicles in Household Correlation Chart
The statistical analysis conducted on geographies consisting of 366,007,173 people shows a poor negative correlation between the proportion of Jamaicans and percentage of households with 4 or more vehicles available in the United States with a correlation coefficient (R) of -0.191 and weighted average of 4.6%. Similarly, the statistical analysis conducted on geographies consisting of 206,658,365 people shows a mild positive correlation between the proportion of Iroquois and percentage of households with 4 or more vehicles available in the United States with a correlation coefficient (R) of 0.392 and weighted average of 6.5%, a difference of 39.6%.
4 or more Vehicles in Household Correlation Summary
| Measurement | Jamaican | Iroquois |
| Minimum | 0.24% | 1.3% |
| Maximum | 12.3% | 28.6% |
| Range | 12.1% | 27.3% |
| Mean | 4.6% | 10.7% |
| Median | 4.5% | 8.3% |
| Interquartile 25% (IQ1) | 3.2% | 6.0% |
| Interquartile 75% (IQ3) | 5.7% | 15.9% |
| Interquartile Range (IQR) | 2.5% | 9.9% |
| Standard Deviation (Sample) | 2.3% | 6.9% |
| Standard Deviation (Population) | 2.3% | 6.8% |
Similar Demographics by 4 or more Vehicles in Household
Demographics Similar to Jamaicans by 4 or more Vehicles in Household
In terms of 4 or more vehicles in household, the demographic groups most similar to Jamaicans are U.S. Virgin Islander (4.6%, a difference of 0.24%), Haitian (4.6%, a difference of 0.65%), Puerto Rican (4.7%, a difference of 1.9%), Immigrants from Belarus (4.7%, a difference of 2.4%), and Immigrants from West Indies (4.7%, a difference of 2.5%).
| Demographics | Rating | Rank | 4 or more Vehicles in Household |
| Houma | 0.0 /100 | #311 | Tragic 4.9% |
| Albanians | 0.0 /100 | #312 | Tragic 4.8% |
| Immigrants | Israel | 0.0 /100 | #313 | Tragic 4.8% |
| Immigrants | West Indies | 0.0 /100 | #314 | Tragic 4.7% |
| Immigrants | Belarus | 0.0 /100 | #315 | Tragic 4.7% |
| Puerto Ricans | 0.0 /100 | #316 | Tragic 4.7% |
| U.S. Virgin Islanders | 0.0 /100 | #317 | Tragic 4.6% |
| Jamaicans | 0.0 /100 | #318 | Tragic 4.6% |
| Haitians | 0.0 /100 | #319 | Tragic 4.6% |
| Immigrants | Haiti | 0.0 /100 | #320 | Tragic 4.5% |
| Ecuadorians | 0.0 /100 | #321 | Tragic 4.5% |
| Immigrants | Yemen | 0.0 /100 | #322 | Tragic 4.5% |
| Immigrants | Caribbean | 0.0 /100 | #323 | Tragic 4.4% |
| Soviet Union | 0.0 /100 | #324 | Tragic 4.4% |
| Immigrants | Jamaica | 0.0 /100 | #325 | Tragic 4.4% |
Demographics Similar to Iroquois by 4 or more Vehicles in Household
In terms of 4 or more vehicles in household, the demographic groups most similar to Iroquois are Iranian (6.5%, a difference of 0.060%), Central American Indian (6.5%, a difference of 0.080%), Immigrants from Armenia (6.5%, a difference of 0.090%), Peruvian (6.5%, a difference of 0.11%), and Yuman (6.5%, a difference of 0.21%).
| Demographics | Rating | Rank | 4 or more Vehicles in Household |
| Immigrants | Jordan | 73.7 /100 | #148 | Good 6.5% |
| Greeks | 73.6 /100 | #149 | Good 6.5% |
| New Zealanders | 73.3 /100 | #150 | Good 6.5% |
| Immigrants | Hong Kong | 72.2 /100 | #151 | Good 6.5% |
| Yuman | 72.1 /100 | #152 | Good 6.5% |
| Immigrants | Armenia | 71.2 /100 | #153 | Good 6.5% |
| Central American Indians | 71.1 /100 | #154 | Good 6.5% |
| Iroquois | 70.4 /100 | #155 | Good 6.5% |
| Iranians | 69.9 /100 | #156 | Good 6.5% |
| Peruvians | 69.4 /100 | #157 | Good 6.5% |
| Zimbabweans | 67.1 /100 | #158 | Good 6.4% |
| Indians (Asian) | 66.3 /100 | #159 | Good 6.4% |
| Palestinians | 65.8 /100 | #160 | Good 6.4% |
| Immigrants | Cameroon | 64.4 /100 | #161 | Good 6.4% |
| Immigrants | Pakistan | 63.2 /100 | #162 | Good 6.4% |