Jamaican Female Disability
COMPARE
Jamaican
Select to Compare
Female Disability
Jamaican Female Disability
12.7%
DISABILITY | FEMALES
1.4/ 100
METRIC RATING
253rd/ 347
METRIC RANK
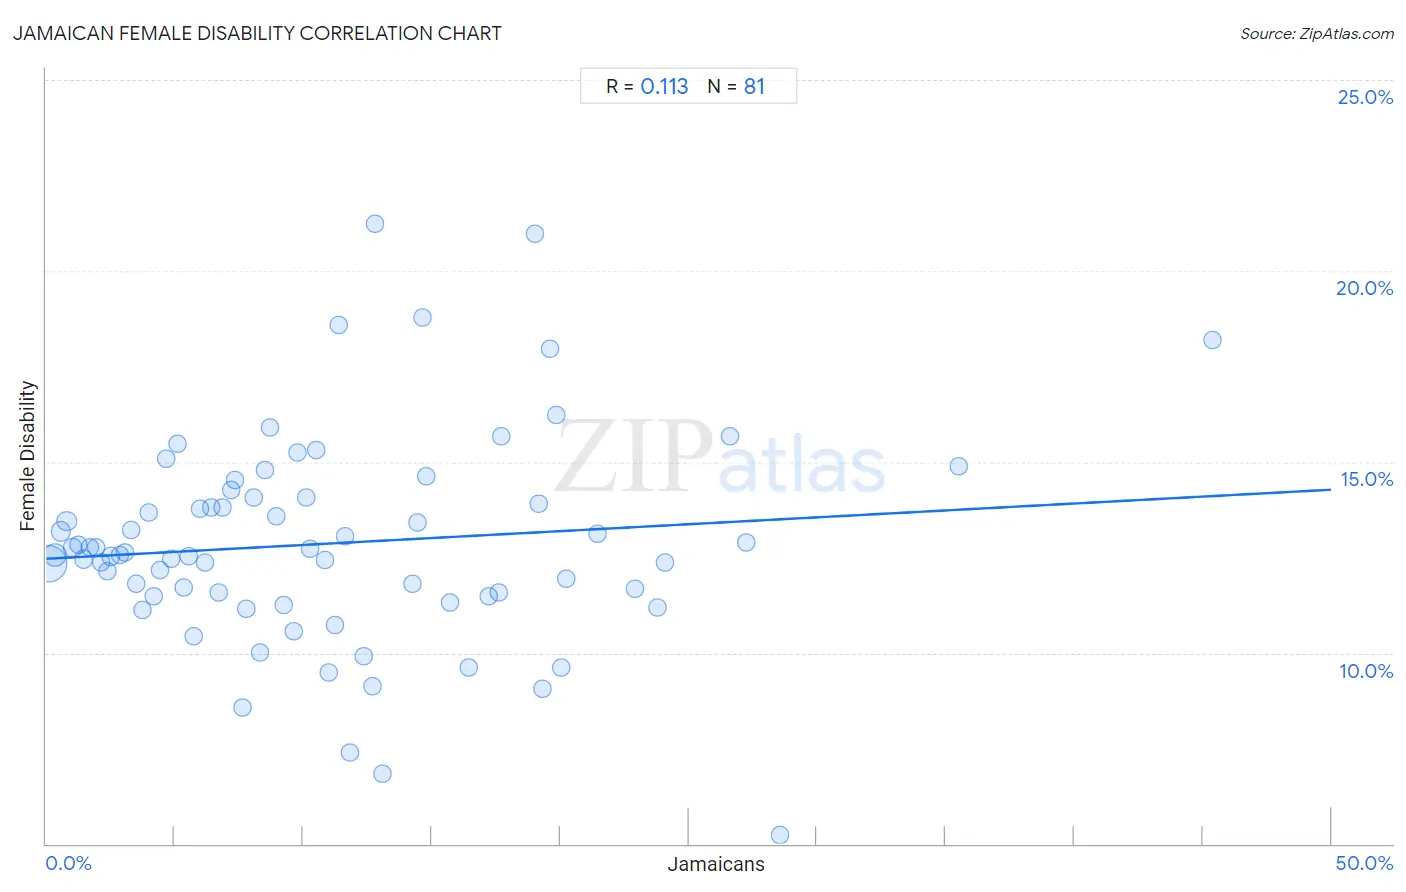
Jamaican Female Disability Correlation Chart
The statistical analysis conducted on geographies consisting of 367,961,325 people shows a poor positive correlation between the proportion of Jamaicans and percentage of females with a disability in the United States with a correlation coefficient (R) of 0.113 and weighted average of 12.7%. On average, for every 1% (one percent) increase in Jamaicans within a typical geography, there is an increase of 0.036% in percentage of females with a disability.
It is essential to understand that the correlation between the percentage of Jamaicans and percentage of females with a disability does not imply a direct cause-and-effect relationship. It remains uncertain whether the presence of Jamaicans influences an upward or downward trend in the level of percentage of females with a disability within an area, or if Jamaicans simply ended up residing in those areas with higher or lower levels of percentage of females with a disability due to other factors.
Demographics Similar to Jamaicans by Female Disability
In terms of female disability, the demographic groups most similar to Jamaicans are Immigrants from Caribbean (12.7%, a difference of 0.010%), Hawaiian (12.7%, a difference of 0.030%), Crow (12.7%, a difference of 0.090%), Immigrants from Germany (12.7%, a difference of 0.11%), and Slovene (12.7%, a difference of 0.15%).
| Demographics | Rating | Rank | Female Disability |
| Spanish American Indians | 2.1 /100 | #246 | Tragic 12.6% |
| Menominee | 2.1 /100 | #247 | Tragic 12.6% |
| Carpatho Rusyns | 2.0 /100 | #248 | Tragic 12.6% |
| Immigrants from Congo | 1.8 /100 | #249 | Tragic 12.7% |
| Slovenes | 1.7 /100 | #250 | Tragic 12.7% |
| Crow | 1.6 /100 | #251 | Tragic 12.7% |
| Immigrants from Caribbean | 1.4 /100 | #252 | Tragic 12.7% |
| Jamaicans | 1.4 /100 | #253 | Tragic 12.7% |
| Hawaiians | 1.4 /100 | #254 | Tragic 12.7% |
| Immigrants from Germany | 1.3 /100 | #255 | Tragic 12.7% |
| British West Indians | 1.2 /100 | #256 | Tragic 12.7% |
| Liberians | 1.1 /100 | #257 | Tragic 12.7% |
| Aleuts | 1.1 /100 | #258 | Tragic 12.7% |
| Immigrants from Armenia | 1.0 /100 | #259 | Tragic 12.7% |
| Sub-Saharan Africans | 1.0 /100 | #260 | Tragic 12.7% |
Jamaican Female Disability Correlation Summary
| Measurement | Jamaican Data | Female Disability Data |
| Minimum | 0.098% | 5.2% |
| Maximum | 45.4% | 21.2% |
| Range | 45.3% | 16.0% |
| Mean | 11.1% | 12.9% |
| Median | 9.2% | 12.6% |
| Interquartile 25% (IQ1) | 4.5% | 11.5% |
| Interquartile 75% (IQ3) | 16.1% | 14.1% |
| Interquartile Range (IQR) | 11.5% | 2.6% |
| Standard Deviation (Sample) | 8.6% | 2.8% |
| Standard Deviation (Population) | 8.5% | 2.7% |
Correlation Details
| Jamaican Percentile | Sample Size | Female Disability |
[ 0.0% - 0.5% ] 0.098% | 212,854,262 | 12.3% |
[ 0.0% - 0.5% ] 0.32% | 56,789,276 | 12.6% |
[ 0.5% - 1.0% ] 0.57% | 24,465,741 | 13.2% |
[ 0.5% - 1.0% ] 0.79% | 17,472,549 | 13.4% |
[ 1.0% - 1.5% ] 1.02% | 10,173,045 | 12.8% |
[ 1.0% - 1.5% ] 1.24% | 6,752,382 | 12.8% |
[ 1.0% - 1.5% ] 1.46% | 5,415,247 | 12.5% |
[ 1.5% - 2.0% ] 1.71% | 3,912,199 | 12.8% |
[ 1.5% - 2.0% ] 1.93% | 3,083,042 | 12.7% |
[ 2.0% - 2.5% ] 2.15% | 2,533,229 | 12.4% |
[ 2.0% - 2.5% ] 2.40% | 1,284,147 | 12.1% |
[ 2.5% - 3.0% ] 2.52% | 10,259,620 | 12.5% |
[ 2.5% - 3.0% ] 2.85% | 928,079 | 12.6% |
[ 3.0% - 3.5% ] 3.04% | 1,392,359 | 12.6% |
[ 3.0% - 3.5% ] 3.32% | 1,263,733 | 13.2% |
[ 3.5% - 4.0% ] 3.52% | 634,262 | 11.8% |
[ 3.5% - 4.0% ] 3.76% | 674,261 | 11.1% |
[ 3.5% - 4.0% ] 3.98% | 511,884 | 13.7% |
[ 4.0% - 4.5% ] 4.16% | 340,721 | 11.5% |
[ 4.0% - 4.5% ] 4.44% | 584,124 | 12.2% |
[ 4.5% - 5.0% ] 4.65% | 540,500 | 15.1% |
[ 4.5% - 5.0% ] 4.85% | 416,475 | 12.5% |
[ 5.0% - 5.5% ] 5.10% | 153,077 | 15.5% |
[ 5.0% - 5.5% ] 5.35% | 201,661 | 11.7% |
[ 5.5% - 6.0% ] 5.56% | 313,909 | 12.5% |
[ 5.5% - 6.0% ] 5.75% | 370,061 | 10.4% |
[ 6.0% - 6.5% ] 6.00% | 358,301 | 13.8% |
[ 6.0% - 6.5% ] 6.19% | 67,821 | 12.4% |
[ 6.0% - 6.5% ] 6.43% | 183,080 | 13.8% |
[ 6.5% - 7.0% ] 6.69% | 427,938 | 11.6% |
[ 6.5% - 7.0% ] 6.86% | 156,040 | 13.8% |
[ 7.0% - 7.5% ] 7.20% | 346,080 | 14.3% |
[ 7.0% - 7.5% ] 7.33% | 140,396 | 14.5% |
[ 7.5% - 8.0% ] 7.62% | 7,418 | 8.6% |
[ 7.5% - 8.0% ] 7.80% | 162,063 | 11.2% |
[ 8.0% - 8.5% ] 8.09% | 150,471 | 14.1% |
[ 8.0% - 8.5% ] 8.33% | 138,522 | 10.0% |
[ 8.0% - 8.5% ] 8.49% | 197,052 | 14.8% |
[ 8.5% - 9.0% ] 8.69% | 101,391 | 15.9% |
[ 8.5% - 9.0% ] 8.96% | 154,467 | 13.6% |
[ 9.0% - 9.5% ] 9.25% | 40,619 | 11.3% |
[ 9.5% - 10.0% ] 9.64% | 43,733 | 10.6% |
[ 9.5% - 10.0% ] 9.78% | 139,320 | 15.2% |
[ 10.0% - 10.5% ] 10.13% | 81,502 | 14.1% |
[ 10.0% - 10.5% ] 10.28% | 63,088 | 12.7% |
[ 10.5% - 11.0% ] 10.51% | 123,924 | 15.3% |
[ 10.5% - 11.0% ] 10.84% | 39,495 | 12.4% |
[ 10.5% - 11.0% ] 10.99% | 74,916 | 9.5% |
[ 11.0% - 11.5% ] 11.24% | 94,486 | 10.7% |
[ 11.0% - 11.5% ] 11.38% | 43,517 | 18.6% |
[ 11.5% - 12.0% ] 11.64% | 739 | 13.0% |
[ 11.5% - 12.0% ] 11.84% | 135,158 | 7.4% |
[ 12.0% - 12.5% ] 12.38% | 80,728 | 9.9% |
[ 12.5% - 13.0% ] 12.70% | 14,549 | 9.1% |
[ 12.5% - 13.0% ] 12.81% | 640 | 21.2% |
[ 13.0% - 13.5% ] 13.08% | 3,571 | 6.8% |
[ 14.0% - 14.5% ] 14.23% | 78,506 | 11.8% |
[ 14.0% - 14.5% ] 14.45% | 68,431 | 13.4% |
[ 14.5% - 15.0% ] 14.65% | 13,479 | 18.8% |
[ 14.5% - 15.0% ] 14.77% | 27,845 | 14.6% |
[ 15.5% - 16.0% ] 15.69% | 1,950 | 11.3% |
[ 16.0% - 16.5% ] 16.43% | 121,912 | 9.6% |
[ 17.0% - 17.5% ] 17.21% | 22,486 | 11.5% |
[ 17.5% - 18.0% ] 17.62% | 104,158 | 11.6% |
[ 17.5% - 18.0% ] 17.71% | 72,817 | 15.7% |
[ 19.0% - 19.5% ] 19.03% | 310 | 21.0% |
[ 19.0% - 19.5% ] 19.16% | 62,232 | 13.9% |
[ 19.0% - 19.5% ] 19.31% | 47,516 | 9.1% |
[ 19.5% - 20.0% ] 19.62% | 40,073 | 18.0% |
[ 19.5% - 20.0% ] 19.85% | 72,581 | 16.2% |
[ 20.0% - 20.5% ] 20.02% | 52,792 | 9.6% |
[ 20.0% - 20.5% ] 20.24% | 40,593 | 11.9% |
[ 21.0% - 21.5% ] 21.47% | 35,914 | 13.1% |
[ 22.5% - 23.0% ] 22.90% | 118,819 | 11.7% |
[ 23.5% - 24.0% ] 23.79% | 52,000 | 11.2% |
[ 24.0% - 24.5% ] 24.06% | 10,526 | 12.4% |
[ 26.5% - 27.0% ] 26.59% | 21,977 | 15.7% |
[ 27.0% - 27.5% ] 27.26% | 543 | 12.9% |
[ 28.5% - 29.0% ] 28.55% | 641 | 5.2% |
[ 35.5% - 36.0% ] 35.52% | 2,224 | 14.9% |
[ 45.0% - 45.5% ] 45.38% | 130 | 18.2% |