Jamaican vs Puget Sound Salish 4 or more Vehicles in Household
COMPARE
Jamaican
Puget Sound Salish
4 or more Vehicles in Household
4 or more Vehicles in Household Comparison
Jamaicans
Puget Sound Salish
4.6%
4 OR MORE VEHICLES IN HOUSEHOLD
0.0/ 100
METRIC RATING
318th/ 347
METRIC RANK
9.4%
4 OR MORE VEHICLES IN HOUSEHOLD
100.0/ 100
METRIC RATING
6th/ 347
METRIC RANK
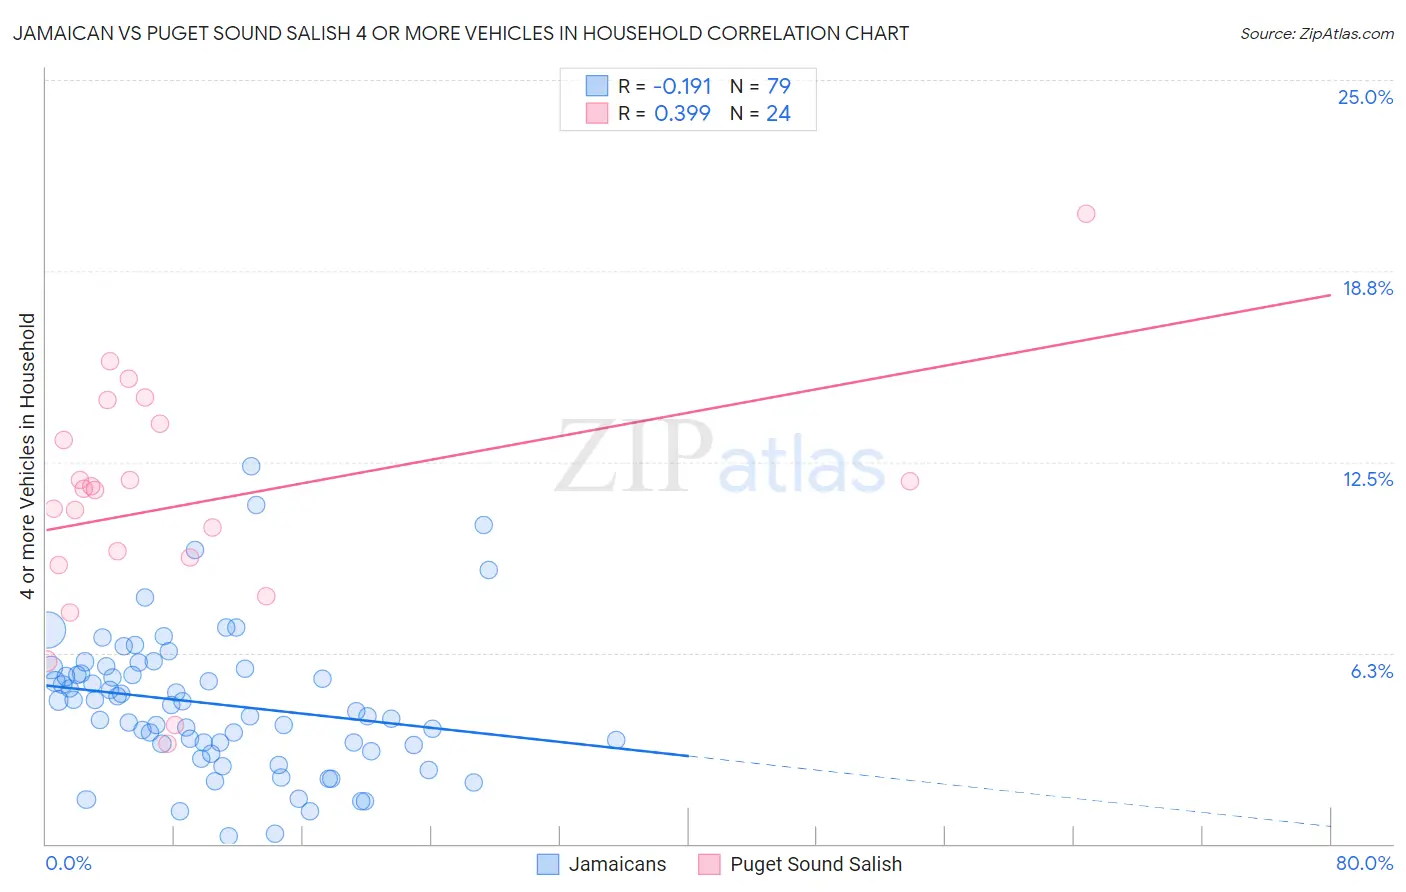
Jamaican vs Puget Sound Salish 4 or more Vehicles in Household Correlation Chart
The statistical analysis conducted on geographies consisting of 366,007,173 people shows a poor negative correlation between the proportion of Jamaicans and percentage of households with 4 or more vehicles available in the United States with a correlation coefficient (R) of -0.191 and weighted average of 4.6%. Similarly, the statistical analysis conducted on geographies consisting of 46,139,594 people shows a mild positive correlation between the proportion of Puget Sound Salish and percentage of households with 4 or more vehicles available in the United States with a correlation coefficient (R) of 0.399 and weighted average of 9.4%, a difference of 102.7%.
4 or more Vehicles in Household Correlation Summary
| Measurement | Jamaican | Puget Sound Salish |
| Minimum | 0.24% | 3.3% |
| Maximum | 12.3% | 20.6% |
| Range | 12.1% | 17.4% |
| Mean | 4.6% | 11.1% |
| Median | 4.5% | 11.6% |
| Interquartile 25% (IQ1) | 3.2% | 9.3% |
| Interquartile 75% (IQ3) | 5.7% | 13.5% |
| Interquartile Range (IQR) | 2.5% | 4.2% |
| Standard Deviation (Sample) | 2.3% | 3.8% |
| Standard Deviation (Population) | 2.3% | 3.8% |
Similar Demographics by 4 or more Vehicles in Household
Demographics Similar to Jamaicans by 4 or more Vehicles in Household
In terms of 4 or more vehicles in household, the demographic groups most similar to Jamaicans are U.S. Virgin Islander (4.6%, a difference of 0.24%), Haitian (4.6%, a difference of 0.65%), Puerto Rican (4.7%, a difference of 1.9%), Immigrants from Belarus (4.7%, a difference of 2.4%), and Immigrants from West Indies (4.7%, a difference of 2.5%).
| Demographics | Rating | Rank | 4 or more Vehicles in Household |
| Houma | 0.0 /100 | #311 | Tragic 4.9% |
| Albanians | 0.0 /100 | #312 | Tragic 4.8% |
| Immigrants | Israel | 0.0 /100 | #313 | Tragic 4.8% |
| Immigrants | West Indies | 0.0 /100 | #314 | Tragic 4.7% |
| Immigrants | Belarus | 0.0 /100 | #315 | Tragic 4.7% |
| Puerto Ricans | 0.0 /100 | #316 | Tragic 4.7% |
| U.S. Virgin Islanders | 0.0 /100 | #317 | Tragic 4.6% |
| Jamaicans | 0.0 /100 | #318 | Tragic 4.6% |
| Haitians | 0.0 /100 | #319 | Tragic 4.6% |
| Immigrants | Haiti | 0.0 /100 | #320 | Tragic 4.5% |
| Ecuadorians | 0.0 /100 | #321 | Tragic 4.5% |
| Immigrants | Yemen | 0.0 /100 | #322 | Tragic 4.5% |
| Immigrants | Caribbean | 0.0 /100 | #323 | Tragic 4.4% |
| Soviet Union | 0.0 /100 | #324 | Tragic 4.4% |
| Immigrants | Jamaica | 0.0 /100 | #325 | Tragic 4.4% |
Demographics Similar to Puget Sound Salish by 4 or more Vehicles in Household
In terms of 4 or more vehicles in household, the demographic groups most similar to Puget Sound Salish are Native Hawaiian (9.4%, a difference of 0.020%), Arapaho (9.4%, a difference of 0.41%), Samoan (9.2%, a difference of 1.8%), Immigrants from Fiji (9.6%, a difference of 2.5%), and Paiute (9.0%, a difference of 4.2%).
| Demographics | Rating | Rank | 4 or more Vehicles in Household |
| Yakama | 100 /100 | #1 | Exceptional 12.9% |
| Colville | 100.0 /100 | #2 | Exceptional 11.1% |
| Spanish American Indians | 100.0 /100 | #3 | Exceptional 10.8% |
| Tongans | 100.0 /100 | #4 | Exceptional 10.0% |
| Immigrants | Fiji | 100.0 /100 | #5 | Exceptional 9.6% |
| Puget Sound Salish | 100.0 /100 | #6 | Exceptional 9.4% |
| Native Hawaiians | 100.0 /100 | #7 | Exceptional 9.4% |
| Arapaho | 100.0 /100 | #8 | Exceptional 9.4% |
| Samoans | 100.0 /100 | #9 | Exceptional 9.2% |
| Paiute | 100.0 /100 | #10 | Exceptional 9.0% |
| Immigrants | Mexico | 100.0 /100 | #11 | Exceptional 9.0% |
| Mexicans | 100.0 /100 | #12 | Exceptional 8.9% |
| Hawaiians | 100.0 /100 | #13 | Exceptional 8.9% |
| Chinese | 100.0 /100 | #14 | Exceptional 8.8% |
| Shoshone | 100.0 /100 | #15 | Exceptional 8.8% |