Immigrants from Lebanon vs Lumbee 4 or more Vehicles in Household
COMPARE
Immigrants from Lebanon
Lumbee
4 or more Vehicles in Household
4 or more Vehicles in Household Comparison
Immigrants from Lebanon
Lumbee
6.3%
4 OR MORE VEHICLES IN HOUSEHOLD
51.7/ 100
METRIC RATING
172nd/ 347
METRIC RANK
8.8%
4 OR MORE VEHICLES IN HOUSEHOLD
100.0/ 100
METRIC RATING
16th/ 347
METRIC RANK
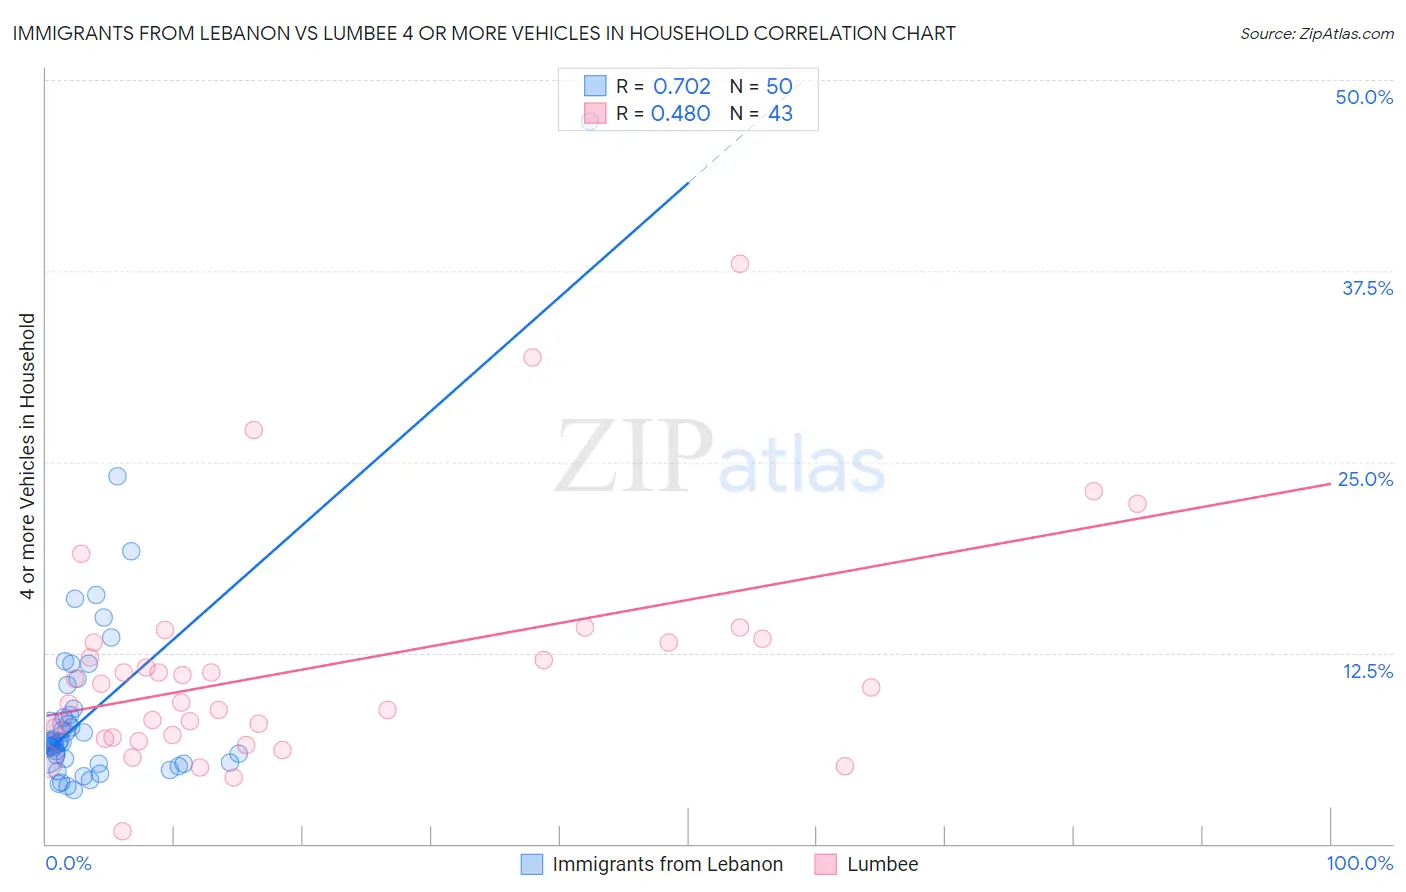
Immigrants from Lebanon vs Lumbee 4 or more Vehicles in Household Correlation Chart
The statistical analysis conducted on geographies consisting of 216,708,139 people shows a strong positive correlation between the proportion of Immigrants from Lebanon and percentage of households with 4 or more vehicles available in the United States with a correlation coefficient (R) of 0.702 and weighted average of 6.3%. Similarly, the statistical analysis conducted on geographies consisting of 92,195,503 people shows a moderate positive correlation between the proportion of Lumbee and percentage of households with 4 or more vehicles available in the United States with a correlation coefficient (R) of 0.480 and weighted average of 8.8%, a difference of 38.6%.
4 or more Vehicles in Household Correlation Summary
| Measurement | Immigrants from Lebanon | Lumbee |
| Minimum | 3.5% | 0.79% |
| Maximum | 47.3% | 38.0% |
| Range | 43.7% | 37.2% |
| Mean | 8.8% | 11.6% |
| Median | 6.6% | 10.3% |
| Interquartile 25% (IQ1) | 5.3% | 7.0% |
| Interquartile 75% (IQ3) | 8.8% | 13.2% |
| Interquartile Range (IQR) | 3.6% | 6.2% |
| Standard Deviation (Sample) | 7.0% | 7.3% |
| Standard Deviation (Population) | 6.9% | 7.2% |
Similar Demographics by 4 or more Vehicles in Household
Demographics Similar to Immigrants from Lebanon by 4 or more Vehicles in Household
In terms of 4 or more vehicles in household, the demographic groups most similar to Immigrants from Lebanon are Immigrants from India (6.3%, a difference of 0.020%), Slovene (6.3%, a difference of 0.060%), Immigrants from Syria (6.3%, a difference of 0.11%), Lithuanian (6.3%, a difference of 0.17%), and Immigrants from Western Europe (6.3%, a difference of 0.29%).
| Demographics | Rating | Rank | 4 or more Vehicles in Household |
| Immigrants | Peru | 59.8 /100 | #165 | Average 6.4% |
| Immigrants | Denmark | 57.8 /100 | #166 | Average 6.4% |
| Poles | 56.9 /100 | #167 | Average 6.4% |
| Lebanese | 55.8 /100 | #168 | Average 6.4% |
| Estonians | 55.1 /100 | #169 | Average 6.4% |
| Immigrants | Syria | 52.8 /100 | #170 | Average 6.3% |
| Immigrants | India | 51.9 /100 | #171 | Average 6.3% |
| Immigrants | Lebanon | 51.7 /100 | #172 | Average 6.3% |
| Slovenes | 51.1 /100 | #173 | Average 6.3% |
| Lithuanians | 50.0 /100 | #174 | Average 6.3% |
| Immigrants | Western Europe | 48.8 /100 | #175 | Average 6.3% |
| Ukrainians | 47.6 /100 | #176 | Average 6.3% |
| Slovaks | 46.9 /100 | #177 | Average 6.3% |
| Belizeans | 44.5 /100 | #178 | Average 6.3% |
| Immigrants | Japan | 43.1 /100 | #179 | Average 6.3% |
Demographics Similar to Lumbee by 4 or more Vehicles in Household
In terms of 4 or more vehicles in household, the demographic groups most similar to Lumbee are Ute (8.8%, a difference of 0.33%), Nepalese (8.7%, a difference of 0.43%), Shoshone (8.8%, a difference of 0.71%), Chinese (8.8%, a difference of 0.74%), and Korean (8.6%, a difference of 1.6%).
| Demographics | Rating | Rank | 4 or more Vehicles in Household |
| Samoans | 100.0 /100 | #9 | Exceptional 9.2% |
| Paiute | 100.0 /100 | #10 | Exceptional 9.0% |
| Immigrants | Mexico | 100.0 /100 | #11 | Exceptional 9.0% |
| Mexicans | 100.0 /100 | #12 | Exceptional 8.9% |
| Hawaiians | 100.0 /100 | #13 | Exceptional 8.9% |
| Chinese | 100.0 /100 | #14 | Exceptional 8.8% |
| Shoshone | 100.0 /100 | #15 | Exceptional 8.8% |
| Lumbee | 100.0 /100 | #16 | Exceptional 8.8% |
| Ute | 100.0 /100 | #17 | Exceptional 8.8% |
| Nepalese | 100.0 /100 | #18 | Exceptional 8.7% |
| Koreans | 100.0 /100 | #19 | Exceptional 8.6% |
| Pueblo | 100.0 /100 | #20 | Exceptional 8.6% |
| Danes | 100.0 /100 | #21 | Exceptional 8.6% |
| Immigrants | Vietnam | 100.0 /100 | #22 | Exceptional 8.6% |
| Immigrants | Philippines | 100.0 /100 | #23 | Exceptional 8.5% |