Dominican vs Barbadian 4 or more Vehicles in Household
COMPARE
Dominican
Barbadian
4 or more Vehicles in Household
4 or more Vehicles in Household Comparison
Dominicans
Barbadians
3.5%
4 OR MORE VEHICLES IN HOUSEHOLD
0.0/ 100
METRIC RATING
341st/ 347
METRIC RANK
3.9%
4 OR MORE VEHICLES IN HOUSEHOLD
0.0/ 100
METRIC RATING
335th/ 347
METRIC RANK
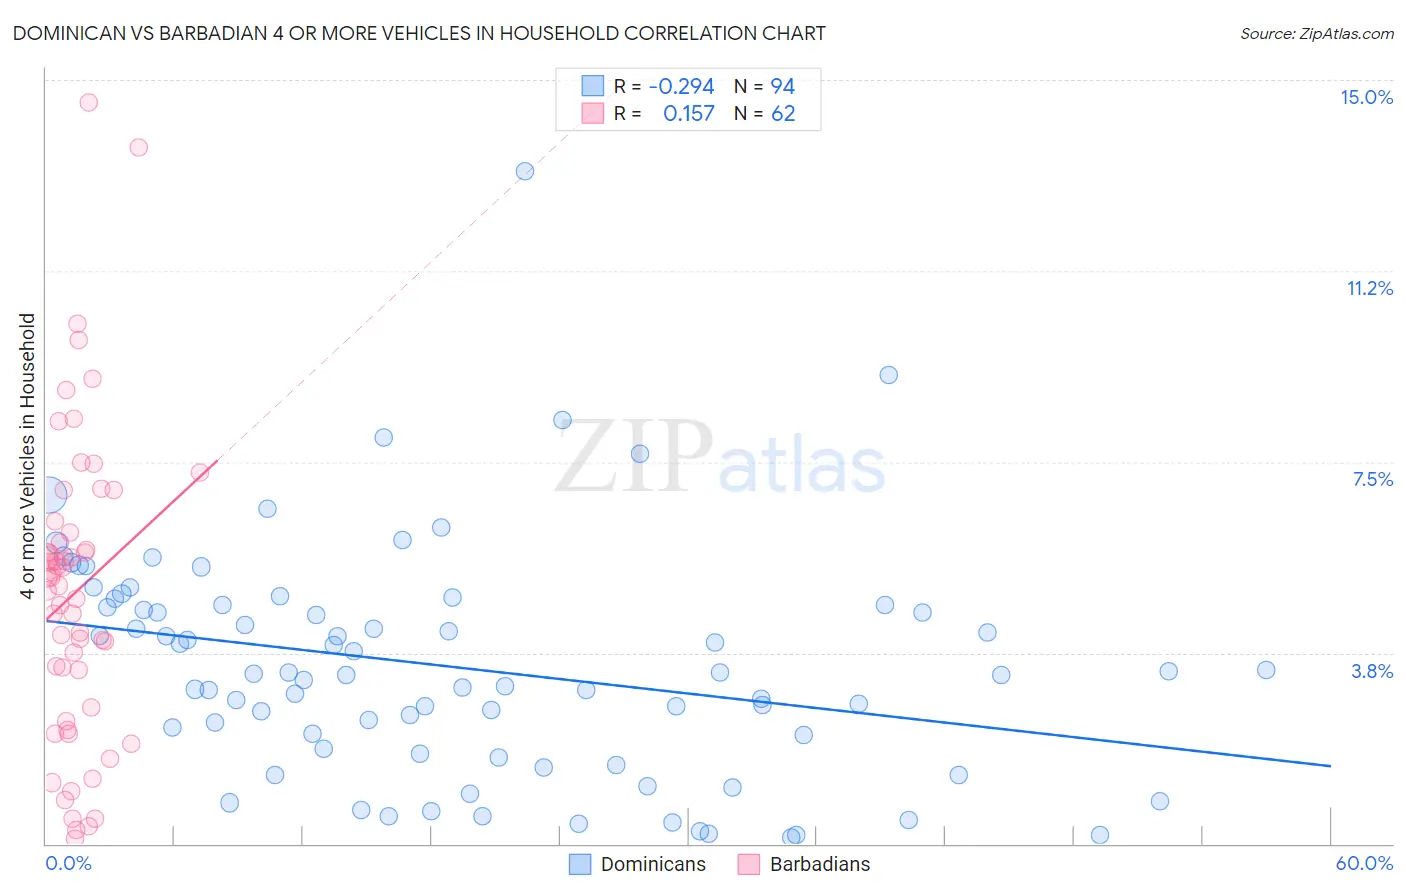
Dominican vs Barbadian 4 or more Vehicles in Household Correlation Chart
The statistical analysis conducted on geographies consisting of 353,073,558 people shows a weak negative correlation between the proportion of Dominicans and percentage of households with 4 or more vehicles available in the United States with a correlation coefficient (R) of -0.294 and weighted average of 3.5%. Similarly, the statistical analysis conducted on geographies consisting of 140,490,439 people shows a poor positive correlation between the proportion of Barbadians and percentage of households with 4 or more vehicles available in the United States with a correlation coefficient (R) of 0.157 and weighted average of 3.9%, a difference of 11.3%.
4 or more Vehicles in Household Correlation Summary
| Measurement | Dominican | Barbadian |
| Minimum | 0.13% | 0.11% |
| Maximum | 13.2% | 14.6% |
| Range | 13.1% | 14.5% |
| Mean | 3.5% | 4.9% |
| Median | 3.3% | 5.1% |
| Interquartile 25% (IQ1) | 1.9% | 2.7% |
| Interquartile 75% (IQ3) | 4.7% | 6.1% |
| Interquartile Range (IQR) | 2.8% | 3.4% |
| Standard Deviation (Sample) | 2.2% | 3.0% |
| Standard Deviation (Population) | 2.2% | 3.0% |
Demographics Similar to Dominicans and Barbadians by 4 or more Vehicles in Household
In terms of 4 or more vehicles in household, the demographic groups most similar to Dominicans are Guyanese (3.5%, a difference of 0.69%), British West Indian (3.5%, a difference of 1.6%), Immigrants from Barbados (3.6%, a difference of 2.8%), Immigrants from Guyana (3.4%, a difference of 3.3%), and Immigrants from Uzbekistan (3.6%, a difference of 3.3%). Similarly, the demographic groups most similar to Barbadians are Immigrants from Bangladesh (3.9%, a difference of 0.18%), Vietnamese (3.9%, a difference of 0.69%), Immigrants from Cabo Verde (3.8%, a difference of 2.5%), Immigrants from Trinidad and Tobago (4.1%, a difference of 5.2%), and Immigrants from Albania (4.1%, a difference of 5.4%).
| Demographics | Rating | Rank | 4 or more Vehicles in Household |
| Trinidadians and Tobagonians | 0.0 /100 | #328 | Tragic 4.3% |
| Immigrants | Senegal | 0.0 /100 | #329 | Tragic 4.2% |
| Immigrants | Ecuador | 0.0 /100 | #330 | Tragic 4.2% |
| West Indians | 0.0 /100 | #331 | Tragic 4.2% |
| Immigrants | Dominica | 0.0 /100 | #332 | Tragic 4.2% |
| Immigrants | Albania | 0.0 /100 | #333 | Tragic 4.1% |
| Immigrants | Trinidad and Tobago | 0.0 /100 | #334 | Tragic 4.1% |
| Barbadians | 0.0 /100 | #335 | Tragic 3.9% |
| Immigrants | Bangladesh | 0.0 /100 | #336 | Tragic 3.9% |
| Vietnamese | 0.0 /100 | #337 | Tragic 3.9% |
| Immigrants | Cabo Verde | 0.0 /100 | #338 | Tragic 3.8% |
| Immigrants | Uzbekistan | 0.0 /100 | #339 | Tragic 3.6% |
| Immigrants | Barbados | 0.0 /100 | #340 | Tragic 3.6% |
| Dominicans | 0.0 /100 | #341 | Tragic 3.5% |
| Guyanese | 0.0 /100 | #342 | Tragic 3.5% |
| British West Indians | 0.0 /100 | #343 | Tragic 3.5% |
| Immigrants | Guyana | 0.0 /100 | #344 | Tragic 3.4% |
| Immigrants | Dominican Republic | 0.0 /100 | #345 | Tragic 3.3% |
| Immigrants | St. Vincent and the Grenadines | 0.0 /100 | #346 | Tragic 3.0% |
| Immigrants | Grenada | 0.0 /100 | #347 | Tragic 2.7% |