Dominican College, Under 1 year
COMPARE
Dominican
Select to Compare
College, Under 1 year
Dominican College, Under 1 year
55.5%
COLLEGE, UNDER 1 YEAR
0.0/ 100
METRIC RATING
331st/ 347
METRIC RANK
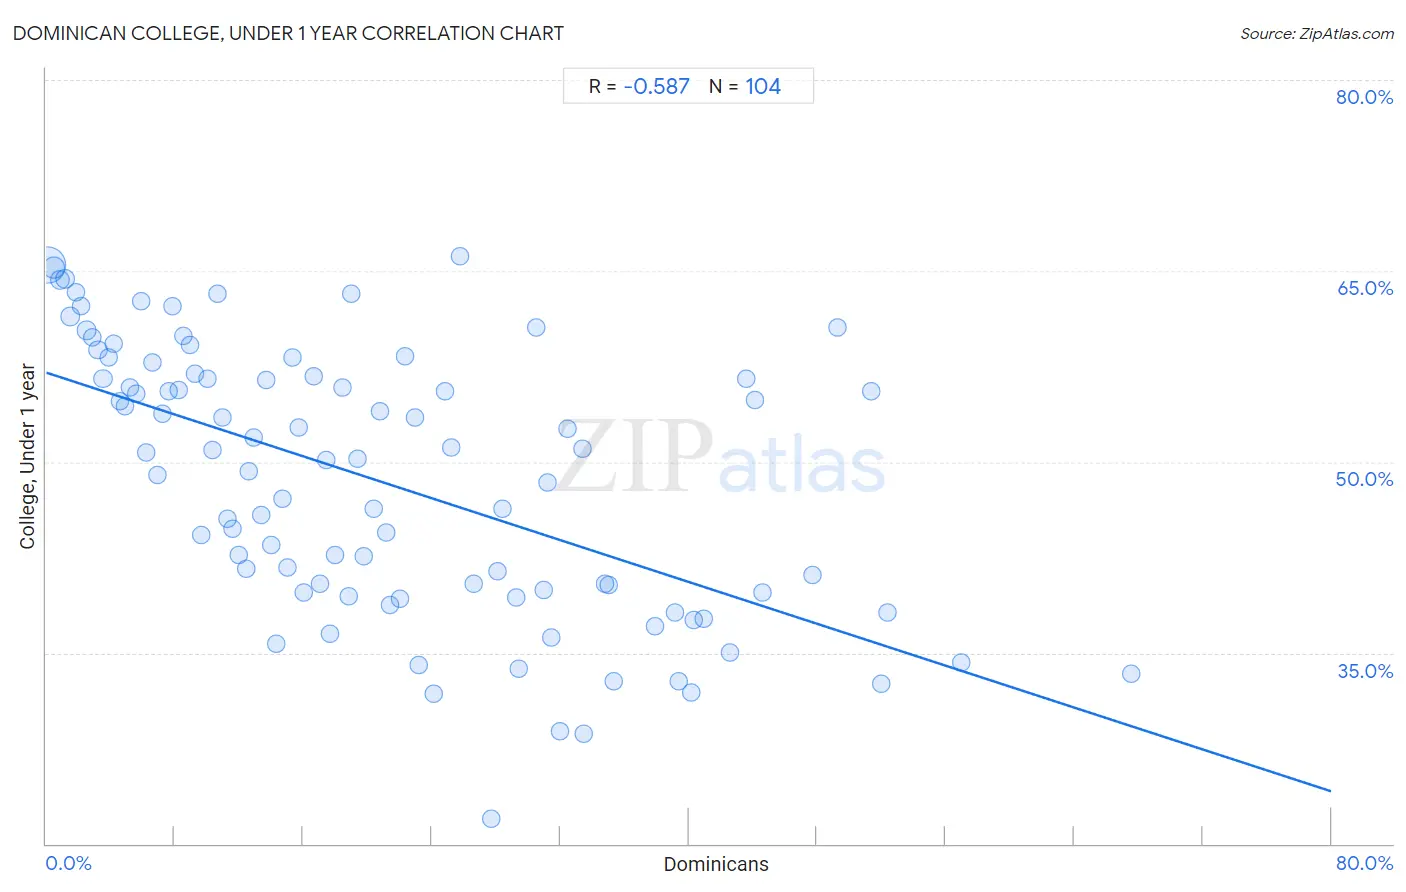
Dominican College, Under 1 year Correlation Chart
The statistical analysis conducted on geographies consisting of 355,140,552 people shows a substantial negative correlation between the proportion of Dominicans and percentage of population with at least college, under 1 year education in the United States with a correlation coefficient (R) of -0.587 and weighted average of 55.5%. On average, for every 1% (one percent) increase in Dominicans within a typical geography, there is a decrease of 0.41% in percentage of population with at least college, under 1 year education.
It is essential to understand that the correlation between the percentage of Dominicans and percentage of population with at least college, under 1 year education does not imply a direct cause-and-effect relationship. It remains uncertain whether the presence of Dominicans influences an upward or downward trend in the level of percentage of population with at least college, under 1 year education within an area, or if Dominicans simply ended up residing in those areas with higher or lower levels of percentage of population with at least college, under 1 year education due to other factors.
Demographics Similar to Dominicans by College, Under 1 year
In terms of college, under 1 year, the demographic groups most similar to Dominicans are Mexican (55.6%, a difference of 0.26%), Immigrants from Cuba (55.7%, a difference of 0.40%), Immigrants from Yemen (55.3%, a difference of 0.41%), Yuman (55.1%, a difference of 0.73%), and Cape Verdean (56.0%, a difference of 1.0%).
| Demographics | Rating | Rank | College, Under 1 year |
| Immigrants from El Salvador | 0.0 /100 | #324 | Tragic 56.4% |
| Immigrants from Latin America | 0.0 /100 | #325 | Tragic 56.3% |
| Navajo | 0.0 /100 | #326 | Tragic 56.3% |
| Immigrants from Guatemala | 0.0 /100 | #327 | Tragic 56.2% |
| Cape Verdeans | 0.0 /100 | #328 | Tragic 56.0% |
| Immigrants from Cuba | 0.0 /100 | #329 | Tragic 55.7% |
| Mexicans | 0.0 /100 | #330 | Tragic 55.6% |
| Dominicans | 0.0 /100 | #331 | Tragic 55.5% |
| Immigrants from Yemen | 0.0 /100 | #332 | Tragic 55.3% |
| Yuman | 0.0 /100 | #333 | Tragic 55.1% |
| Immigrants from the Azores | 0.0 /100 | #334 | Tragic 54.7% |
| Inupiat | 0.0 /100 | #335 | Tragic 54.6% |
| Pennsylvania Germans | 0.0 /100 | #336 | Tragic 54.5% |
| Immigrants from Central America | 0.0 /100 | #337 | Tragic 54.4% |
| Lumbee | 0.0 /100 | #338 | Tragic 54.2% |
Dominican College, Under 1 year Correlation Summary
| Measurement | Dominican Data | College, Under 1 year Data |
| Minimum | 0.11% | 22.0% |
| Maximum | 67.5% | 66.2% |
| Range | 67.4% | 44.2% |
| Mean | 20.8% | 48.5% |
| Median | 17.8% | 50.2% |
| Interquartile 25% (IQ1) | 8.7% | 39.7% |
| Interquartile 75% (IQ3) | 31.1% | 56.6% |
| Interquartile Range (IQR) | 22.4% | 16.9% |
| Standard Deviation (Sample) | 15.0% | 10.5% |
| Standard Deviation (Population) | 14.9% | 10.4% |
Correlation Details
| Dominican Percentile | Sample Size | College, Under 1 year |
[ 0.0% - 0.5% ] 0.11% | 221,743,468 | 65.5% |
[ 0.0% - 0.5% ] 0.48% | 41,269,015 | 65.3% |
[ 0.5% - 1.0% ] 0.83% | 16,301,171 | 64.3% |
[ 1.0% - 1.5% ] 1.17% | 11,630,807 | 64.4% |
[ 1.5% - 2.0% ] 1.52% | 8,977,432 | 61.4% |
[ 1.5% - 2.0% ] 1.84% | 6,713,805 | 63.3% |
[ 2.0% - 2.5% ] 2.19% | 4,143,298 | 62.3% |
[ 2.5% - 3.0% ] 2.50% | 6,623,311 | 60.3% |
[ 2.5% - 3.0% ] 2.86% | 3,706,390 | 59.8% |
[ 3.0% - 3.5% ] 3.22% | 2,688,687 | 58.8% |
[ 3.5% - 4.0% ] 3.53% | 2,900,253 | 56.5% |
[ 3.5% - 4.0% ] 3.89% | 1,550,165 | 58.2% |
[ 4.0% - 4.5% ] 4.23% | 1,300,930 | 59.3% |
[ 4.5% - 5.0% ] 4.56% | 922,557 | 54.8% |
[ 4.5% - 5.0% ] 4.93% | 893,585 | 54.4% |
[ 5.0% - 5.5% ] 5.21% | 950,750 | 55.8% |
[ 5.5% - 6.0% ] 5.58% | 915,480 | 55.4% |
[ 5.5% - 6.0% ] 5.88% | 1,413,677 | 62.6% |
[ 6.0% - 6.5% ] 6.25% | 529,334 | 50.8% |
[ 6.5% - 7.0% ] 6.61% | 931,795 | 57.8% |
[ 6.5% - 7.0% ] 6.94% | 1,042,526 | 49.0% |
[ 7.0% - 7.5% ] 7.22% | 422,097 | 53.8% |
[ 7.5% - 8.0% ] 7.60% | 492,685 | 55.5% |
[ 7.5% - 8.0% ] 7.89% | 523,864 | 62.3% |
[ 8.0% - 8.5% ] 8.23% | 133,403 | 55.6% |
[ 8.5% - 9.0% ] 8.55% | 8,680,543 | 59.9% |
[ 8.5% - 9.0% ] 8.92% | 147,272 | 59.2% |
[ 9.0% - 9.5% ] 9.26% | 476,935 | 56.9% |
[ 9.5% - 10.0% ] 9.67% | 231,977 | 44.2% |
[ 10.0% - 10.5% ] 10.01% | 218,255 | 56.5% |
[ 10.0% - 10.5% ] 10.35% | 458,644 | 51.0% |
[ 10.5% - 11.0% ] 10.66% | 389,731 | 63.2% |
[ 10.5% - 11.0% ] 10.93% | 143,937 | 53.5% |
[ 11.0% - 11.5% ] 11.30% | 222,335 | 45.5% |
[ 11.5% - 12.0% ] 11.62% | 160,059 | 44.8% |
[ 12.0% - 12.5% ] 12.01% | 179,045 | 42.6% |
[ 12.0% - 12.5% ] 12.44% | 29,784 | 41.6% |
[ 12.5% - 13.0% ] 12.60% | 30,253 | 49.3% |
[ 12.5% - 13.0% ] 12.95% | 148,617 | 52.0% |
[ 13.0% - 13.5% ] 13.40% | 187,039 | 45.9% |
[ 13.5% - 14.0% ] 13.69% | 59,864 | 56.4% |
[ 14.0% - 14.5% ] 14.03% | 241,511 | 43.5% |
[ 14.0% - 14.5% ] 14.34% | 21,420 | 35.7% |
[ 14.5% - 15.0% ] 14.70% | 119,137 | 47.1% |
[ 15.0% - 15.5% ] 15.05% | 261,271 | 41.7% |
[ 15.0% - 15.5% ] 15.30% | 254,656 | 58.2% |
[ 15.5% - 16.0% ] 15.73% | 67,652 | 52.7% |
[ 15.5% - 16.0% ] 15.99% | 177,725 | 39.7% |
[ 16.5% - 17.0% ] 16.66% | 178,216 | 56.7% |
[ 17.0% - 17.5% ] 17.01% | 194,109 | 40.4% |
[ 17.0% - 17.5% ] 17.46% | 47,816 | 50.2% |
[ 17.5% - 18.0% ] 17.70% | 119,580 | 36.5% |
[ 17.5% - 18.0% ] 17.99% | 136,680 | 42.7% |
[ 18.0% - 18.5% ] 18.43% | 28,315 | 55.8% |
[ 18.5% - 19.0% ] 18.83% | 115,936 | 39.4% |
[ 18.5% - 19.0% ] 18.98% | 26,322 | 63.2% |
[ 19.0% - 19.5% ] 19.41% | 79,714 | 50.2% |
[ 19.5% - 20.0% ] 19.78% | 87,444 | 42.6% |
[ 20.0% - 20.5% ] 20.37% | 130,234 | 46.3% |
[ 20.5% - 21.0% ] 20.79% | 190,580 | 54.0% |
[ 21.0% - 21.5% ] 21.15% | 125,036 | 44.5% |
[ 21.0% - 21.5% ] 21.42% | 73,231 | 38.8% |
[ 22.0% - 22.5% ] 22.04% | 11,280 | 39.3% |
[ 22.0% - 22.5% ] 22.35% | 10,649 | 58.3% |
[ 22.5% - 23.0% ] 22.94% | 170 | 53.5% |
[ 23.0% - 23.5% ] 23.22% | 191,407 | 34.0% |
[ 24.0% - 24.5% ] 24.10% | 2,332 | 31.8% |
[ 24.5% - 25.0% ] 24.86% | 95,009 | 55.5% |
[ 25.0% - 25.5% ] 25.20% | 14,865 | 51.1% |
[ 25.5% - 26.0% ] 25.76% | 198 | 66.2% |
[ 26.5% - 27.0% ] 26.59% | 151,471 | 40.4% |
[ 27.5% - 28.0% ] 27.71% | 2,021 | 22.0% |
[ 28.0% - 28.5% ] 28.06% | 56,702 | 41.4% |
[ 28.0% - 28.5% ] 28.39% | 701 | 46.3% |
[ 29.0% - 29.5% ] 29.27% | 59,852 | 39.3% |
[ 29.0% - 29.5% ] 29.40% | 160,705 | 33.7% |
[ 30.0% - 30.5% ] 30.50% | 61,044 | 60.5% |
[ 30.5% - 31.0% ] 30.95% | 79,817 | 39.9% |
[ 31.0% - 31.5% ] 31.23% | 24,893 | 48.4% |
[ 31.0% - 31.5% ] 31.45% | 11,069 | 36.2% |
[ 32.0% - 32.5% ] 32.02% | 11,939 | 28.8% |
[ 32.0% - 32.5% ] 32.49% | 237 | 52.6% |
[ 33.0% - 33.5% ] 33.36% | 25,674 | 51.1% |
[ 33.0% - 33.5% ] 33.45% | 16,149 | 28.7% |
[ 34.5% - 35.0% ] 34.77% | 82,678 | 40.5% |
[ 35.0% - 35.5% ] 35.00% | 78,624 | 40.4% |
[ 35.0% - 35.5% ] 35.36% | 49,273 | 32.8% |
[ 37.5% - 38.0% ] 37.93% | 18,461 | 37.1% |
[ 39.0% - 39.5% ] 39.15% | 58,136 | 38.2% |
[ 39.0% - 39.5% ] 39.36% | 6,252 | 32.8% |
[ 40.0% - 40.5% ] 40.17% | 697 | 31.9% |
[ 40.0% - 40.5% ] 40.29% | 111,904 | 37.6% |
[ 40.5% - 41.0% ] 40.92% | 55,226 | 37.7% |
[ 42.5% - 43.0% ] 42.60% | 34,801 | 35.1% |
[ 43.5% - 44.0% ] 43.57% | 60,480 | 56.5% |
[ 44.0% - 44.5% ] 44.09% | 87,063 | 54.9% |
[ 44.5% - 45.0% ] 44.59% | 32,860 | 39.7% |
[ 47.5% - 48.0% ] 47.73% | 81,397 | 41.1% |
[ 49.0% - 49.5% ] 49.23% | 41,570 | 60.5% |
[ 51.0% - 51.5% ] 51.35% | 43,653 | 55.5% |
[ 51.5% - 52.0% ] 52.00% | 6,977 | 32.6% |
[ 52.0% - 52.5% ] 52.39% | 88,067 | 38.1% |
[ 56.5% - 57.0% ] 56.99% | 52,738 | 34.3% |
[ 67.5% - 68.0% ] 67.55% | 151 | 33.3% |