Dominican vs Immigrants from Scotland 4 or more Vehicles in Household
COMPARE
Dominican
Immigrants from Scotland
4 or more Vehicles in Household
4 or more Vehicles in Household Comparison
Dominicans
Immigrants from Scotland
3.5%
4 OR MORE VEHICLES IN HOUSEHOLD
0.0/ 100
METRIC RATING
341st/ 347
METRIC RANK
6.7%
4 OR MORE VEHICLES IN HOUSEHOLD
89.0/ 100
METRIC RATING
130th/ 347
METRIC RANK
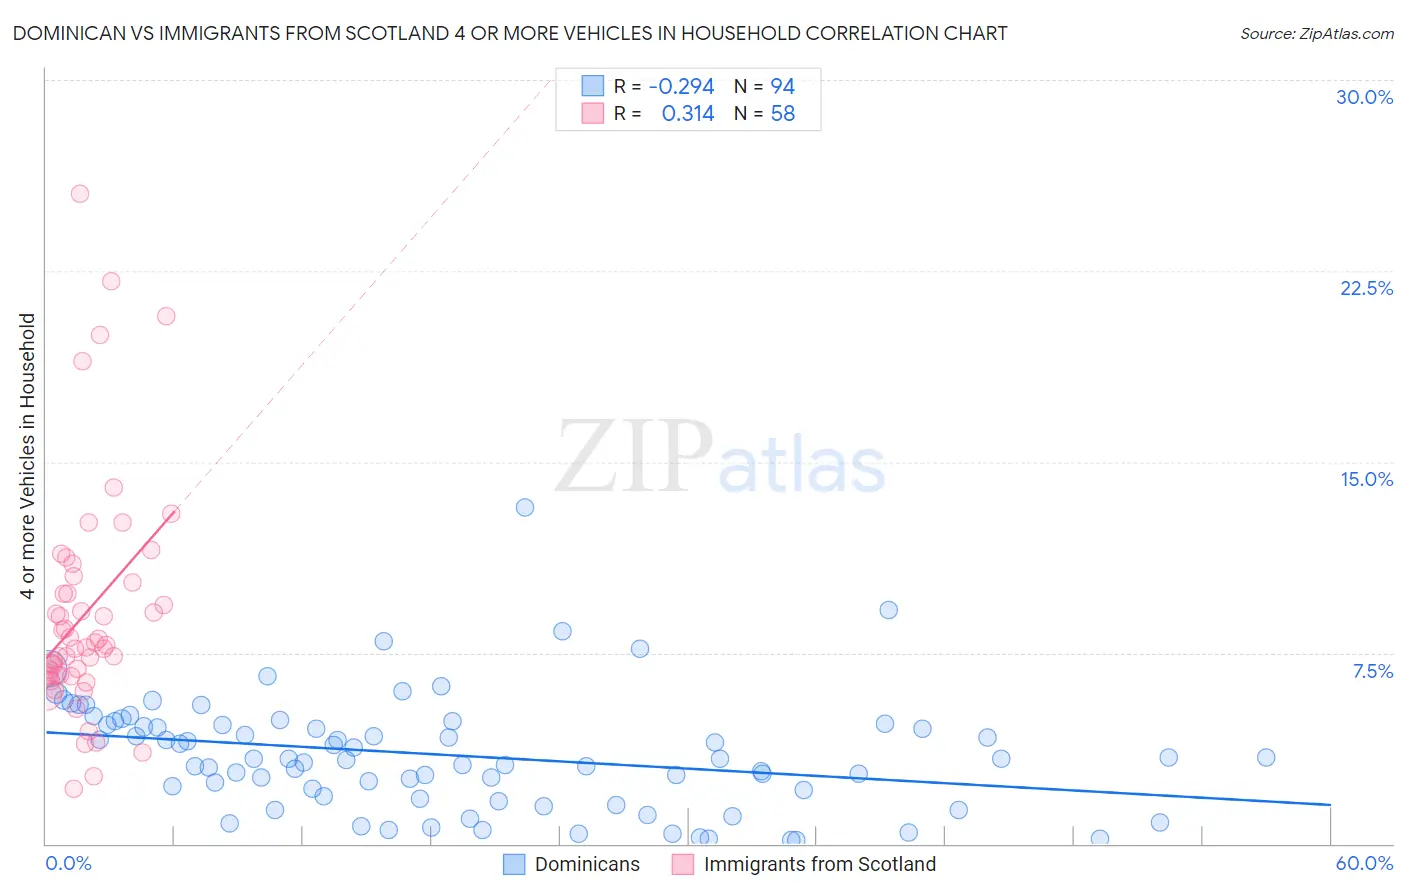
Dominican vs Immigrants from Scotland 4 or more Vehicles in Household Correlation Chart
The statistical analysis conducted on geographies consisting of 353,073,558 people shows a weak negative correlation between the proportion of Dominicans and percentage of households with 4 or more vehicles available in the United States with a correlation coefficient (R) of -0.294 and weighted average of 3.5%. Similarly, the statistical analysis conducted on geographies consisting of 195,944,485 people shows a mild positive correlation between the proportion of Immigrants from Scotland and percentage of households with 4 or more vehicles available in the United States with a correlation coefficient (R) of 0.314 and weighted average of 6.7%, a difference of 89.8%.
4 or more Vehicles in Household Correlation Summary
| Measurement | Dominican | Immigrants from Scotland |
| Minimum | 0.13% | 2.2% |
| Maximum | 13.2% | 25.6% |
| Range | 13.1% | 23.4% |
| Mean | 3.5% | 9.1% |
| Median | 3.3% | 7.7% |
| Interquartile 25% (IQ1) | 1.9% | 6.6% |
| Interquartile 75% (IQ3) | 4.7% | 10.3% |
| Interquartile Range (IQR) | 2.8% | 3.6% |
| Standard Deviation (Sample) | 2.2% | 4.6% |
| Standard Deviation (Population) | 2.2% | 4.6% |
Similar Demographics by 4 or more Vehicles in Household
Demographics Similar to Dominicans by 4 or more Vehicles in Household
In terms of 4 or more vehicles in household, the demographic groups most similar to Dominicans are Guyanese (3.5%, a difference of 0.69%), British West Indian (3.5%, a difference of 1.6%), Immigrants from Barbados (3.6%, a difference of 2.8%), Immigrants from Guyana (3.4%, a difference of 3.3%), and Immigrants from Uzbekistan (3.6%, a difference of 3.3%).
| Demographics | Rating | Rank | 4 or more Vehicles in Household |
| Immigrants | Albania | 0.0 /100 | #333 | Tragic 4.1% |
| Immigrants | Trinidad and Tobago | 0.0 /100 | #334 | Tragic 4.1% |
| Barbadians | 0.0 /100 | #335 | Tragic 3.9% |
| Immigrants | Bangladesh | 0.0 /100 | #336 | Tragic 3.9% |
| Vietnamese | 0.0 /100 | #337 | Tragic 3.9% |
| Immigrants | Cabo Verde | 0.0 /100 | #338 | Tragic 3.8% |
| Immigrants | Uzbekistan | 0.0 /100 | #339 | Tragic 3.6% |
| Immigrants | Barbados | 0.0 /100 | #340 | Tragic 3.6% |
| Dominicans | 0.0 /100 | #341 | Tragic 3.5% |
| Guyanese | 0.0 /100 | #342 | Tragic 3.5% |
| British West Indians | 0.0 /100 | #343 | Tragic 3.5% |
| Immigrants | Guyana | 0.0 /100 | #344 | Tragic 3.4% |
| Immigrants | Dominican Republic | 0.0 /100 | #345 | Tragic 3.3% |
| Immigrants | St. Vincent and the Grenadines | 0.0 /100 | #346 | Tragic 3.0% |
| Immigrants | Grenada | 0.0 /100 | #347 | Tragic 2.7% |
Demographics Similar to Immigrants from Scotland by 4 or more Vehicles in Household
In terms of 4 or more vehicles in household, the demographic groups most similar to Immigrants from Scotland are Maltese (6.7%, a difference of 0.15%), Immigrants from Netherlands (6.6%, a difference of 0.29%), Armenian (6.6%, a difference of 0.48%), Ottawa (6.6%, a difference of 0.50%), and Tohono O'odham (6.6%, a difference of 0.53%).
| Demographics | Rating | Rank | 4 or more Vehicles in Household |
| Immigrants | Immigrants | 94.6 /100 | #123 | Exceptional 6.8% |
| Immigrants | Asia | 94.4 /100 | #124 | Exceptional 6.8% |
| Austrians | 94.1 /100 | #125 | Exceptional 6.8% |
| Belgians | 94.1 /100 | #126 | Exceptional 6.8% |
| Immigrants | Korea | 93.8 /100 | #127 | Exceptional 6.8% |
| Immigrants | Bolivia | 92.5 /100 | #128 | Exceptional 6.7% |
| Immigrants | England | 92.0 /100 | #129 | Exceptional 6.7% |
| Immigrants | Scotland | 89.0 /100 | #130 | Excellent 6.7% |
| Maltese | 88.4 /100 | #131 | Excellent 6.7% |
| Immigrants | Netherlands | 87.8 /100 | #132 | Excellent 6.6% |
| Armenians | 86.9 /100 | #133 | Excellent 6.6% |
| Ottawa | 86.9 /100 | #134 | Excellent 6.6% |
| Tohono O'odham | 86.7 /100 | #135 | Excellent 6.6% |
| Luxembourgers | 86.4 /100 | #136 | Excellent 6.6% |
| French Canadians | 85.4 /100 | #137 | Excellent 6.6% |