Dominican Receiving Food Stamps
COMPARE
Dominican
Select to Compare
Receiving Food Stamps
Dominican Receiving Food Stamps
21.4%
PUBLIC INCOME | FOOD STAMPS
0.0/ 100
METRIC RATING
338th/ 347
METRIC RANK
Dominican Receiving Food Stamps Correlation Chart
The statistical analysis conducted on geographies consisting of 353,995,756 people shows a strong positive correlation between the proportion of Dominicans and percentage of population receiving government assistance and/or food stamps in the United States with a correlation coefficient (R) of 0.702 and weighted average of 21.4%. On average, for every 1% (one percent) increase in Dominicans within a typical geography, there is an increase of 0.55% in percentage of population receiving government assistance and/or food stamps.
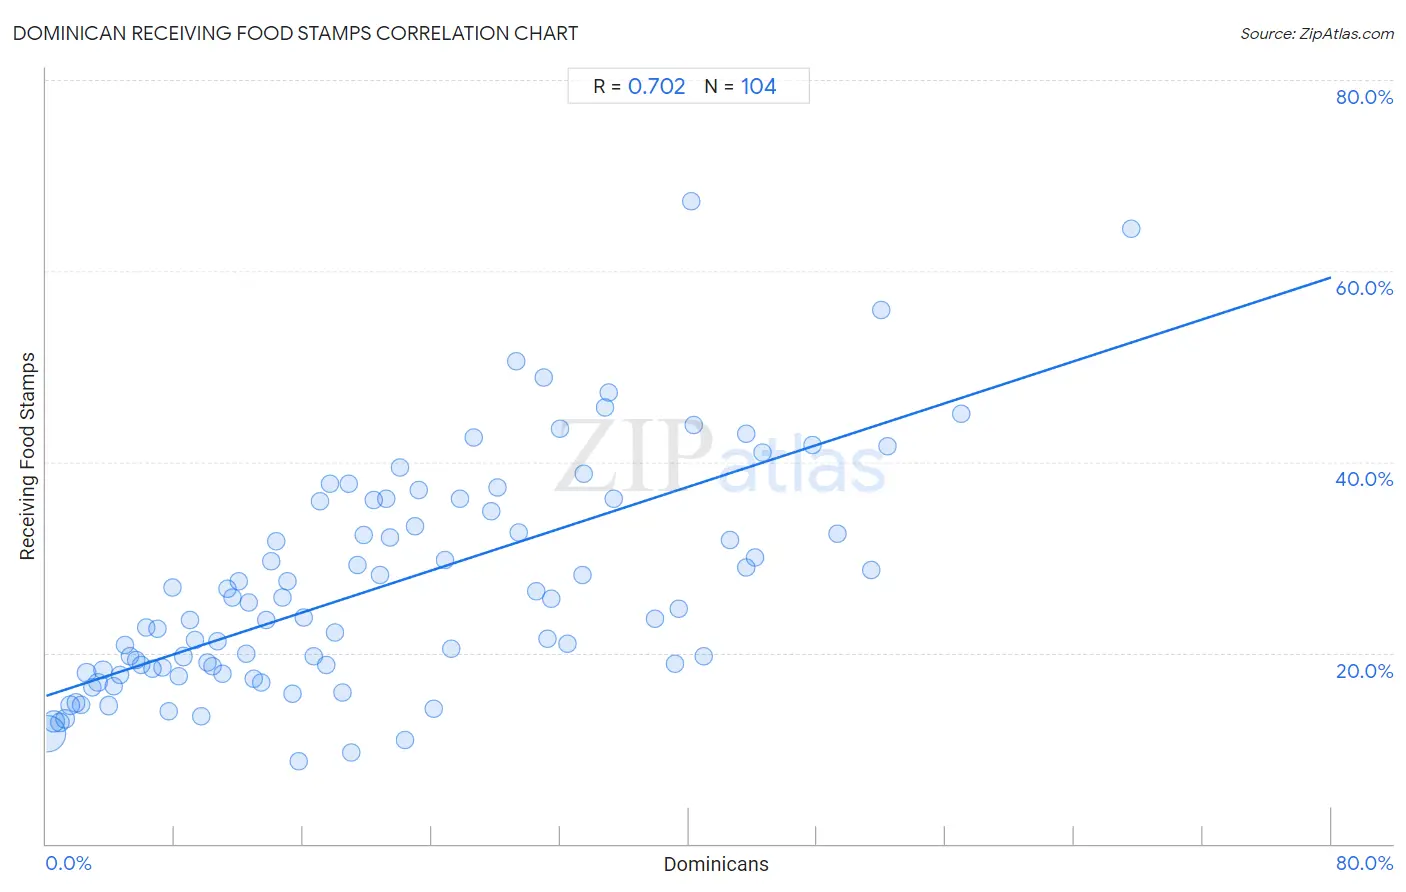
It is essential to understand that the correlation between the percentage of Dominicans and percentage of population receiving government assistance and/or food stamps does not imply a direct cause-and-effect relationship. It remains uncertain whether the presence of Dominicans influences an upward or downward trend in the level of percentage of population receiving government assistance and/or food stamps within an area, or if Dominicans simply ended up residing in those areas with higher or lower levels of percentage of population receiving government assistance and/or food stamps due to other factors.
Demographics Similar to Dominicans by Receiving Food Stamps
In terms of receiving food stamps, the demographic groups most similar to Dominicans are Yakama (21.4%, a difference of 0.26%), Tohono O'odham (21.5%, a difference of 0.52%), Hopi (21.6%, a difference of 0.89%), Immigrants from Yemen (21.6%, a difference of 1.3%), and Cape Verdean (21.1%, a difference of 1.4%).
| Demographics | Rating | Rank | Receiving Food Stamps |
| Immigrants from Caribbean | 0.0 /100 | #331 | Tragic 19.6% |
| Pueblo | 0.0 /100 | #332 | Tragic 19.9% |
| Inupiat | 0.0 /100 | #333 | Tragic 20.1% |
| Yuman | 0.0 /100 | #334 | Tragic 20.2% |
| Immigrants from Cuba | 0.0 /100 | #335 | Tragic 20.8% |
| Navajo | 0.0 /100 | #336 | Tragic 21.1% |
| Cape Verdeans | 0.0 /100 | #337 | Tragic 21.1% |
| Dominicans | 0.0 /100 | #338 | Tragic 21.4% |
| Yakama | 0.0 /100 | #339 | Tragic 21.4% |
| Tohono O'odham | 0.0 /100 | #340 | Tragic 21.5% |
| Hopi | 0.0 /100 | #341 | Tragic 21.6% |
| Immigrants from Yemen | 0.0 /100 | #342 | Tragic 21.6% |
| Immigrants from Dominican Republic | 0.0 /100 | #343 | Tragic 22.1% |
| Lumbee | 0.0 /100 | #344 | Tragic 22.9% |
| Immigrants from Cabo Verde | 0.0 /100 | #345 | Tragic 23.8% |
Dominican Receiving Food Stamps Correlation Summary
| Measurement | Dominican Data | Receiving Food Stamps Data |
| Minimum | 0.11% | 8.7% |
| Maximum | 67.5% | 67.3% |
| Range | 67.4% | 58.6% |
| Mean | 21.0% | 27.0% |
| Median | 17.8% | 24.1% |
| Interquartile 25% (IQ1) | 8.7% | 18.3% |
| Interquartile 75% (IQ3) | 31.3% | 35.4% |
| Interquartile Range (IQR) | 22.6% | 17.1% |
| Standard Deviation (Sample) | 15.1% | 11.8% |
| Standard Deviation (Population) | 15.0% | 11.7% |
Correlation Details
| Dominican Percentile | Sample Size | Receiving Food Stamps |
[ 0.0% - 0.5% ] 0.11% | 221,383,173 | 11.5% |
[ 0.0% - 0.5% ] 0.48% | 41,030,165 | 12.8% |
[ 0.5% - 1.0% ] 0.83% | 16,175,685 | 12.7% |
[ 1.0% - 1.5% ] 1.17% | 11,537,335 | 13.1% |
[ 1.5% - 2.0% ] 1.52% | 8,894,705 | 14.5% |
[ 1.5% - 2.0% ] 1.84% | 6,659,122 | 14.7% |
[ 2.0% - 2.5% ] 2.19% | 4,117,451 | 14.5% |
[ 2.5% - 3.0% ] 2.50% | 6,575,848 | 17.9% |
[ 2.5% - 3.0% ] 2.86% | 3,673,470 | 16.4% |
[ 3.0% - 3.5% ] 3.22% | 2,674,994 | 16.9% |
[ 3.5% - 4.0% ] 3.53% | 2,888,168 | 18.2% |
[ 3.5% - 4.0% ] 3.89% | 1,542,334 | 14.5% |
[ 4.0% - 4.5% ] 4.23% | 1,298,065 | 16.5% |
[ 4.5% - 5.0% ] 4.56% | 919,749 | 17.6% |
[ 4.5% - 5.0% ] 4.94% | 885,594 | 20.8% |
[ 5.0% - 5.5% ] 5.21% | 950,216 | 19.6% |
[ 5.5% - 6.0% ] 5.58% | 906,061 | 19.3% |
[ 5.5% - 6.0% ] 5.88% | 1,413,677 | 18.7% |
[ 6.0% - 6.5% ] 6.25% | 528,326 | 22.7% |
[ 6.5% - 7.0% ] 6.61% | 930,207 | 18.3% |
[ 6.5% - 7.0% ] 6.94% | 1,040,537 | 22.5% |
[ 7.0% - 7.5% ] 7.22% | 422,097 | 18.5% |
[ 7.5% - 8.0% ] 7.60% | 492,685 | 13.9% |
[ 7.5% - 8.0% ] 7.89% | 518,714 | 26.8% |
[ 8.0% - 8.5% ] 8.23% | 131,957 | 17.6% |
[ 8.5% - 9.0% ] 8.55% | 8,677,562 | 19.6% |
[ 8.5% - 9.0% ] 8.92% | 147,272 | 23.4% |
[ 9.0% - 9.5% ] 9.26% | 476,935 | 21.3% |
[ 9.5% - 10.0% ] 9.67% | 228,950 | 13.3% |
[ 10.0% - 10.5% ] 10.01% | 218,255 | 19.0% |
[ 10.0% - 10.5% ] 10.35% | 458,644 | 18.6% |
[ 10.5% - 11.0% ] 10.66% | 389,731 | 21.2% |
[ 10.5% - 11.0% ] 10.93% | 143,937 | 17.9% |
[ 11.0% - 11.5% ] 11.30% | 222,335 | 26.8% |
[ 11.5% - 12.0% ] 11.62% | 160,016 | 25.8% |
[ 12.0% - 12.5% ] 12.01% | 179,045 | 27.5% |
[ 12.0% - 12.5% ] 12.44% | 27,996 | 19.9% |
[ 12.5% - 13.0% ] 12.60% | 30,253 | 25.3% |
[ 12.5% - 13.0% ] 12.95% | 148,617 | 17.3% |
[ 13.0% - 13.5% ] 13.40% | 187,039 | 16.9% |
[ 13.5% - 14.0% ] 13.69% | 59,864 | 23.4% |
[ 14.0% - 14.5% ] 14.03% | 241,511 | 29.5% |
[ 14.0% - 14.5% ] 14.33% | 20,943 | 31.6% |
[ 14.5% - 15.0% ] 14.70% | 119,137 | 25.9% |
[ 15.0% - 15.5% ] 15.05% | 261,271 | 27.5% |
[ 15.0% - 15.5% ] 15.30% | 254,656 | 15.7% |
[ 15.5% - 16.0% ] 15.73% | 67,652 | 8.7% |
[ 15.5% - 16.0% ] 15.99% | 176,953 | 23.7% |
[ 16.5% - 17.0% ] 16.66% | 178,216 | 19.7% |
[ 17.0% - 17.5% ] 17.01% | 193,383 | 35.9% |
[ 17.0% - 17.5% ] 17.46% | 45,500 | 18.7% |
[ 17.5% - 18.0% ] 17.70% | 119,580 | 37.7% |
[ 17.5% - 18.0% ] 17.98% | 135,069 | 22.1% |
[ 18.0% - 18.5% ] 18.43% | 28,315 | 15.8% |
[ 18.5% - 19.0% ] 18.83% | 115,936 | 37.7% |
[ 18.5% - 19.0% ] 18.98% | 26,322 | 9.6% |
[ 19.0% - 19.5% ] 19.41% | 79,714 | 29.2% |
[ 19.5% - 20.0% ] 19.78% | 87,444 | 32.3% |
[ 20.0% - 20.5% ] 20.37% | 130,234 | 36.0% |
[ 20.5% - 21.0% ] 20.79% | 190,580 | 28.1% |
[ 21.0% - 21.5% ] 21.15% | 125,036 | 36.1% |
[ 21.0% - 21.5% ] 21.42% | 73,231 | 32.1% |
[ 22.0% - 22.5% ] 22.04% | 11,280 | 39.4% |
[ 22.0% - 22.5% ] 22.35% | 10,649 | 10.9% |
[ 22.5% - 23.0% ] 22.94% | 170 | 33.3% |
[ 23.0% - 23.5% ] 23.22% | 191,407 | 37.0% |
[ 24.0% - 24.5% ] 24.10% | 2,332 | 14.1% |
[ 24.5% - 25.0% ] 24.86% | 95,009 | 29.7% |
[ 25.0% - 25.5% ] 25.20% | 14,865 | 20.4% |
[ 25.5% - 26.0% ] 25.76% | 198 | 36.2% |
[ 26.5% - 27.0% ] 26.59% | 151,471 | 42.6% |
[ 27.5% - 28.0% ] 27.71% | 2,021 | 34.8% |
[ 28.0% - 28.5% ] 28.06% | 56,702 | 37.4% |
[ 29.0% - 29.5% ] 29.27% | 59,852 | 50.5% |
[ 29.0% - 29.5% ] 29.40% | 160,705 | 32.7% |
[ 30.0% - 30.5% ] 30.50% | 61,044 | 26.4% |
[ 30.5% - 31.0% ] 30.95% | 79,817 | 48.9% |
[ 31.0% - 31.5% ] 31.23% | 24,572 | 21.5% |
[ 31.0% - 31.5% ] 31.45% | 11,069 | 25.6% |
[ 32.0% - 32.5% ] 32.02% | 11,939 | 43.5% |
[ 32.0% - 32.5% ] 32.49% | 237 | 21.0% |
[ 33.0% - 33.5% ] 33.36% | 25,674 | 28.2% |
[ 33.0% - 33.5% ] 33.45% | 16,149 | 38.7% |
[ 34.5% - 35.0% ] 34.77% | 82,678 | 45.7% |
[ 35.0% - 35.5% ] 35.00% | 78,624 | 47.3% |
[ 35.0% - 35.5% ] 35.36% | 49,273 | 36.2% |
[ 37.5% - 38.0% ] 37.93% | 18,461 | 23.6% |
[ 39.0% - 39.5% ] 39.15% | 58,136 | 18.8% |
[ 39.0% - 39.5% ] 39.36% | 6,252 | 24.6% |
[ 40.0% - 40.5% ] 40.17% | 697 | 67.3% |
[ 40.0% - 40.5% ] 40.29% | 111,904 | 43.9% |
[ 40.5% - 41.0% ] 40.92% | 55,226 | 19.7% |
[ 42.5% - 43.0% ] 42.60% | 34,801 | 31.8% |
[ 43.5% - 44.0% ] 43.57% | 60,480 | 29.0% |
[ 43.5% - 44.0% ] 43.59% | 117 | 42.9% |
[ 44.0% - 44.5% ] 44.09% | 87,063 | 29.9% |
[ 44.5% - 45.0% ] 44.59% | 32,860 | 41.0% |
[ 47.5% - 48.0% ] 47.73% | 81,397 | 41.8% |
[ 49.0% - 49.5% ] 49.23% | 41,570 | 32.5% |
[ 51.0% - 51.5% ] 51.35% | 43,653 | 28.7% |
[ 51.5% - 52.0% ] 52.00% | 6,977 | 55.9% |
[ 52.0% - 52.5% ] 52.39% | 88,067 | 41.7% |
[ 56.5% - 57.0% ] 56.99% | 52,738 | 45.0% |
[ 67.5% - 68.0% ] 67.55% | 151 | 64.4% |