Zip Codes with the Highest Percentage of Population Employed in Agriculture, Fishing & Hunting in New Braunfels, TX
RELATED REPORTS & OPTIONS
Agriculture, Fishing & Hunting
New Braunfels
Compare Zip Codes
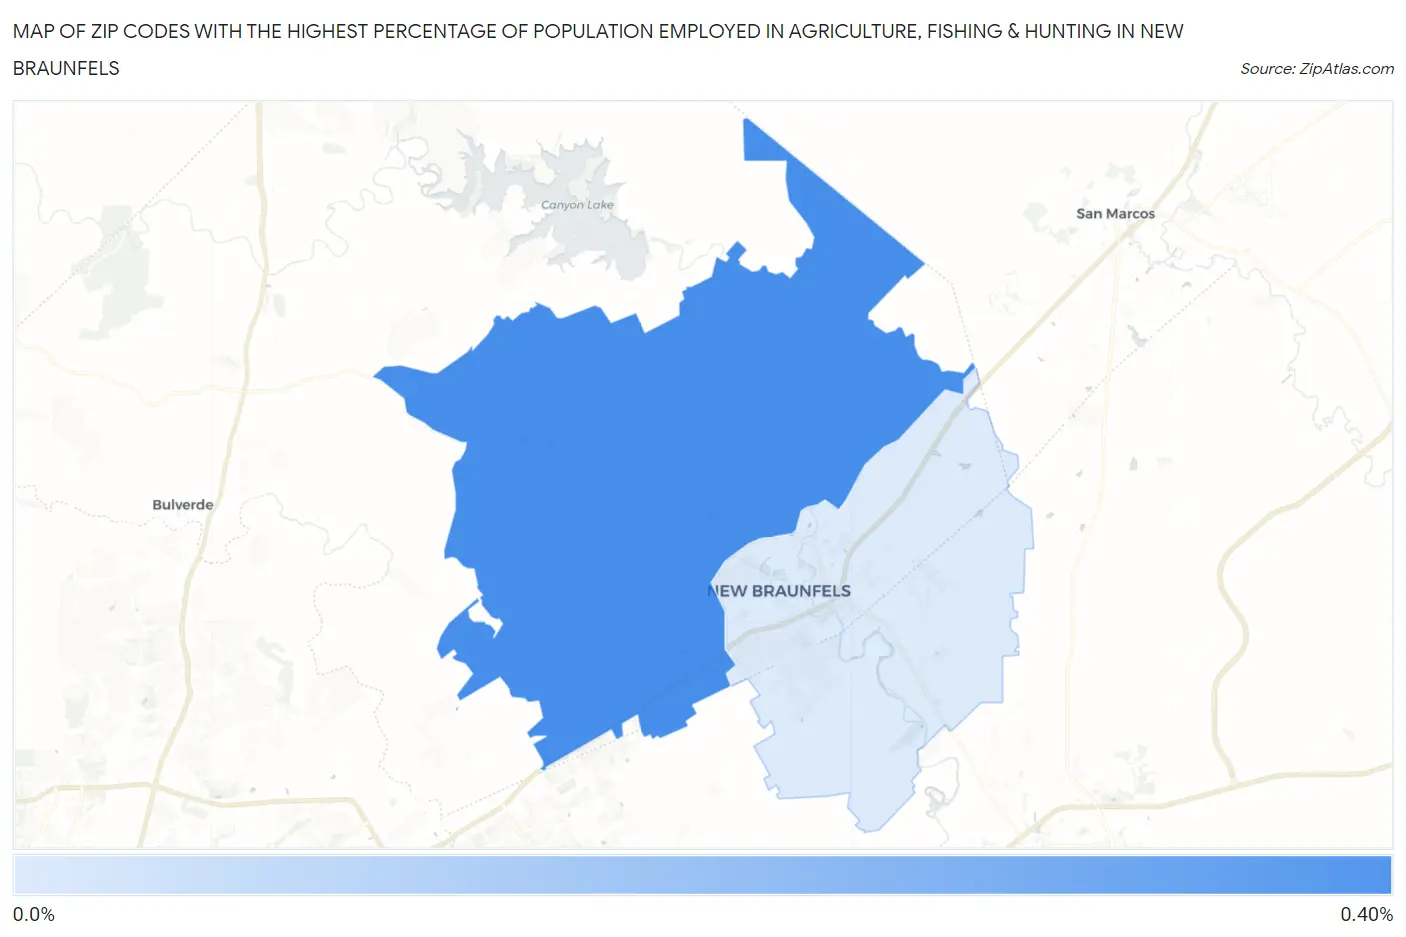
Map of Zip Codes with the Highest Percentage of Population Employed in Agriculture, Fishing & Hunting in New Braunfels
0.072%
0.36%
Zip Codes with the Highest Percentage of Population Employed in Agriculture, Fishing & Hunting in New Braunfels, TX
| Zip Code | % Employed | vs State | vs National | |
| 1. | 78132 | 0.36% | 0.75%(-0.393)#1,123 | 1.2%(-0.841)#20,566 |
| 2. | 78130 | 0.072% | 0.75%(-0.679)#1,392 | 1.2%(-1.13)#24,069 |
1
Common Questions
What are the Top Zip Codes with the Highest Percentage of Population Employed in Agriculture, Fishing & Hunting in New Braunfels, TX?
Top Zip Codes with the Highest Percentage of Population Employed in Agriculture, Fishing & Hunting in New Braunfels, TX are:
What zip code has the Highest Percentage of Population Employed in Agriculture, Fishing & Hunting in New Braunfels, TX?
78132 has the Highest Percentage of Population Employed in Agriculture, Fishing & Hunting in New Braunfels, TX with 0.36%.
What is the Percentage of Population Employed in Agriculture, Fishing & Hunting in New Braunfels, TX?
Percentage of Population Employed in Agriculture, Fishing & Hunting in New Braunfels is 0.075%.
What is the Percentage of Population Employed in Agriculture, Fishing & Hunting in Texas?
Percentage of Population Employed in Agriculture, Fishing & Hunting in Texas is 0.75%.
What is the Percentage of Population Employed in Agriculture, Fishing & Hunting in the United States?
Percentage of Population Employed in Agriculture, Fishing & Hunting in the United States is 1.2%.