Zip Codes with the Highest Percentage of Households with Income Above $100,000 in New Braunfels, TX
RELATED REPORTS & OPTIONS
Household Income | $100k+
New Braunfels
Compare Zip Codes
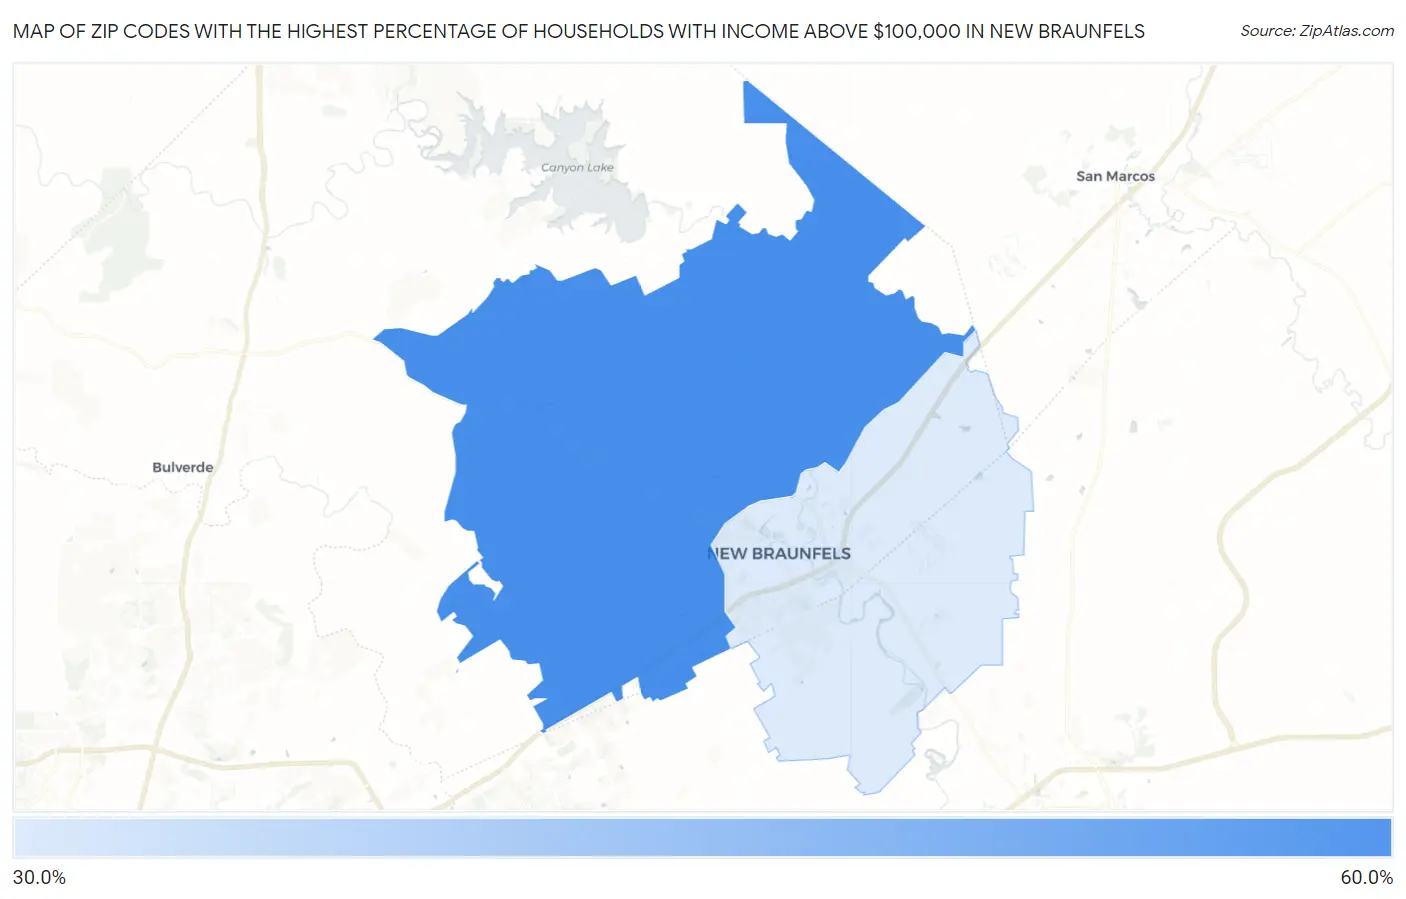
Map of Zip Codes with the Highest Percentage of Households with Income Above $100,000 in New Braunfels
38.9%
59.6%
Zip Codes with the Highest Percentage of Households with Income Above $100,000 in New Braunfels, TX
| Zip Code | Households with Income > $100k | vs State | vs National | |
| 1. | 78132 | 59.6% | 36.2%(+23.4)#119 | 37.3%(+22.3)#2,445 |
| 2. | 78130 | 38.9% | 36.2%(+2.70)#514 | 37.3%(+1.60)#9,457 |
1
Common Questions
What are the Top Zip Codes with the Highest Percentage of Households with Income Above $100,000 in New Braunfels, TX?
Top Zip Codes with the Highest Percentage of Households with Income Above $100,000 in New Braunfels, TX are:
What zip code has the Highest Percentage of Households with Income Above $100,000 in New Braunfels, TX?
78132 has the Highest Percentage of Households with Income Above $100,000 in New Braunfels, TX with 59.6%.
What is the Percentage of Households with Income Above $100,000 in New Braunfels, TX?
Percentage of Households with Income Above $100,000 in New Braunfels is 40.5%.
What is the Percentage of Households with Income Above $100,000 in Texas?
Percentage of Households with Income Above $100,000 in Texas is 36.2%.
What is the Percentage of Households with Income Above $100,000 in the United States?
Percentage of Households with Income Above $100,000 in the United States is 37.3%.