Zip Codes with the Highest Percentage of Population Employed in Health Diagnosing & Treating in Missouri City, TX
RELATED REPORTS & OPTIONS
Health Diagnosing & Treating
Missouri City
Compare Zip Codes
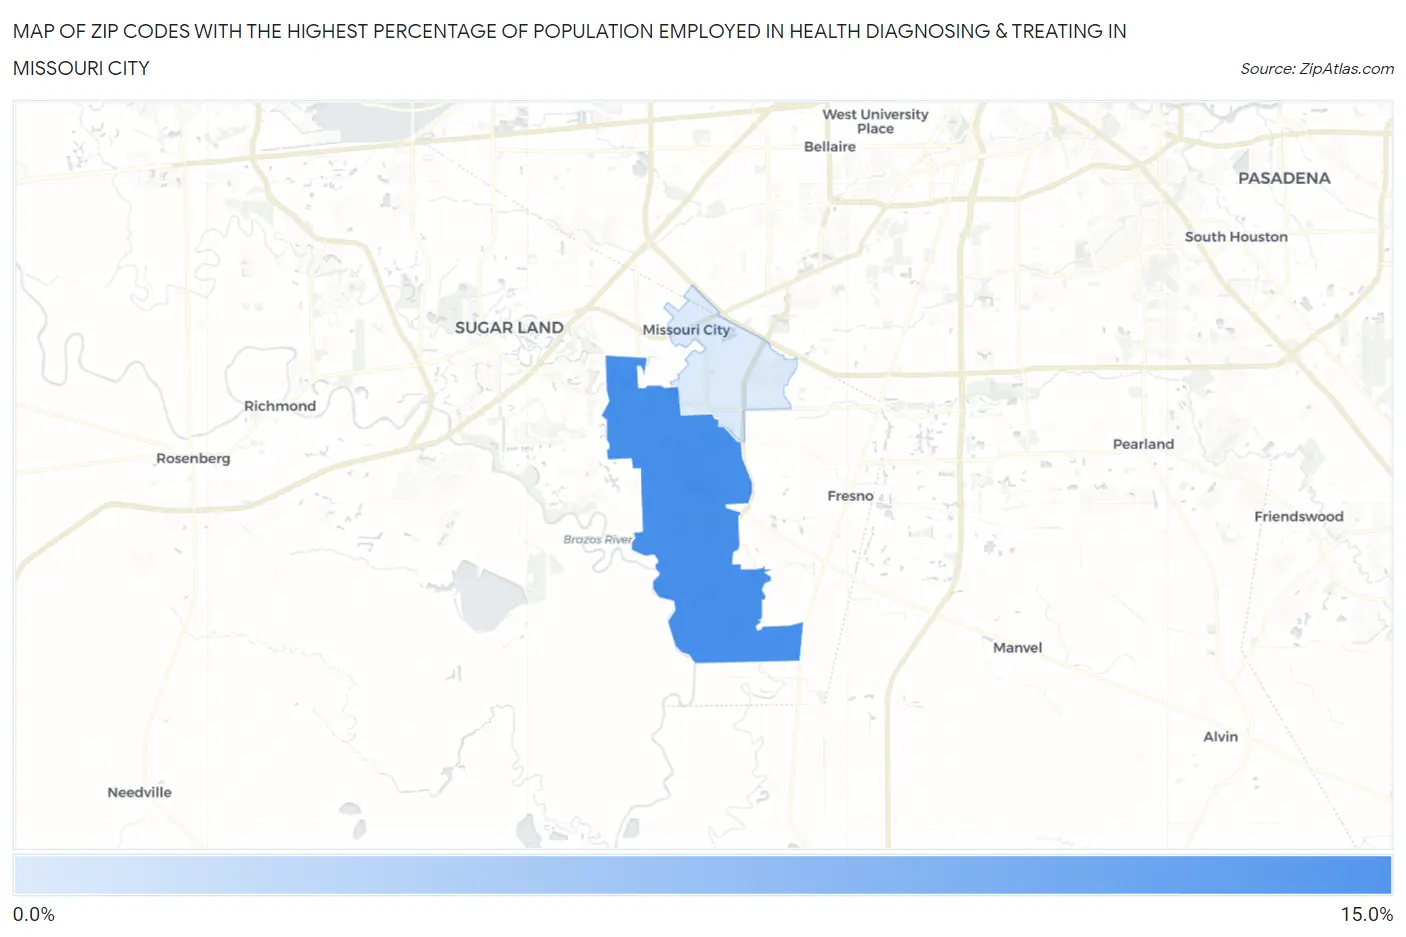
Map of Zip Codes with the Highest Percentage of Population Employed in Health Diagnosing & Treating in Missouri City
5.0%
11.5%
Zip Codes with the Highest Percentage of Population Employed in Health Diagnosing & Treating in Missouri City, TX
| Zip Code | % Employed | vs State | vs National | |
| 1. | 77459 | 11.5% | 5.5%(+5.95)#107 | 6.2%(+5.22)#2,550 |
| 2. | 77489 | 5.0% | 5.5%(-0.533)#831 | 6.2%(-1.26)#17,776 |
1
Common Questions
What are the Top Zip Codes with the Highest Percentage of Population Employed in Health Diagnosing & Treating in Missouri City, TX?
Top Zip Codes with the Highest Percentage of Population Employed in Health Diagnosing & Treating in Missouri City, TX are:
What zip code has the Highest Percentage of Population Employed in Health Diagnosing & Treating in Missouri City, TX?
77459 has the Highest Percentage of Population Employed in Health Diagnosing & Treating in Missouri City, TX with 11.5%.
What is the Percentage of Population Employed in Health Diagnosing & Treating in Missouri City, TX?
Percentage of Population Employed in Health Diagnosing & Treating in Missouri City is 8.5%.
What is the Percentage of Population Employed in Health Diagnosing & Treating in Texas?
Percentage of Population Employed in Health Diagnosing & Treating in Texas is 5.5%.
What is the Percentage of Population Employed in Health Diagnosing & Treating in the United States?
Percentage of Population Employed in Health Diagnosing & Treating in the United States is 6.2%.