Zip Codes with the Highest Percentage of Population Employed in Legal Services & Support in Missouri City, TX
RELATED REPORTS & OPTIONS
Legal Services & Support
Missouri City
Compare Zip Codes
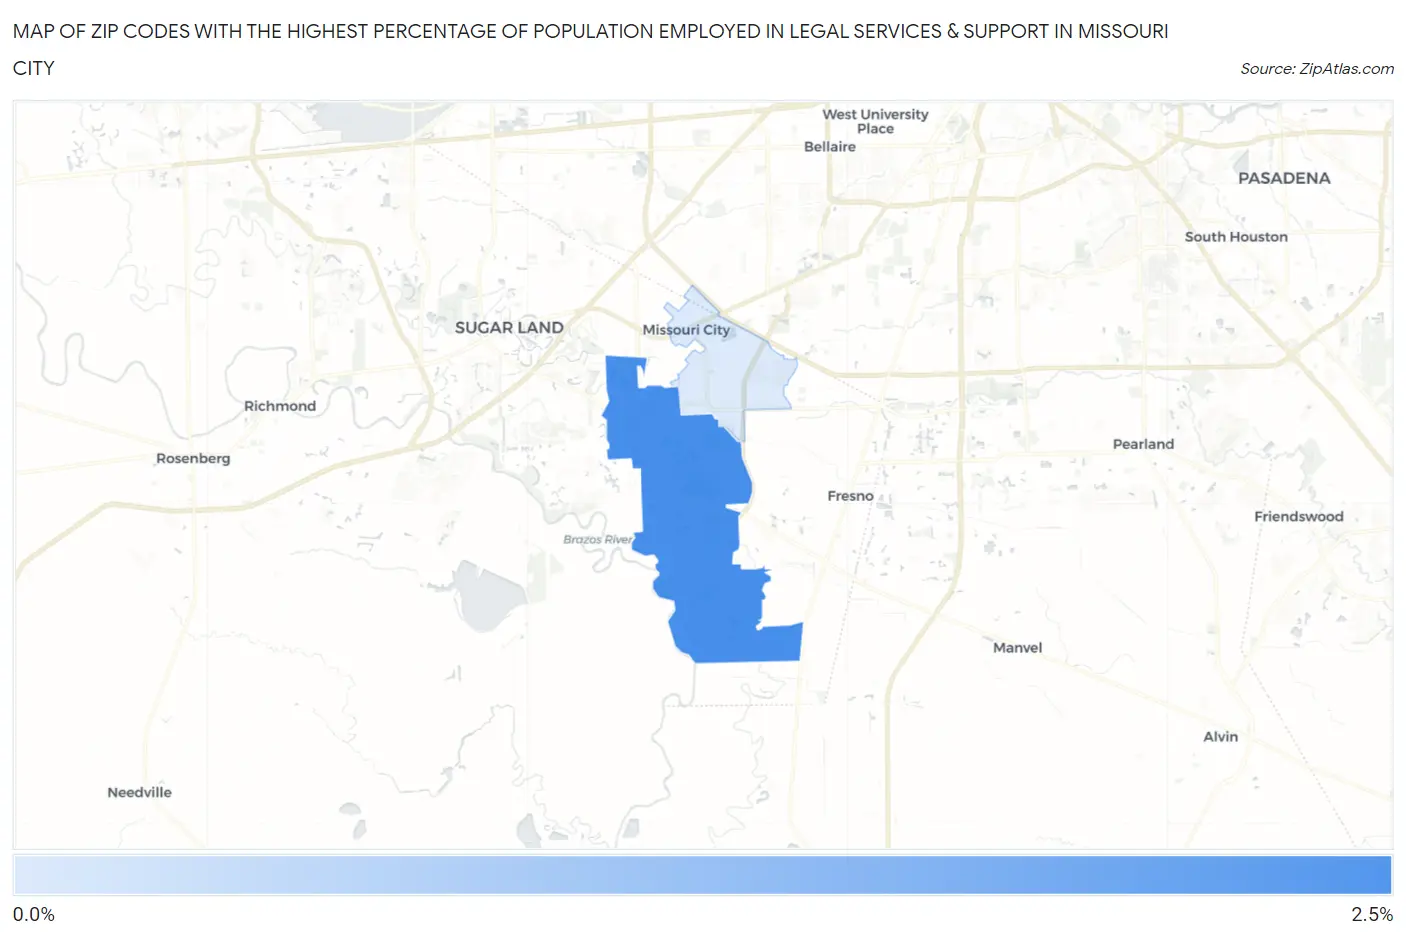
Map of Zip Codes with the Highest Percentage of Population Employed in Legal Services & Support in Missouri City
0.42%
2.1%
Zip Codes with the Highest Percentage of Population Employed in Legal Services & Support in Missouri City, TX
| Zip Code | % Employed | vs State | vs National | |
| 1. | 77459 | 2.1% | 1.0%(+1.05)#172 | 1.2%(+0.878)#3,304 |
| 2. | 77489 | 0.42% | 1.0%(-0.584)#825 | 1.2%(-0.759)#13,559 |
1
Common Questions
What are the Top Zip Codes with the Highest Percentage of Population Employed in Legal Services & Support in Missouri City, TX?
Top Zip Codes with the Highest Percentage of Population Employed in Legal Services & Support in Missouri City, TX are:
What zip code has the Highest Percentage of Population Employed in Legal Services & Support in Missouri City, TX?
77459 has the Highest Percentage of Population Employed in Legal Services & Support in Missouri City, TX with 2.1%.
What is the Percentage of Population Employed in Legal Services & Support in Missouri City, TX?
Percentage of Population Employed in Legal Services & Support in Missouri City is 0.61%.
What is the Percentage of Population Employed in Legal Services & Support in Texas?
Percentage of Population Employed in Legal Services & Support in Texas is 1.0%.
What is the Percentage of Population Employed in Legal Services & Support in the United States?
Percentage of Population Employed in Legal Services & Support in the United States is 1.2%.