Zip Codes with the Highest Percentage of Population Employed in Legal Services & Support in Edinburg, TX
RELATED REPORTS & OPTIONS
Legal Services & Support
Edinburg
Compare Zip Codes
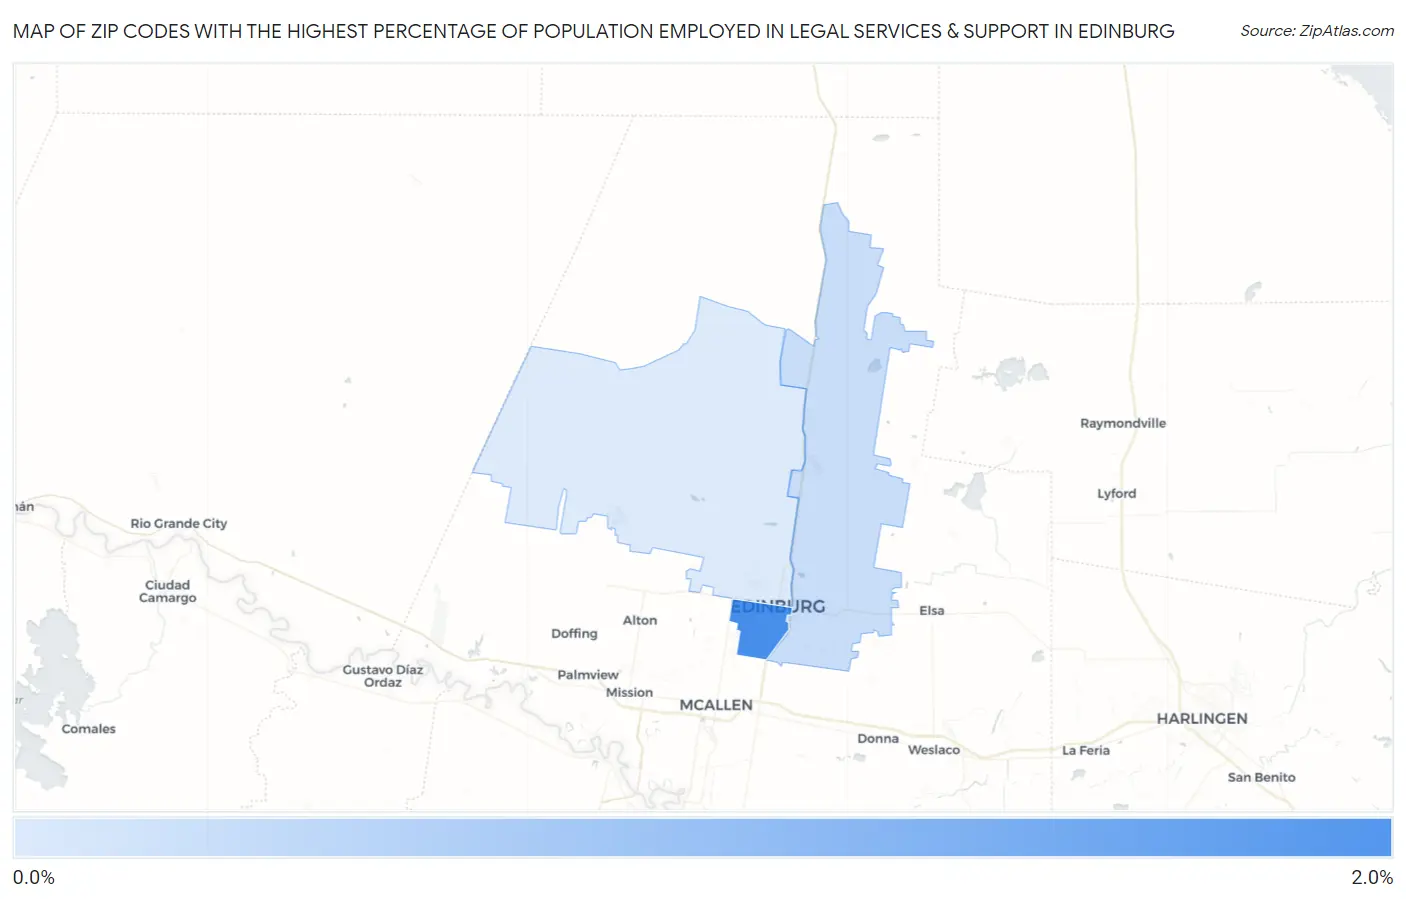
Map of Zip Codes with the Highest Percentage of Population Employed in Legal Services & Support in Edinburg
0.11%
1.8%
Zip Codes with the Highest Percentage of Population Employed in Legal Services & Support in Edinburg, TX
| Zip Code | % Employed | vs State | vs National | |
| 1. | 78539 | 1.8% | 1.0%(+0.833)#208 | 1.2%(+0.657)#3,886 |
| 2. | 78542 | 0.34% | 1.0%(-0.664)#891 | 1.2%(-0.839)#14,533 |
| 3. | 78541 | 0.11% | 1.0%(-0.900)#1,066 | 1.2%(-1.08)#17,052 |
1
Common Questions
What are the Top Zip Codes with the Highest Percentage of Population Employed in Legal Services & Support in Edinburg, TX?
Top Zip Codes with the Highest Percentage of Population Employed in Legal Services & Support in Edinburg, TX are:
What zip code has the Highest Percentage of Population Employed in Legal Services & Support in Edinburg, TX?
78539 has the Highest Percentage of Population Employed in Legal Services & Support in Edinburg, TX with 1.8%.
What is the Percentage of Population Employed in Legal Services & Support in Edinburg, TX?
Percentage of Population Employed in Legal Services & Support in Edinburg is 0.82%.
What is the Percentage of Population Employed in Legal Services & Support in Texas?
Percentage of Population Employed in Legal Services & Support in Texas is 1.0%.
What is the Percentage of Population Employed in Legal Services & Support in the United States?
Percentage of Population Employed in Legal Services & Support in the United States is 1.2%.