Zip Codes with the Highest Percentage of Households with Income Above $100,000 in Edinburg, TX
RELATED REPORTS & OPTIONS
Household Income | $100k+
Edinburg
Compare Zip Codes
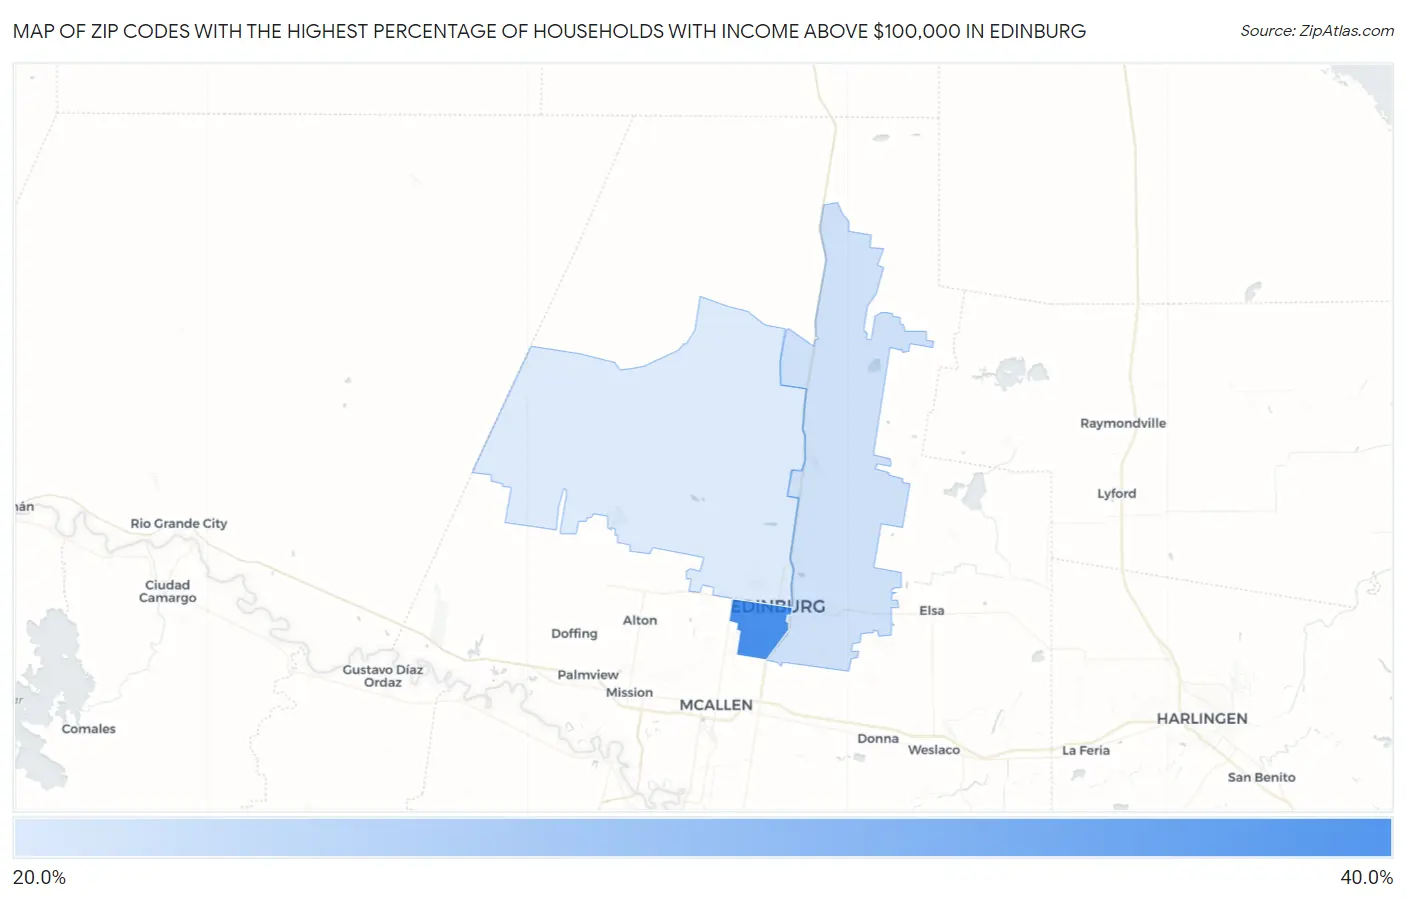
Map of Zip Codes with the Highest Percentage of Households with Income Above $100,000 in Edinburg
21.2%
30.2%
Zip Codes with the Highest Percentage of Households with Income Above $100,000 in Edinburg, TX
| Zip Code | Households with Income > $100k | vs State | vs National | |
| 1. | 78539 | 30.2% | 36.2%(-6.00)#858 | 37.3%(-7.10)#15,263 |
| 2. | 78542 | 22.0% | 36.2%(-14.2)#1,291 | 37.3%(-15.3)#22,378 |
| 3. | 78541 | 21.2% | 36.2%(-15.0)#1,346 | 37.3%(-16.1)#23,064 |
1
Common Questions
What are the Top Zip Codes with the Highest Percentage of Households with Income Above $100,000 in Edinburg, TX?
Top Zip Codes with the Highest Percentage of Households with Income Above $100,000 in Edinburg, TX are:
What zip code has the Highest Percentage of Households with Income Above $100,000 in Edinburg, TX?
78539 has the Highest Percentage of Households with Income Above $100,000 in Edinburg, TX with 30.2%.
What is the Percentage of Households with Income Above $100,000 in Edinburg, TX?
Percentage of Households with Income Above $100,000 in Edinburg is 26.1%.
What is the Percentage of Households with Income Above $100,000 in Texas?
Percentage of Households with Income Above $100,000 in Texas is 36.2%.
What is the Percentage of Households with Income Above $100,000 in the United States?
Percentage of Households with Income Above $100,000 in the United States is 37.3%.