Zip Codes with the Highest Percentage of Population Employed in Sales & Related in Denison, TX
RELATED REPORTS & OPTIONS
Sales & Related
Denison
Compare Zip Codes
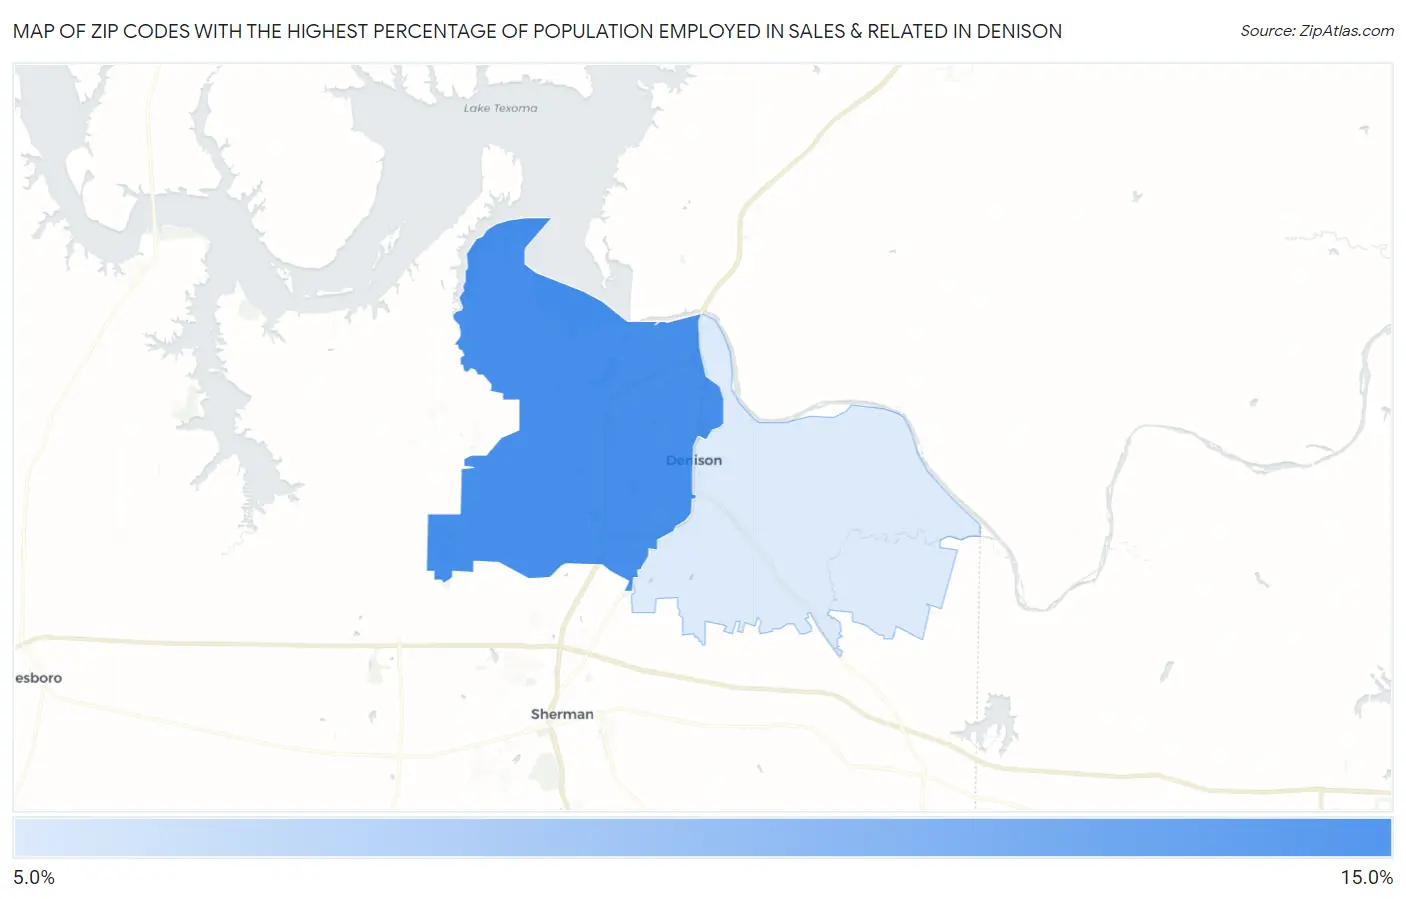
Map of Zip Codes with the Highest Percentage of Population Employed in Sales & Related in Denison
7.2%
13.6%
Zip Codes with the Highest Percentage of Population Employed in Sales & Related in Denison, TX
| Zip Code | % Employed | vs State | vs National | |
| 1. | 75020 | 13.6% | 10.2%(+3.41)#241 | 9.6%(+4.04)#3,814 |
| 2. | 75021 | 7.2% | 10.2%(-3.00)#1,310 | 9.6%(-2.37)#20,557 |
1
Common Questions
What are the Top Zip Codes with the Highest Percentage of Population Employed in Sales & Related in Denison, TX?
Top Zip Codes with the Highest Percentage of Population Employed in Sales & Related in Denison, TX are:
What zip code has the Highest Percentage of Population Employed in Sales & Related in Denison, TX?
75020 has the Highest Percentage of Population Employed in Sales & Related in Denison, TX with 13.6%.
What is the Percentage of Population Employed in Sales & Related in Denison, TX?
Percentage of Population Employed in Sales & Related in Denison is 12.4%.
What is the Percentage of Population Employed in Sales & Related in Texas?
Percentage of Population Employed in Sales & Related in Texas is 10.2%.
What is the Percentage of Population Employed in Sales & Related in the United States?
Percentage of Population Employed in Sales & Related in the United States is 9.6%.